Wider_economic_impacts_of_health_treatments
•
1 j'aime•1,740 vues

Gavin Roberts's presentation AES June 2015

Recommandé
Recommandé
Contenu connexe
Similaire à Wider_economic_impacts_of_health_treatments
Similaire à Wider_economic_impacts_of_health_treatments (20)
Plus de Office of Health Economics
Plus de Office of Health Economics (20)
Dernier
Dernier (20)
Wider_economic_impacts_of_health_treatments
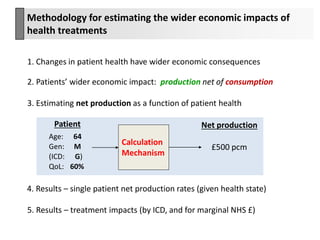
- 1. Methodology for estimating the wider economic impacts of health treatments 1. Changes in patient health have wider economic consequences 2. Patients’ wider economic impact: production net of consumption 3. Estimating net production as a function of patient health 4. Results – single patient net production rates (given health state) Patient Age: 64 Gen: M (ICD: QoL: G) 60% Net production £500 pcm Calculation Mechanism 5. Results – treatment impacts (by ICD, and for marginal NHS £)
- 2. Methodology for estimating the wider economic impacts of health treatments 1. Changes in patient health have wider economic consequences 2. Patients’ wider economic impact: production net of consumption 3. Estimating net production as a function of patient health 4. Results – single patient net production rates (given health state) Patient Age: 64 Gen: M (ICD: QoL: G) 60% Net production £500 pcm Calculation Mechanism 5. Results – treatment impacts (by ICD, and for marginal NHS £)
- 3. Measuring the economic impact of health using net production Health (and treatments) have impacts beyond the patient Health (QALYs) Work more? Pay more tax? Need less benefits? Costs (£) Need less social care? Need less care by family? Economic impact on society (i.e. other people) Contribute to family finances? Look after others? +
- 4. 1. Changes in patient health have wider economic consequences 2. Patients’ wider economic impact: production net of consumption 3. Estimating net production as a function of patient health 4. Results – single patient net production rates (given health state) Patient Age: 64 Gen: M (ICD: QoL: G) 60% Net production £500 pcm Calculation Mechanism 5. Results – treatment impacts (by ICD, and for marginal NHS £) Methodology for estimating the wider economic impacts of health treatments
- 5. Patient Effect on others Family and friends Other members of society Gross production, or contribution of resources (+) Gross consumption, or utilisation of resources (-) Net production +£500pcm +£1,500 pcm -£1,000 pcm Costs, eg spending on nursing home Family income Domestic work Need for informal care by family Govt costs, eg welfare, social care Govt tax revenues Volunteer work Any excess production (consumption) by patient means a benefit (cost) to someone else =£500 pcm Defining production and consumption effects Net production = consumption for others
- 6. Defining production and consumption effects Net production = consumption for others Patient Family and friends Other members of society Gross production, or contribution of resources (+) Gross consumption, or utilisation of resources (-) +£1,500 pcm -£1,000 pcm Costs, eg spending on nursing home Family income Domestic work Need for informal care by family Govt costs, eg welfare, social care Govt tax revenues Volunteer work Any excess production (consumption) by patient means a benefit (cost) to someone else =£500 pcm Net production +£500pcm
- 7. 1. Changes in patient health have wider economic consequences 2. Patients’ wider economic impact: production net of consumption 3. Estimating net production as a function of patient health 4. Results – single patient net production rates (given health state) Patient Age: 64 Gen: M (ICD: QoL: G) 60% Net production £500 pcm Calculation Mechanism 5. Results – treatment impacts (by ICD, and for marginal NHS £) Methodology for estimating the wider economic impacts of health treatments
- 8. Illustrative figures, pcm Gross production: paid labour unpaid labour Gross consumption: formal care informal care personal paid cons. personal unpaid cons. government services Patient Net production £1,500 = £500 pcm £1,000 Age: 64 Gen: M ICD: QoL: G 60% - £1,000 £1,500 International Classification of Disease (Chapter-level) £600 £900 £80 £70 £420 £300 £130 Estimating production and consumption effects Mechanism estimates production / cons as a function of health
- 9. Illustrative figures, pcm Gross production: paid labour unpaid labour Gross consumption: formal care informal care personal paid cons. personal unpaid cons. government services Patient Net production £1,500 = £500 pcm £1,000 Age: 64 Gen: M ICD: QoL: G 60% - £1,000 £1,500 £600 £900 £80 £70 £420 £300 £130 Estimating production and consumption effects Compare to production with treatment to give impact
- 10. paid labour unpaid labour Gross consumption: formal care informal care personal paid cons. personal unpaid cons. government services Patient Net production £1,500 = £500 pcm £1,000 Age: 64 Gen: M ICD: QoL: G 60% - £1,000 £1,500 £1,600 = £700 pcm £900 80% - £900 £1,600 Raising this patient’s QoL from 60% to 80% generates £200pcm in net production Treatment improves QoL by 20% £600 £900 £80 £70 £420 £300 £130 £950 £30 £20 £420 £300 £130 Gross production: £650 Estimating production and consumption effects Compare to production with treatment to give impact Illustrative figures, pcm
- 11. Estimating production and consumption effects Estimating elements as functions of AGIQ – eg paid labour paid labour Patient Age: 64 Gen: M ICD: QoL: G 80% unpaid labour Gross consumption: formal care informal care personal paid cons. personal unpaid cons. government services Net production £1,500 = £500 pcm £1,000 - £1,000 £1,500 £1,600 = £700 pcm £900 - £900 £1,600 £900 £80 £70 £420 £300 £130 £950 £30 £20 £420 £300 £130 Gross production: Illustrative figures, pcm£650
- 12. Estimating production and consumption effects Estimating elements as functions of AGIQ – eg paid labour paid labour Patient Age: 64 Gen: M ICD: QoL: G 80% £650 Understanding Society • “did you do paid work last week?” • SF16 health instrument • age, gender etc ScHARR model • Map SF16 to EQ5D (QoL) • Estimate prob of doing work as f(Age, QoL) ONS wages data • Monthly wage, by Age, Gender if in work -> £ paid labour pcm = f (Age, Gender, QoL) +
- 13. Estimating production and consumption effects Main current data sources Paid labour Unpaid labour Formal care Informal care Personal paid consumption Personal unpaid consumption Government services AGQ AGQ A(I)Q AGIQ A (const) A Element Dependent variables Main data sources Annual Survey of Hours and Earnings (AG) Understanding Society (AQ) Time Use Survey (AG) Sick rate, derived from Understanding Soc. (Q) Adult Soc. Care Survey, GP Patient Survey, PSSRU data HoDAR Living Costs and Food Survey Time Use Survey Public Expenditure Statistical Analysis
- 14. 1. Changes in patient health have wider economic consequences 2. Patients’ wider economic impact: production net of consumption 3. Estimating net production as a function of patient health 4. Results – single patient net production rates (given health state) Patient Age: 64 Gen: M (ICD: QoL: G) 60% Net production £500 pcm Calculation Mechanism 5. Results – treatment impacts (by ICD, and for marginal NHS £) Methodology for estimating the wider economic impacts of health treatments
- 15. Results – paid production £pcm paid production as a function of age and QoL NB this is the rate in a given state – not a treatment impact QoL -500 0 500 1,000 1,500 2,000 2,500 10 20 30 40 50 60 70 80 90 100 Age 0 0.2 0.5 0.7 0.9 1.0 paid labour unpaid labour Gross consumption: formal care informal care personal paid cons. personal unpaid cons. government services Patient Net production (or consumption) Age: 64 Gen: M ICD: QoL: G 60%80% Gross production:
- 16. Results – unpaid production £pcm as a function of age and QoL QoL NB this is the rate in a given state – not a treatment impact 0 500 1,000 1,500 2,000 2,500 10 20 30 40 50 60 70 80 90 100 Age 0 0.2 0.5 0.7 0.9 1.0 paid labour unpaid labour Gross consumption: formal care informal care personal paid cons. personal unpaid cons. government services Patient Net production (or consumption) Age: 64 Gen: M ICD: QoL: G 60%80% Gross production:
- 17. Results – unpaid production – general unpaid labour Hours pcm in full health • Data from Time Use Survey • Diaries identify activity for each 10 min interval 0 50 100 150 200 250 300 350 0 10 20 30 40 50 60 70 80 90 100 Age M - obs F - obs M -pred F - pred • ~3000 activities classified according to whether represent unpaid labour paid labour unpaid labour Gross consumption: formal care informal care personal paid cons. personal unpaid cons. government services Patient Net production (or consumption) Age: 64 Gen: M ICD: QoL: G 60%80% Gross production:
- 18. Results – informal care consumption £pcm as a function of age and QoL QoL NB this is the rate in a given state – not a treatment impact 0 500 1,000 1,500 2,000 2,500 10 20 30 40 50 60 70 80 90 100 Age 0 0.2 0.5 0.7 0.9 1.0 paid labour unpaid labour Gross consumption: formal care informal care personal paid cons. personal unpaid cons. government services Patient Net production (or consumption) Age: 64 Gen: M ICD: QoL: G 60%80% Gross production:
- 19. Results – formal care consumption £pcm as a function of age and QoL QoL NB this is the rate in a given state – not a treatment impact paid labour unpaid labour Gross consumption: formal care informal care personal paid cons. personal unpaid cons. government services Patient Net production (or consumption) Age: 64 Gen: M ICD: QoL: G 60%80% Gross production:
- 20. Results – private paid consumption £pcm as a function of age and QoL QoL NB this is the rate in a given state – not a treatment impact 0 200 400 600 800 1,000 1,200 1,400 10 20 30 40 50 60 70 80 90 100 Age 0 0.2 0.5 0.7 0.9 1.0 paid labour unpaid labour Gross consumption: formal care informal care personal paid cons. personal unpaid cons. government services Patient Net production (or consumption) Age: 64 Gen: M ICD: QoL: G 60%80% Gross production:
- 21. Results – private unpaid consumption £pcm as a function of age and QoL QoL NB this is the rate in a given state – not a treatment impact paid labour unpaid labour Gross consumption: formal care informal care personal paid cons. personal unpaid cons. government services Patient Net production (or consumption) Age: 64 Gen: M ICD: QoL: G 60%80% Gross production:
- 22. Results – Government consumption £pcm as a function of age and QoL QoL NB this is the rate in a given state – not a treatment impact 0 100 200 300 400 500 600 10 20 30 40 50 60 70 80 90 100 Age 0 0.2 0.5 0.7 0.9 1.0 paid labour unpaid labour Gross consumption: formal care informal care personal paid cons. personal unpaid cons. government services Patient Net production (or consumption) Age: 64 Gen: M ICD: QoL: G 60%80% Gross production:
- 23. Results – TOTAL NET PRODUCTION £pcm as a function of age and QoL QoL NB this is the rate in a given state – not a treatment impact -5,000 -4,000 -3,000 -2,000 -1,000 0 1,000 2,000 10 20 30 40 50 60 70 80 90 100 Age 0 0.2 0.5 0.7 0.9 1.0 paid labour Patient Age: 64 Gen: M ICD: QoL: G 80% unpaid labour Gross consumption: formal care informal care personal paid cons. personal unpaid cons. government services Net production (or consumption) Gross production:
- 24. 1. Changes in patient health have wider economic consequences 2. Patients’ wider economic impact: production net of consumption 3. Estimating net production as a function of patient health 4. Results – single patient net production rates (given health state) Patient Age: 64 Gen: M (ICD: QoL: G) 60% Net production £500 pcm Calculation Mechanism 5. Results – treatment impacts (by ICD, and for marginal NHS £) Methodology for estimating the wider economic impacts of health treatments
- 25. Calculating net production effects of health treatments Principle: aggregate over time, like QoL (for QALYs) QoL Net prod (pa) QALY gain £1,000 + £2,000 1 2 Time, yrs 0.5 1.0 = 1.5 QALY untreated treated 1 2 Time, yrs £2,000 untreated treated £1,000 = £3,000 0.5 + 1 Net production impact In principle straightforward – map directly from QoL
- 26. Calculating net production effects of health treatments Practical problem: net production non-linear, esp. over age -5,000 -4,000 -3,000 -2,000 -1,000 0 1,000 2,000 10 20 30 40 50 60 70 80 90 100 Age 0 0.2 0.5 0.7 0.9 1.0 • Cannot use average patient ages • Need to calculate across actual ages for affected population.. • ..or use reference estimates representing population age distribution
- 27. Reference Estimates (1281 ICDs) ICD -eg M06: Rheumatoid Arthritis For each ICD: distrib. of patients (16 AG bins) = £37,745 per QALY gained £ net production + enough data for each bin to calculate all elements of net production 0% 5% 10% 15% 20% 25% 30% 35% 40% 0-4 5-14 15-29 30-44 45-59 60-69 70-79 80+ Patient population distribution F M Age bins Calculating net production effects of health treatments One solution: use reference estimates = £2.52 per £NHS* * Assuming £15,000 marginal cost / QALY
- 28. Production and consumption effects of health treatments M06 Rheumatoid arthritis: results by category, and key inputs 0% 5% 10% 15% 20% 25% 30% 35% 40% 0-4 5-14 15-29 30-44 45-59 60-69 70-79 80+ Patient population distribution F M 0.00 0.05 0.10 0.15 0.20 0.25 0.30 0.35 0.40 0-4 5-14 15-29 30-44 45-59 60-69 70-79 80+ Distribution of QALY gain by QoL vs LoL QoL LoL Total QoL gains LoL gains Total production, £ 26,849 25,691 1,158 Paid production, £ 11,276 11,008 268 Unpaid production, £ 15,573 14,683 890 Total consumption, £ -10,896 -14,601 3,705 Formal care, £ -1,765 -2,293 528 Informal care, £ -13,157 -13,509 352 Private paid consumption, £ 1,492 489 1,003 Private unpaid consumption, £ 1,946 712 1,234 (Childcare consumption), £ 0 0 0 Govt consumption, £ 588 0 588 Net production (prod - cons), £ 37,745 40,292 -2,547
- 29. Production and consumption effects of health treatments M06 Rheumatoid arthritis: paid labour impact
- 30. Production and consumption effects of health treatments M06 Rheumatoid arthritis: informal care impact 0 2 4 6 8 10 12 14 0-4 5-14 15-29 30-44 45-59 60-69 70-79 80+ Ave Informal care need pp, days pcm Untreated Treated
- 31. Results: net production impact of NHS treatments Net production impact in select conditions Code Disease £NP / QALY £NP / £NHS F03 Dementia 40,068 2.67 M05 Rheumatoid arthritis 37,745 2.52 E11 Diabetes 30,969 2.06 M81 Osteoporosis 23,483 1.57 F30 Depression 22,826 1.52 F20 Schizophrenia 19,625 1.31 G20 Parkinson's disease 16,950 1.13 J45 Asthma 16,267 1.08 G40 Epilepsy 16,031 1.07 displ (average displaced QALY) 13,925 0.93 C53 Cervical cancer 11,248 0.75 E66 Obesity 8,524 0.57 C50 Breast cancer 8,072 0.54 I64 Stroke -1,350 -0.09 C18 Colon cancer -2,262 -0.15 I21 Acute myocardial infarction -8,223 -0.55 I26 Embolisms, fibrillation, thrombosis -10,705 -0.71 J10 Influenza -14,982 -1.00 C22 Liver cancer -25,867 -1.72 C34 Lung cancer -29,135 -1.94 C25 Pancreatic cancer -46,141 -3.08
- 32. Results: net production impact of NHS treatments Description of NHS activity at the margin 16 A/G groups F 0-5 F 6-15 F 16-30 F 31-45 F 46-59 F 60-69 F 70-79 F 80+ M 0-5 M 6-15 M 16-30 M 31-45 M 46-59 M 60-69 M 70-79 M 80+ F 0-5 Net prod. / £ -1.27 -1.32 -0.51 1.20 0.55 -0.85 -1.59 -2.31 -1.43 -1.52 -0.59 1.52 0.76 -0.90 -1.63 -2.18 -0.13 0.09 0.72 1.70 1.61 0.24 0.04 -0.01 -0.27 -0.12 0.32 1.83 1.51 -0.08 -0.41 -0.55 -0.15 £1 NHS (margin) F 0-5 F 6-15 F 16-30 F 31-45 F 46-59 F 60-69 F 70-79 F 80+ M 0-5 M 6-15 M 16-30 M 31-45 M 46-59 M 60-69 M 70-79 M 80+ £ Net Prod (margin) 1,281 conditions Abnormal blood-pressure reading, without diagnosis Abnormal findings in cerebrospinal fluid Abnormal findings in specimens from digestive organs & abdominal cavity Abnormal findings in specimens from male genital organs Abnormal findings in specimens from other organs, systems and tissues Abnormal findings in specimens from respiratory organs and thorax Abnormal findings on antenatal screening of mother Abnormal findings on diagnostic imaging of breast Abnormal findings on diagnostic imaging of central nervous system Abnormal findings on diagnostic imaging of lung Abnormal findings on diagnostic imaging of other body structures Abnormal involuntary movements Abnormal results of function studies Abnormal serum enzyme levels Abnormalities of breathing Abnormalities of forces of labour Abnormalities of gait and mobility Abnormalities of heart beat Abnormality of red blood cells Abnormality of white blood cells, not elsewhere classified … Venous complications in pregnancy Venous complications in the puerperium Ventral hernia Viral agents as the cause of disease classified to other chapters Viral and other specified intestinal infections Viral conjunctivitis Viral infection of unspecified site Viral meningitis Viral pneumonia, not elsewhere classified Viral warts Visual disturbances Vitamin A deficiency Vitamin B12 deficiency anaemia Vitamin D deficiency Vitiligo Voice disturbances Volume depletion Whooping cough Yaws Zoster [herpes zoster] Zygomycosis
- 33. Results: net production impact of NHS treatments Net production impact marginal £ spent in NHS Net production, £ 0.93 Production, £ 1.51 Paid production, £ 0.63 Unpaid production, £ 0.89 Consumption, £ 0.59 Formal care consumption, £ -0.02 Informal care consumption, £ -0.17 Private paid consumption, £ 0.29 Private unpaid consumption, £ 0.34 Childcare consumption, £ 0.00 Government consumption, £ 0.14 Direct GDP impact Impact on informal carers Total economic value Total production impact £1 NHS (margin) NB this is additional to value of health itself
- 34. 1. Changes in patient health have wider economic consequences 2. Patients’ wider economic impact: production net of consumption 3. Estimating net production as a function of patient health 4. Results – single patient net production rates (given health state) Patient Age: 64 Gen: M (ICD: QoL: G) 60% Net production £500 pcm Calculation Mechanism 5. Results – treatment impacts (by ICD, and for marginal NHS £) Methodology for estimating the wider economic impacts of health treatments