Kumar Fireworks Hadapsar Link Road Pune Brochure.pdf
December 2012 MLS Statistics
1. December 2012
Area Delimited by Entire OK State MLS -
Single-Family Property Type
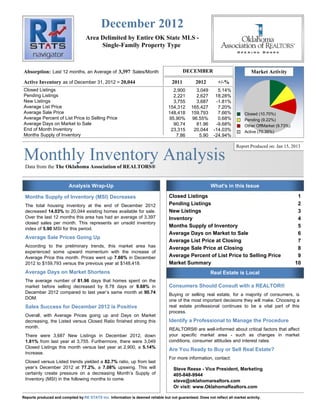
Absorption: Last 12 months, an Average of 3,397 Sales/Month DECEMBER Market Activity
Active Inventory as of December 31, 2012 = 20,044 2011 2012 +/-%
Closed Listings 2,900 3,049 5.14%
Pending Listings 2,221 2,627 18.28%
New Listings 3,755 3,687 -1.81%
Average List Price 154,312 165,427 7.20%
Average Sale Price 148,418 159,793 7.66% Closed (10.70%)
Average Percent of List Price to Selling Price 95.90% 96.55% 0.68% Pending (9.22%)
Average Days on Market to Sale 90.74 81.96 -9.68% Other OffMarket (9.73%)
End of Month Inventory 23,315 20,044 -14.03% Active (70.35%)
Months Supply of Inventory 7.86 5.90 -24.94%
Report Produced on: Jan 15, 2013
Monthly Inventory Analysis
Data from the The Oklahoma Association of REALTORS®
Analysis Wrap-Up What's in this Issue
Months Supply of Inventory (MSI) Decreases Closed Listings 1
The total housing inventory at the end of December 2012 Pending Listings 2
decreased 14.03% to 20,044 existing homes available for sale. New Listings 3
Over the last 12 months this area has had an average of 3,397 Inventory 4
closed sales per month. This represents an unsold inventory
Months Supply of Inventory 5
index of 5.90 MSI for this period.
Average Days on Market to Sale 6
Average Sale Prices Going Up
Average List Price at Closing 7
According to the preliminary trends, this market area has Average Sale Price at Closing 8
experienced some upward momentum with the increase of
Average Price this month. Prices went up 7.66% in December Average Percent of List Price to Selling Price 9
2012 to $159,793 versus the previous year at $148,418. Market Summary 10
Average Days on Market Shortens Real Estate is Local
The average number of 81.96 days that homes spent on the
market before selling decreased by 8.78 days or 9.68% in Consumers Should Consult with a REALTOR®
December 2012 compared to last year’s same month at 90.74 Buying or selling real estate, for a majority of consumers, is
DOM. one of the most important decisions they will make. Choosing a
Sales Success for December 2012 is Positive real estate professional continues to be a vital part of this
process.
Overall, with Average Prices going up and Days on Market
decreasing, the Listed versus Closed Ratio finished strong this Identify a Professional to Manage the Procedure
month. REALTORS® are well-informed about critical factors that affect
There were 3,687 New Listings in December 2012, down your specific market area - such as changes in market
1.81% from last year at 3,755. Furthermore, there were 3,049 conditions, consumer attitudes and interest rates.
Closed Listings this month versus last year at 2,900, a 5.14%
Are You Ready to Buy or Sell Real Estate?
increase.
For more information, contact:
Closed versus Listed trends yielded a 82.7% ratio, up from last
year’s December 2012 at 77.2%, a 7.08% upswing. This will Steve Reese - Vice President, Marketing
certainly create pressure on a decreasing Month’s Supply of 405-848-9944
Inventory (MSI) in the following months to come. steve@oklahomarealtors.com
Or visit: www.OklahomaRealtors.com
Reports produced and compiled by RE STATS Inc. Information is deemed reliable but not guaranteed. Does not reflect all market activity.
2. Monthly Inventory Analysis
Data from the The Oklahoma Association of
REALTORS®
December 2012
Closed Sales as of Jan 12, 2013
Closed Listings Report Produced on: Jan 15, 2013
Area Delimited by Entire OK State MLS - Single-Family Property Type
DECEMBER YEAR TO DATE (YTD)
2008 2009 2010 2011 2012 2008 2009 2010 2011 2012
3,049 40,178 40,765
2,900 38,426
2,674 35,593
2,492 2,542 34,544
1 Year 1 Year
+5.14% +14.53%
2 Year 2 Year
+19.94% +18.01%
5 YEAR MARKET ACTIVITY TRENDS 5yr DEC AVG = 2,731 3 MONTHS
5,000 High O 3,480
Jul 2008 = 4,199 C
4,000
Low T
3,000 Jan 2010 = 1,721 N 3,129
O
Closed Listings
2,000 Closed Listings
this V -10.09%
1,000 month at 3,049,
above the 5 yr DEC D 3,049
E
0
Jun 2008Dec 2008Jun 2009Dec 2009Jun 2010Dec 2010Jun 2011Dec 2011Jun 2012 average of 2,731 C -2.56%
CLOSED LISTINGS & BEDROOMS DISTRIBUTION BY PRICE
Distribution of Closed Listings by Price Range % AVDOM 2 Beds 3 Beds 4 Beds 5 Beds+
$25,000
and less 110 3.61% 84.0 57 41 10 2
$25,001
$75,000 573 18.79% 79.7 211 324 31 7
$75,001
$100,000 327 10.72% 76.4 93 201 30 3
$100,001
Contact an experienced REALTOR
Ready to Buy or Sell Real Estate?
$150,000 780 25.58% 82.5 132 531 113 4
$150,001
$200,000 525 17.22% 85.6 74 310 134 7
$200,001
$275,000 366 12.00% 89.9 48 145 159 14
$275,001
and up 368 12.07% 75.6 40 97 196 35
Total Closed Units: 3,049 82.0 655 1649 673 72
Total Closed Volume: 487,208,038 74.57M 227.00M 161.04M 24.60M
Average Closed Price: $159,793 $113,851 $137,658 $239,290 $341,603
Reports produced and compiled by RE STATS Inc. Information is deemed reliable but not guaranteed. Does not reflect all market activity. pp. 1
Steve Reese 405-848-9944 steve@oklahomarealtors.com
3. Monthly Inventory Analysis
Data from the The Oklahoma Association of
REALTORS®
December 2012
Pending Listings as of Jan 12, 2013
Pending Listings Report Produced on: Jan 15, 2013
Area Delimited by Entire OK State MLS - Single-Family Property Type
DECEMBER YEAR TO DATE (YTD)
2008 2009 2010 2011 2012 2008 2009 2010 2011 2012
2,627 41,894
39,468 38,422
2,221 35,988
2,078 2,036 2,063 34,344
1 Year 1 Year
+18.28% +16.41%
2 Year 2 Year
+27.34% +21.98%
5 YEAR MARKET ACTIVITY TRENDS 5yr DEC AVG = 2,205 3 MONTHS
5,000 High O 3,436
Apr 2010 = 4,934 C
4,000
Low T
3,000 Dec 2009 = 2,036 N 2,945
O
Pending Listings
2,000 Pending Listingsthis V -14.29%
1,000 month at 2,627,
above the 5 yr DEC D 2,627
E
0
Jun 2008Dec 2008Jun 2009Dec 2009Jun 2010Dec 2010Jun 2011Dec 2011Jun 2012 average of 2,205 C -10.80%
PENDING LISTINGS & BEDROOMS DISTRIBUTION BY PRICE
Distribution of Pending Listings by Price Range % AVDOM 2 Beds 3 Beds 4 Beds 5 Beds+
$25,000
and less 102 3.88% 46.7 59 39 2 2
$25,001
$75,000 494 18.80% 69.7 165 296 30 3
$75,001
$100,000 298 11.34% 84.3 72 198 25 3
$100,001
Contact an experienced REALTOR
Ready to Buy or Sell Real Estate?
$150,000 662 25.20% 80.8 121 452 83 6
$150,001
$200,000 477 18.16% 85.1 67 283 123 4
$200,001
$275,000 300 11.42% 85.1 33 114 139 14
$275,001
and up 294 11.19% 88.6 37 58 144 55
Total Pending Units: 2,627 91.6 554 1440 546 87
Total Pending Volume: 412,427,303 65.09M 189.03M 129.02M 29.30M
Average Listing Price: $159,290 $117,484 $131,268 $236,298 $336,740
Reports produced and compiled by RE STATS Inc. Information is deemed reliable but not guaranteed. Does not reflect all market activity. pp. 2
Steve Reese 405-848-9944 steve@oklahomarealtors.com
4. Monthly Inventory Analysis
Data from the The Oklahoma Association of
REALTORS®
December 2012
New Listings as of Jan 12, 2013
New Listings Report Produced on: Jan 15, 2013
Area Delimited by Entire OK State MLS - Single-Family Property Type
DECEMBER YEAR TO DATE (YTD)
2008 2009 2010 2011 2012 2008 2009 2010 2011 2012
4,314 71,039 70,583
3,921 69,073 68,839
3,755 3,687
3,584 65,678
1 Year 1 Year
-1.81% +2.53%
2 Year 2 Year
-14.53% +2.19%
5 YEAR MARKET ACTIVITY TRENDS 5yr DEC AVG = 3,852 3 MONTHS
8,000 High O 5,622
7,000 Apr 2010 = 7,820 C
6,000 Low T
5,000 Dec 2008 = 3,584 N 4,618
4,000 O
New Listings
3,000 New Listings this V -17.86%
2,000 month at 3,687,
1,000 below the 5 yr DEC D 3,687
E
0
Jun 2008Dec 2008Jun 2009Dec 2009Jun 2010Dec 2010Jun 2011Dec 2011Jun 2012 average of 3,852 C -20.16%
NEW LISTINGS & BEDROOMS DISTRIBUTION BY PRICE
Distribution of New Listings by Price Range % 2 Beds 3 Beds 4 Beds 5 Beds+
$25,000
and less 121 3.28% 71 46 2 2
$25,001
$50,000 343 9.30% 137 185 20 1
$50,001
$100,000 879 23.84% 237 567 69 6
$100,001
Contact an experienced REALTOR
Ready to Buy or Sell Real Estate?
$150,000 798 21.64% 147 538 102 11
$150,001
$200,000 578 15.68% 78 338 148 14
$200,001
$300,000 576 15.62% 68 235 244 29
$300,001
and up 392 10.63% 26 84 191 91
Total New Listed Units: 3,687 764 1993 776 154
Total New Listed Volume: 648,560,705 85.16M 282.57M 201.65M 79.18M
Average New Listed Listing Price: $207,845 $111,462 $141,782 $259,864 $514,146
Reports produced and compiled by RE STATS Inc. Information is deemed reliable but not guaranteed. Does not reflect all market activity. pp. 3
Steve Reese 405-848-9944 steve@oklahomarealtors.com
5. Monthly Inventory Analysis
Data from the The Oklahoma Association of
REALTORS®
December 2012
Active Inventory as of Jan 12, 2013
Active Inventory Report Produced on: Jan 15, 2013
Area Delimited by Entire OK State MLS - Single-Family Property Type
END OF DECEMBER ACTIVE DURING DECEMBER
2008 2009 2010 2011 2012 2008 2009 2010 2011 2012
24,377 29,517 28,721
23,312
22,306 27,148
19,996 20,044 24,667 25,443
1 Year 1 Year
-14.02% -11.41%
2 Year 2 Year
-17.77% -13.80%
5 YEAR MARKET ACTIVITY TRENDS 5yr DEC AVG = 22,007 3 MONTHS
Active Inventory
30,000 High O 22,774
Jul 2011 = 27,221 C
Low T
20,000
Jan 2008 = 19,890 N 21,761
O
10,000
Inventory this V -4.45%
month at 20,044,
below the 5 yr DEC D 20,044
E
0
Jun 2008Dec 2008Jun 2009Dec 2009Jun 2010Dec 2010Jun 2011Dec 2011Jun 2012 average of 22,007 C -7.89%
INVENTORY & BEDROOMS DISTRIBUTION BY PRICE
Distribution of Inventory by Price Range % AVDOM 2 Beds 3 Beds 4 Beds 5 Beds+
$50,000
and less 1,925 9.60% 130.2 1,000 800 110 15
$50,001
$75,000 2,115 10.55% 131.3 763 1,176 159 17
$75,001
$100,000 2,555 12.75% 125.1 730 1,578 220 27
$100,001
Contact an experienced REALTOR
Ready to Buy or Sell Real Estate?
$150,000 4,484 22.37% 116.4 862 3,006 566 50
$150,001
$225,000 4,145 20.68% 122.7 690 2,191 1,161 103
$225,001
$350,000 2,778 13.86% 121.2 386 997 1,213 182
$350,001
and up 2,042 10.19% 140.6 193 463 937 449
Total Active Inventory by Units: 20,044 124.8 4,624 10,211 4,366 843
Total Active Inventory by Volume: 3,900,263,730 598.27M 1.57B 1.24B 492.08M
Average Active Inventory Listing Price: $194,585 $129,383 $153,979 $283,472 $583,723
Reports produced and compiled by RE STATS Inc. Information is deemed reliable but not guaranteed. Does not reflect all market activity. pp. 4
Steve Reese 405-848-9944 steve@oklahomarealtors.com
6. Monthly Inventory Analysis
Data from the The Oklahoma Association of
REALTORS®
December 2012
Active Inventory as of Jan 12, 2013
Months Supply of Inventory Report Produced on: Jan 15, 2013
Area Delimited by Entire OK State MLS - Single-Family Property Type
MSI FOR DECEMBER INDICATORS FOR DECEMBER 2012
2008 2009 2010 2011 2012 Inventory Closed Absorption MSI MSI %
8.5 40,765
7.9 5.9 16.948%
6.7 6.2 20,044
5.9
1 Year 3,397
End of Closed Average Months Percent
-24.93% Month Last Closed per Supply Months
2 Year Active 12 Month over of Supply of
-30.32% Inventory Months 12 Months Inventory Inventory
5 YEAR MARKET ACTIVITY TRENDS 5yr DEC AVG = 7.0 3 MONTHS
10 High O 6.8
9 Jun 2011 = 9.8 C
8
Low T
7
6 Jan 2008 = 5.3 N 6.4
5 O
Months Supply
4 Months Supply this V -5.59%
3
2 month at 5.9,
1 below the 5 yr DEC D 5.9
E
0
Jun 2008 Dec 2008Jun 2009 Dec 2009Jun 2010 Dec 2010Jun 2011 Dec 2011Jun 2012 average of 7.0 C -8.23%
MONTHS SUPPLY & BEDROOMS DISTRIBUTION BY PRICE
Distribution of Active Inventory by Price Range and MSI % MSI 2 Beds 3 Beds 4 Beds 5 Beds+
$50,000
and less 1,925 9.60% 4.3 5.3 3.5 3.6 4.0
$50,001
$70,000 1,673 8.35% 6.6 7.3 6.1 6.9 7.8
$70,001
$110,000 3,729 18.60% 6.1 7.3 5.7 5.8 9.6
$110,001
Contact an experienced REALTOR
Ready to Buy or Sell Real Estate?
$170,000 5,241 26.15% 5.1 6.0 5.0 4.9 7.7
$170,001
$230,000 2,874 14.34% 5.8 7.1 5.9 5.0 6.6
$230,001
$350,000 2,560 12.77% 6.6 8.4 7.5 5.6 7.3
$350,001
and up 2,042 10.19% 11.5 17.5 13.2 9.5 13.4
MSI: 5.9 6.7 5.5 5.8 9.5
Total Active Inventory: 20,044 4,624 10,211 4,366 843
Reports produced and compiled by RE STATS Inc. Information is deemed reliable but not guaranteed. Does not reflect all market activity. pp. 5
Steve Reese 405-848-9944 steve@oklahomarealtors.com
7. Monthly Inventory Analysis
Data from the The Oklahoma Association of
REALTORS®
December 2012
Closed Sales as of Jan 12, 2013
Average Days on Market to Sale Report Produced on: Jan 15, 2013
Area Delimited by Entire OK State MLS - Single-Family Property Type
DECEMBER YEAR TO DATE (YTD)
2008 2009 2010 2011 2012 2008 2009 2010 2011 2012
92 91 89
83 82 84 84
80 82 82
1 Year 1 Year
-9.68% -5.88%
2 Year 2 Year
-10.46% +1.70%
5 YEAR MARKET ACTIVITY TRENDS 5yr DEC AVG = 86 3 MONTHS
Average Days on Market
100 High O 83
90 Mar 2011 = 98 C
80
Low T
70
60 May 2010 = 74 N 80
50 O
40 Average DOM this V -3.63%
30
20 month at 82,
10 below the 5 yr DEC D 82
E
0
Jun 2008 Dec 2008Jun 2009 Dec 2009Jun 2010 Dec 2010Jun 2011 Dec 2011Jun 2012 average of 86 C 2.12%
AVERAGE DOM OF CLOSED SALES & BEDROOMS DISTRIBUTION BY PRICE
Distribution of Average Days on Market to Sale by Price Range % AVDOM 2 Beds 3 Beds 4 Beds 5 Beds+
$25,000
and less 110 3.61% 84.0 78.5 89.7 103.6 26.5
$25,001
$75,000 573 18.79% 79.7 87.0 76.4 66.7 65.7
$75,001
$100,000 327 10.72% 76.4 85.9 72.3 64.5 173.0
$100,001
Contact an experienced REALTOR
Ready to Buy or Sell Real Estate?
$150,000 780 25.58% 82.5 107.1 77.4 74.0 188.8
$150,001
$200,000 525 17.22% 85.6 109.7 80.5 83.9 85.0
$200,001
$275,000 366 12.00% 89.9 107.5 91.3 82.2 103.6
$275,001
and up 368 12.07% 75.6 64.6 90.9 69.7 78.3
Average Closed DOM: 82.0 92.9 79.5 76.3 91.3
Total Closed Units: 3,049 655 1649 673 72
Total Closed Volume: 487,208,038 74.57M 227.00M 161.04M 24.60M
Reports produced and compiled by RE STATS Inc. Information is deemed reliable but not guaranteed. Does not reflect all market activity. pp. 6
Steve Reese 405-848-9944 steve@oklahomarealtors.com
8. Monthly Inventory Analysis
Data from the The Oklahoma Association of
REALTORS®
December 2012
Closed Sales as of Jan 12, 2013
Average List Price at Closing Report Produced on: Jan 15, 2013
Area Delimited by Entire OK State MLS - Single-Family Property Type
DECEMBER YEAR TO DATE (YTD)
2008 2009 2010 2011 2012 2008 2009 2010 2011 2012
165,427 166,007
160,614
154,312 152,756 154,332
145,632 146,900 151,508 148,065
1 Year 1 Year
+7.20% +7.56%
2 Year 2 Year
+3.00% +8.67%
5 YEAR MARKET ACTIVITY TRENDS 5yr DEC AVG = 155K 3 MONTHS
Average List Price
300,000 High O 162,445
May 2012 = 213,995 C
Low T
200,000
Nov 2008 = 135,950 N 168,341
O
100,000
Average LPrice this V 3.63%
month at 165,427,
above the 5 yr DEC D 165,427
E
0
Jun 2008Dec 2008
Jun 2009Dec 2009
Jun 2010Dec 2010
Jun 2011Dec 2011
Jun 2012 average of 154,577 C -1.73%
AVERAGE LIST PRICE OF CLOSED SALES & BEDROOMS DISTRIBUTION BY PRICE
Distribution of Average List Price at Closing by Price Range % AVL$ 2 Beds 3 Beds 4 Beds 5 Beds+
$25,000
and less 100 3.28% 18,234 20,422 20,212 18,637 18,700
$25,001
$75,000 543 17.81% 52,505 53,922 55,245 56,581 57,889
$75,001
$100,000 336 11.02% 88,313 91,281 90,942 100,353 87,233
$100,001
Contact an experienced REALTOR
Ready to Buy or Sell Real Estate?
$150,000 747 24.50% 127,479 130,694 129,421 134,370 157,106
$150,001
$200,000 576 18.89% 174,223 177,757 175,679 179,712 193,216
$200,001
$275,000 352 11.54% 236,345 237,318 239,540 243,236 237,912
$275,001
and up 395 12.96% 419,261 372,989 406,020 423,575 583,009
Average List Price: $165,427 $118,698 $142,091 $246,525 $366,963
Total Closed Units: 3,049 655 1649 673 72
Total List Volume: 504,388,042 77.75M 234.31M 165.91M 26.42M
Reports produced and compiled by RE STATS Inc. Information is deemed reliable but not guaranteed. Does not reflect all market activity. pp. 7
Steve Reese 405-848-9944 steve@oklahomarealtors.com
9. Monthly Inventory Analysis
Data from the The Oklahoma Association of
REALTORS®
December 2012
Closed Sales as of Jan 12, 2013
Average Sold Price at Closing Report Produced on: Jan 15, 2013
Area Delimited by Entire OK State MLS - Single-Family Property Type
DECEMBER YEAR TO DATE (YTD)
2008 2009 2010 2011 2012 2008 2009 2010 2011 2012
159,793 160,385
153,544
148,418 146,726 147,055 148,251
139,881 141,455 142,872
1 Year 1 Year
+7.66% +8.18%
2 Year 2 Year
+4.07% +9.06%
5 YEAR MARKET ACTIVITY TRENDS 5yr DEC AVG = 149K 3 MONTHS
Average Sold Price
300,000 High O 156,951
May 2012 = 208,717 C
Low T
200,000
Nov 2008 = 131,192 N 162,759
O
100,000
Average SPrice this V 3.70%
month at 159,793,
above the 5 yr DEC D 159,793
E
0
Jun 2008Dec 2008
Jun 2009Dec 2009
Jun 2010Dec 2010
Jun 2011Dec 2011
Jun 2012 average of 148,618 C -1.82%
AVERAGE SOLD PRICE OF CLOSED SALES & BEDROOMS DISTRIBUTION BY PRICE
Distribution of Average Sold Price at Closing by Price Range % AVS$ 2 Beds 3 Beds 4 Beds 5 Beds+
$25,000
and less 110 3.61% 17,794 17,785 17,808 16,898 22,250
$25,001
$75,000 573 18.79% 51,086 50,229 51,708 50,186 52,104
$75,001
$100,000 327 10.72% 87,696 87,000 87,610 90,802 84,000
$100,001
Contact an experienced REALTOR
Ready to Buy or Sell Real Estate?
$150,000 780 25.58% 126,641 126,456 126,022 129,611 130,914
$150,001
$200,000 525 17.22% 173,082 171,583 171,722 176,200 189,459
$200,001
$275,000 366 12.00% 234,281 231,847 232,705 236,311 235,892
$275,001
and up 368 12.07% 412,792 358,789 391,862 412,058 536,624
Average Closed Price: $159,793 $113,851 $137,658 $239,290 $341,603
Total Closed Units: 3,049 655 1649 673 72
Total Closed Volume: 487,208,038 74.57M 227.00M 161.04M 24.60M
Reports produced and compiled by RE STATS Inc. Information is deemed reliable but not guaranteed. Does not reflect all market activity. pp. 8
Steve Reese 405-848-9944 steve@oklahomarealtors.com
10. Monthly Inventory Analysis
Data from the The Oklahoma Association of
REALTORS®
December 2012
Closed Sales as of Jan 12, 2013
Average Percent of List Price to Selling Price Report Produced on: Jan 15, 2013
Area Delimited by Entire OK State MLS - Single-Family Property Type
DECEMBER YEAR TO DATE (YTD)
2008 2009 2010 2011 2012 2008 2009 2010 2011 2012
96.55% 96.62%
96.38% 96.38%
95.94% 95.90% 96.11%
95.61% 95.49% 95.85%
1 Year 1 Year
+0.68% +0.55%
2 Year 2 Year
+1.10% +0.29%
5 YEAR MARKET ACTIVITY TRENDS 5yr DEC AVG=95.90% 3 MONTHS
Average List/Sell Price
98 High O 96.34%
May 2008 = 97.10% C
Low T
97
Jan 2011 = 95.14% N 96.49%
O
96
Average List/Sell this V 0.15%
month at 96.55%,
above the 5 yr DEC D 96.55%
E
95
Jun 2008 Dec 2008Jun 2009 Dec 2009Jun 2010 Dec 2010Jun 2011 Dec 2011Jun 2012 average of 95.90% C 0.06%
AVERAGE L/S% OF CLOSED SALES & BEDROOMS DISTRIBUTION BY PRICE
Distribution of $avgmed L/S % by Price Range % AVL/S% 2 Beds 3 Beds 4 Beds 5 Beds+
$25,000
and less 110 3.61% 91.53% 91.66% 89.51% 90.52%134.18%
$25,001
$75,000 573 18.79% 94.55% 94.74% 94.87% 90.19% 93.32%
$75,001
$100,000 327 10.72% 95.97% 95.68% 96.59% 92.64% 96.80%
$100,001
Contact an experienced REALTOR
Ready to Buy or Sell Real Estate?
$150,000 780 25.58% 97.35% 97.41% 97.53% 96.89% 84.66%
$150,001
$200,000 525 17.22% 97.80% 96.72% 97.87% 98.20% 98.06%
$200,001
$275,000 366 12.00% 97.50% 97.86% 97.36% 97.37% 99.19%
$275,001
and up 368 12.07% 97.24% 96.67% 97.33% 97.65% 95.36%
Average List/Sell Ratio: 96.50% 95.71% 96.73% 96.89% 96.71%
Total Closed Units: 3,049 655 1649 673 72
Total Closed Volume: 487,208,038 74.57M 227.00M 161.04M 24.60M
Reports produced and compiled by RE STATS Inc. Information is deemed reliable but not guaranteed. Does not reflect all market activity. pp. 9
Steve Reese 405-848-9944 steve@oklahomarealtors.com
11. Monthly Inventory Analysis
Data from the The Oklahoma Association of
REALTORS®
December 2012
Inventory as of Jan 12, 2013
Market Summary Report Produced on: Jan 15, 2013
Area Delimited by Entire OK State MLS - Single-Family Property Type
Inventory Inventory Market Activity Market Activity
New Listings Closed Sales
3,687 = 14.49% 3,049 = 10.70%
Start Inventory Pending Sales
21,763 2,627 = 9.22%
Total Inventory
Other Off Market
Units 2,772 = 9.73%
25,450
Volume Active Inventory
$4,865,305,054 20,044 = 70.35%
Absorption: Last 12 months, an Average of 3,397 Sales/Month DECEMBER Year To Date
Active Inventory as of December 31, 2012 = 20,044 2011 2012 +/-% 2011 2012 +/-%
Closed Sales 2,900 3,049 5.14% 35,593 40,765 14.53%
Pending Sales 2,221 2,627 18.28% 35,988 41,894 16.41%
New Listings 3,755 3,687 -1.81% 68,839 70,583 2.53%
Average List Price 154,312 165,427 7.20% 154,332 166,007 7.56%
Average Sale Price 148,418 159,793 7.66% 148,251 160,385 8.18%
Average Percent of List Price to Selling Price 95.90% 96.55% 0.68% 95.85% 96.38% 0.55%
Average Days on Market to Sale 90.74 81.96 -9.68% 88.84 83.61 -5.88%
Monthly Inventory 23,315 20,044 -14.03% 23,315 20,044 -14.03%
Months Supply of Inventory 7.86 5.90 -24.94% 7.86 5.90 -24.94%
2011 2011
DECEMBER MARKET 2012 AVERAGE PRICES 2012
New Listings Pending Listings List Price Sale Price
3,755 3,687 165,427
159,793
2,627 154,312
2,221 148,418
-1.81% +18.28% +7.20% +7.66%
2011 2011
INVENTORY 2012 AVERAGE L/S% & DOM 2012
Active Inventory Monthly Supply of Inventory % of List to Sale Price Days on Market to Sale
23,315 7.86 96.55% 90.74
20,044 5.90 95.90% 81.96
-14.03% -24.94% +0.68% -9.68%
Reports produced and compiled by RE STATS Inc. Information is deemed reliable but not guaranteed. Does not reflect all market activity. pp. 10
Steve Reese 405-848-9944 steve@oklahomarealtors.com