Modeling Disease in Pacific Salmon
•Download as PPT, PDF•
0 likes•415 views

This document summarizes a study modeling the effects of climate change on disease in Pacific salmon. The study will link several models: 1) a degree-day model of the parasite Ceratomyxa shasta's life cycle, 2) the USGS Basin Characterization Model of the Klamath River, 3) a hydraulic model of the invertebrate host's habitat, and 4) an epidemiological model. The linked models will predict how climate change may alter disease severity and distribution. Outcomes include identifying habitats for protection and a model to predict changes in C. shasta and other diseases. The study aims to inform management of healthy fisheries under climate change.

Recommended
More Related Content
Similar to Modeling Disease in Pacific Salmon
Similar to Modeling Disease in Pacific Salmon (20)
More from Oregon Sea Grant
More from Oregon Sea Grant (20)
Recently uploaded
Recently uploaded (20)
Modeling Disease in Pacific Salmon
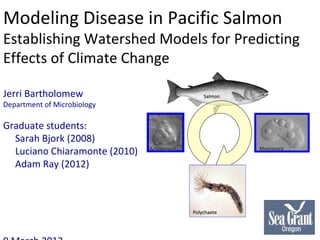
- 1. Modeling Disease in Pacific Salmon Establishing Watershed Models for Predicting Effects of Climate Change Jerri Bartholomew Salmon Department of Microbiology Graduate students: Sarah Bjork (2008) Luciano Chiaramonte (2010) Actinospore Myxospore Adam Ray (2012) Polychaete
- 2. Problem: Projected increasing temperatures for rivers where salmon populations are already threatened
- 3. Increasing temperature and altered ecosystem processes will have multiple effects on host-parasite dynamics Increased parasite replication Increased stress - causing reduced disease thresholds Salmon host Altered longevity Ceratomyxa of parasite stages shasta life cycle Myxospore Actinospore Altered timing of parasite release Changes in population Polychaete host dynamics
- 4. These changes will have profound effects on the outcome of infections by a variety of pathogens Outcomes Changes in Changes in Changes in disease severity seasonal cycles pathogen range Layered on this is the altered effectiveness of management strategies as the 4 amount of cold, fresh water becomes limited.
- 5. This study will link models to assess the interaction of disease and climate change effects on wild salmon Degree-day model of the Basin Characterization parasite life cycle Model for the Klamath River (USGS) Hydraulic model for the invertebrate host habitat (USFWS collaboration) 5 Epidemiological model
- 6. This study will link models to assess the interaction of disease and climate change effects on wild salmon Outcome: Degree-day model of the Predict changes in Basin Characterization parasite life cycle disease severity and Model for the Klamath distribution under River (USGS) different climatic scenarios Hydraulic model for the invertebrate host habitat (USFWS collaboration) 6 Epidemiological model
- 7. The watersheds selected for this study have different characteristics and predictions for climate effects differ – C. shasta is present in both Klamath River • Warmer water temperatures • Altered timing and magnitude of flow events • Increase in runoff and sedimentation Willamette River • Changes may not be as dramatic or extreme as predicted for the Klamath • larger discharge volume and the cooler profile • more of its basin is above 2500 m, buffering system from change
- 8. Outcomes directed toward management for healthy fisheries Identification of critical habitats for protection – “disease refugia” A model that can be used to predict changes in disease severity and distribution of Ceratomyxa shasta - other host-pathogen systems
- 9. Educational Tools: Produced in collaboration with Educational Solutions Documentary video Online high school curriculum http://www.educationalsolutions.org/introduction.html
- 10. In summary, linking these models will allow us predict how climate change will alter disease in salmon USGS model Measured Runoff Baseflow Discharge 1.4E+09 1.2E+09 1.0E+09 8.0E+08 6.0E+08 m D 4.0E+08 B 3 e g h n a y c s r / , i 2.0E+08 Basin 0.0E+00 2 4 9 1 6 4 9 1 0 5 9 1 4 5 9 1 8 5 9 1 2 6 9 1 6 9 1 0 7 9 1 4 7 9 1 8 7 9 1 2 8 9 1 6 8 9 1 0 9 1 4 9 1 8 9 1 0 2 6 0 2 Climate Models Characterization Model Degree Hydraulic Day Model Model Epidemiological Luciano Chiaramonte, MS thesis Model Ro & Disease Trends 10 Adam Ray, PhD thesis Questions?
Editor's Notes
- This slide template is for the title slide of a presentation. Consider repeating a key image from one of the slides later in the presentation. The image helps orient the audience to the key words in the title. This image also gives you the opportunity to say a few things about your work — perhaps addressing the work ’s importance or providing key background information. Forcing yourself to spend more time with this slide is good because a common mistake in presentations is not to leave the title slide on long enough. Because of this mistake, many in the audience do not have the chance to comprehend the key details of the title. See pages 66, 69-71, and 177 of The Craft of Scientific Presentations ( CSP ). This template shows one layout for the slide. You might want to rearrange the placement of the body ’s wording to accommodate a different sized image.
- Body slide from the first section of the presentation ’s middle. Consider having the first-topic image from the mapping slide repeated here. Use the headline (no more than two lines) to make an assertion about this topic. In the body of the slide, support that headline with images and with words, if necessary. See CSP , pages 116-117 and 147-151. This slide shows one orientation for the image and text in the body of the slide. Other orientations appear in this template. Choose the one that best supports your headline assertion. Some institutions will insist that you place an institutional logo on each slide. Other institutions recommend a logo on the first slide and the last. If you do place a logo on each slide, make sure that logo is at the bottom of the slide rather than the top. Placing the logo at the top (the place on a slide that receives the most emphasis) shifts the emphasis away from the work and to the people or place doing the work.
- Mapping slide for the presentation (note that a background slide or a slide justifying the importance might precede this slide). A common mistake with mapping slides is to give the audience simply a boring and unmemorable vertical list of topics (including the names “Introduction” and “Conclusion” and “Questions”). Such a list is quickly forgotten after the slide is removed. On a mapping slide, take the opportunity to show a key image or perhaps a representative image for each major section of the presentation. In the second case, each image would be repeated on the first visual of the corresponding section and would remind the audience that they have arrived to a major section of the presentation ’s middle. In regards to the names “Introduction” and “Conclusion,” every talk has those sections, and the names are ignored by audiences. So why state them? Also, for the divisions that you do have, find a logical and parallel grouping. Note that groups of two’s, three’s, and four’s are much easier to remember and are not so nearly intimidating as groups of five’s, six’s, and seven’s. See the example mapping slide in the textbook. (CSP, pages 55-56, 74-75, 86, 143, 147, and 148)
- Mapping slide for the presentation (note that a background slide or a slide justifying the importance might precede this slide). A common mistake with mapping slides is to give the audience simply a boring and unmemorable vertical list of topics (including the names “Introduction” and “Conclusion” and “Questions”). Such a list is quickly forgotten after the slide is removed. On a mapping slide, take the opportunity to show a key image or perhaps a representative image for each major section of the presentation. In the second case, each image would be repeated on the first visual of the corresponding section and would remind the audience that they have arrived to a major section of the presentation ’s middle. In regards to the names “Introduction” and “Conclusion,” every talk has those sections, and the names are ignored by audiences. So why state them? Also, for the divisions that you do have, find a logical and parallel grouping. Note that groups of two’s, three’s, and four’s are much easier to remember and are not so nearly intimidating as groups of five’s, six’s, and seven’s. See the example mapping slide in the textbook. (CSP, pages 55-56, 74-75, 86, 143, 147, and 148)
- Sample conclusion slide. Use the headline (no more than two lines) to state your most important conclusion. Begin the headline with In summary or In conclusion to ensure that the audience knows they have come to the presentation ’s end. Support that headline with an image and with words, if necessary. This slide should be your last slide. Audiences lose patience when they believe that they have come to the end, but other slides follow. Notice that the word Questions animates in at the bottom of this slide. That strategy is much more effective than burning a slide with just the word Questions . This slide allows the audience to look at the most important slide of the presentation during the question period. See CSP, pages 65, 150, 151-152. Notice how the presenter showed the connection between words blocks on this slide—a strategy that is much more effective than a bullet list, which hides the connections between details. Reference: Manning Seltzer, “Failure Analysis of the Ice Detector in the Austria 13 Helicopter,” presentation (Hartford, CT: Sikorsky Helicopter, 30 April 2004).