SlideShare a Scribd company logo
1 of 23
Download to read offline
UNDERSTANDING THE DECLINE OF GLOBAL OIL EXPORTS
Patrick Brocorens
Laboratory for chemistry of novel materials, UMONS, Belgium
e-mail: patrick.brocorens@umons.ac.be
phone: + 32 (0)65373867

Patrick Brocorens got its PhD in chemistry in 2002 and used for years modeling tools
to predict properties of hydrocarbon-based molecules. In 2007, he launched the
Belgian section of the Association for the Study of Peak Oil and gas (ASPO), and now
uses its expertise in modeling to predict oil production evolution.
This paper has been published in the Recueil du premier congrès interdisciplinaire du
développement durable, Thème 1 : Biens communs mondiaux, Service public de
Wallonie, Namur, 2013

Abstract
In this study, we use indicators such as the exports-to-production ratio, and the
difference between the growth rate of oil exports and the growth rate of oil
production, to characterize the dynamics that lead to a decline of oil exports. Many
countries have passed their peak of oil exports, and the world as well, in 2005. The
indicators presented here show that the deterioration of the fundamentals is a long
term dynamics, thus meaning that global oil export will likely continue declining,
though temporary rebounds can occur. These evolutions are then related to recent
events such as the Arab Spring, the rise of oil prices on international markets, and
the current economic crises. The peaking of world oil exports is a recent and
significant turning point, though still largely ignored, but its implications for both oil-
importing and oil-exporting countries are vast.
Introduction
For the last few years, there has been a lot of discussion to know whether world oil
production can still grow in the future, or is reaching a maximum that is the prelude
to a long decline of the oil flow that irrigates the world economy. Though this debate
about peak oil is still far from reaching its own peak, a more immediate concern far
less discussed is the peaking and decline of oil exports. A production decline is
indeed not mandatory for a decline of oil exports to happen. Oil exports peak when
an oil producing country has a domestic consumption that rises faster than its
production does. Such dynamics have to be studied carefully as declining oil exports
are critical both for nations that depend on others for filling their oil thirst, and for oil
exporting countries that see their oil-based earnings evaporating.
A few authors studied the dynamics of oil exports. Jeffrey Brown built an “export
land model” that shows and explains that the decline of oil exports tends to
accelerate with time (Brown, Foucher, 2010). Mitchell and Stevens (2008) built
predictions of future oil exports for several countries and analyzed the consequences
for the economies and policies of these countries.
In this study, we show that two indicators, the exports-to-production ratio, and the
difference ∆ between the growth rate of oil exports (rexp) and the growth rate of oil
production (rprod), can complement these earlier prospective methods. Using these
tools, we analyze the dynamics of oil exports at country and world level, examine the
consequences of these evolutions, and suggest measures to deal with these
consequences.
Oil production and oil consumption on a collision course
For an oil-producing country to export oil, it must produce more oil than it consumes.
The evolution of oil exports is thus the combination of two trends: the evolution of
production and the evolution of consumption.
In any country, the historical evolution of oil extraction follows a typical pattern. It
begins by the discovery of a few fields and the successful production of the first
barrels, which attract more prospections and kick off a dynamic of oil discoveries and
development that feeds on past successes and expectations of new successes. The
potential of the region is full and oil production grows exponentially. Later, as the
industry matures, the new oil fields are more difficult to find and to exploit, they tend
to be smaller, while more and more ageing fields enter into decline. The growth of oil
production slows down. Eventually, when the pace of development of new fields is
unable to compensate the loss of ageing fields despite ongoing investments, growth
stops, the production of the whole country reaches a maximum and then enters into
decline. The historical production maximum is called peak oil. Often, some
technological, economic or political effects rejuvenate the production, and several
peaks or a plateau occur before the terminal decline sets in. However, in the long
term, the general pattern of oil production looks like a succession of three phases:
growth, stabilization, and terminal decline, as schematically represented in Figure 1
for an hypothetical country exploiting oil for more than 200 years.
As for oil consumption in oil exporting countries, it tends to increase with time, due
to economic growth and fuel prices that are often lower than international
standards. In the hypothetical country of Figure 1 (left), oil consumption is assumed
to rise at a constant rate. Export is the share of production above the consumption
curve. This country thus evolves from the status of oil importer to oil exporter, then
to oil importer again. During the time window the country is exporter, oil exports
also get through the three stages of growth, stabilization, and decline, but they
peak and decline before production does (Figure 1, right). The export-to-production
ratio, i.e. the share of production that is exported, follows a similar pattern, but
peaks before both exports and production do (Figure 1, right).
Figure 1, left: Evolution of oil production and oil consumption in a model country.
Right: Evolution of oil production, oil exports, and the export-to-production ratio in
the same model countrya
. The dotted lines indicate the onset of the decline of these
three parameters. The graphic has been divided in phase I (simultaneous growth of
the three parameters), phase II (successive decline of the three parameters), and
phase III (simultaneous decline of the three parameters).
a: Production and exports are relative to the production at the peak date. They are expressed in
terms of percentage, as well as the export-to-production ratio.
In Figure 1, right, we have distinguished three phases: phase I (simultaneous
growth of production, exports, and the export-to-production ratio), phase II
(successive decline of the three parameters), and phase III (simultaneous decline
of the three parameters). In phases I and III, the rate of variation of exports is
larger than it is for production: in phase I, exports represent a growing share of
production (Figure 1, right), which itself is growing, and in phase III, exports
represent a declining share of production, which itself is declining. The two
compounded effects imply that in these phases, significant growth or decline of oil
exports can occur in a relatively short period of time, sometimes in a few years.
Phase I lasts as long as the growth rate of production is above that of consumption.
But with time, the growth rate of production always slows down, and when it has
slowed down enough to match the growth rate of consumption, the export-to-
production ratio peaks – exports then grow at the same pace as consumption and
production – and phase II starts. In phase II, the growth rate of production slows
down further and drops below that of consumption, and the export-to-production
25 50 75 100 125 150
Oilvolumes(a.u.)
Time (years)
0
20
40
60
80
100
25 50 75 100 125 150
Relativescale
Time (years)
II IIII
ratio starts declining. Exports, however, can continue growing for a while because
the growth rate of production, though smaller than that of consumption, generally
applies to a larger volume. Hence, the increment of production is still above the
increment of consumption. But eventually, the increment of consumption becomes
equal to the increment of production, and then becomes larger, and exports in turn
reach their peak and start declining. This is especially true when production is
plateauing, i.e. when no increment of production is observed at all. Finally,
production starts declining and phase III starts. The decline of exports accelerates.
In a ‘business as usual’ trajectory, the export-to-production ratio, oil exports, and oil
production peak and enter into decline sequentially. No one is affirming this pattern
should always occur as strictly as described. Production can rebound and
consumption pattern can change. It is imaginable that a peaking country implement
new policies that decrease domestic consumption fast enough to offset any
production decline, thus raising exports in the face of a declining production. If
history is any guide, these measures are, however, politically challenging, at least in
the magnitude required to produce significant effects on the level of exports. Thus,
in the absence of such events, the ‘business as usual’ scenario prevails. This means
that passing one of these peaks is a warning for the next two peaks, and signals the
urgency for additional studies and adaptation of policies for both oil-exporting and
oil-importing countries, especially that many changes of energy policies require much
time, sometimes decades, to produce significant effects.
Two case figures: Vietnam and Indonesia
Two real countries are analyzed to validate the model: Vietnam and Indonesia.
Consumption data were subtracted from production data to obtain net export
values; unless specified otherwise, the EIA database has been used for all countries
that will follow in this study.
For Vietnam, the export-to-production ratio plateaued in 1992, immediately after
the country has become oil exporter (Figure 2). Although the production was
growing at a strong pace of 12% per year, oil consumption was also growing at
that pace, thus making stagnant the export-to-production ratio. This plateau lasted
more than 10 years, and was low. Only 40% of the production was exported,
meaning that exports were highly susceptible to a reversal of fortune in oil
production. The rise of exports stopped in 2001, three years before production did.
Exports then plummeted and disappeared in 10 years, while production declined by
a mere 19% since their peak.
Vietnam is an example where the production downturn was sharp. Indonesia, on
the contrary, maintained a long production plateau (1974-2000). During that
period, the evolution of exports was thus entirely dominated by the evolution of
consumption, which was growing at an average pace of 7% per year (BP, 2012),
meaning a doubling of consumption every 10 years. As a result, exports had
already halved when production finally started its decline in 2000, an event that
accelerated the demise of exports. About 40% of the production was still exported
in 1999, but five years later Indonesia had become a net oil importer (Figure 2). In
January 2009, the country suspended its membership to the Organization of the
Petroleum Exporting Countries (OPEC), to which it belonged since 1962.
Figure 2, left: Evolution of oil production and oil consumption in Vietnam and
Indonesia. Right: Evolution of oil production, oil exports, and the export-to-
production ratio in Vietnam and Indonesiaa
. Phases I to III have been represented.
Vietnam
Indonesia
a: Production and exports are relative to the production at the peak date. They are expressed in
terms of percentage, as well as the export-to-production ratio.
The declining performance of exports with respect to production
To better evaluate how exports perform with respect to production, the difference ∆
between the growth rate of exports (rexp) and the growth rate of production (rprod)
has been calculated. A positive ∆ means that the rate of change of exports is some
percentage points higher (equal to ∆) than that of production. Thus, if production
increases, exports increase at a faster pace, and if production decreases, exports
decrease more slowly or even continue growing. A negative ∆ means that exports
evolve more poorly than production. In a worst case scenario, production rises, but
exports decline.
Initially, when a country becomes exporter, the difference between both rates is
positive and huge (Figure 3), but it rapidly slows down because when exports grow
faster than production, the export-to-production ratio increases, and that ratio
cannot go beyond 100%. In reality, its maximum is always lower than 100%
0
0.1
0.2
0.3
0.4
1980 1985 1990 1995 2000 2005 2010
Production(Mb/d)
Year
0
20
40
60
80
100
1980 1990 2000 2010Relatvescale
Year
0
0.3
0.6
0.9
1.2
1.5
1.8
1980 1985 1990 1995 2000 2005 2010
Production(Mb/d)
Year
0
20
40
60
80
100
1980 1990 2000 2010
Relatvescale
Year
Indonesia
leaves OPEC
I II III
II III
Production
Production
because all countries consume oil. When the exports-to-production ratio peaks
(Figure 3), exports evolve like production, meaning that ∆ is zero. Then, ∆ turns
negative, and the decline accelerates with time, especially in phase III.
The evolution of ∆ has a very characteristic shape, which illustrates well that oil
exports get through the phases of precipitous rise, slow erosion, and then
accelerating decline (Figure 3). Indonesia, for instance, was characterized by a long
period where the export growth rate performed a few percentage points below the
production growth rate, then leaped over the cliff in the last six years of existence
of the country as an oil exporter.
Figure 3: Evolution of the export-to-production ratio, and of the difference
between the export growth rate (rexp) and the production growth rate (rprod), for the
hypothetical country of Figure 1, for Vietnam, and for Indonesia. Phases I to III
have been represented.
World oil exports in decline
World oil exports peaked in 2005 and since then have declined by 5.3% (2011,
Figure 4).
This is not the first time in history that oil exports have suffered a sustained decline.
During the 1970s, two oil-shocks rocked the occidental societies. Deep recessions
and important policy changes occured simultaneously in oil-importing countries,
which quickly reduced oil consumption in the early 1980s. This was the counter-oil
shock. With the slump of demand, world production, world exports, and oil prices all
collapsed simultaneously, and hammered strongly the economies of oil exporting
nations. The decline bottomed up in 1985. Then two decades of recovery followed,
punctuated by temporary drops associated to economic crises. The recovery was a
reality for oil production and exports, but not for the oil price, as excess capacity
ensured that the market was well supplied, even in the context of sensitive
geopolitical events.
The crisis of 1990-1991 provides a very good overview of oil excess capacity existing
at that time, as two political events could have produced more dire consequences on
the oil markets if that excess capacity had not been there. The first event is the
-50
-25
0
25
50
rexp-rprod(%)
Time (years)
-100
-80
-60
-40
-20
0
20
40
60
80
100
rexp-rprod(%)
Time (Years)
-100
-80
-60
-40
-20
0rexp-rprod(%)
Time (Years)
Vietnam (1992-2011) Indonesia (1981-2004)
I II III II III IIIIII
breakup of the Soviet Union, which led to a precipitous decline of the country’s oil
production: -35% in only four years. A drop of such amplitude could have wiped out
completely the exports of the second world exporter in the world. And indeed, in
1991, the exports had already collapsed by a whopping 32%. However, this drop
was temporary and exports have quickly rebounded in the following years because
consumption was declining still more precipitously than production, by 42% in four
years. While the Soviet Union was collapsing and splitting into new countries, Iraq
invaded Kuwait. In January 17 1991, Operation Desert Storm was launched. Both the
Iraqi and Kuwaiti oil productions were halted, but that very day, the price of the
West Texas Intermediate lost one third of its value, and finished at 21$/b, i.e. a level
typical of the 1980s and 1990s.
Figure 4: Evolution of world oil exports, distributed between oil-exporting
countries, and of the oil price ($2011, West Texas Intermediate spot price) since
1986. Economic crises are shown, with those of 1991 and 2008 related to an oil
shock.
We may wonder why it is possible that the oil price has settled at such lows, given
that the oil markets were simultaneously suffering two blows that have wiped out the
equivalent of 12% of world exports. It is clear that the markets were confident that a
successful resolution of the conflict with Iraq would happen soon, and that the
release of the IEA strategic oil reserves helped significantly. But a sufficient excess
capacity to dampen such events was likely the most critical factor. The loss of Iraqi
and Kuwaiti oil exports and the breakup of the Soviet Union are clearly seen in Figure
4 (most of the USSR contribution, in orange until 1991, is displayed as Russian in the
following years, in blue). Despite these events, world exports did not suffer much
because Saudi Arabia, Norway, United Arab Emirates (UAE) and others, were able to
quickly increase their production to compensate. The ∆ of the rescuing countries was
Exports(Mb/d)
Oilprice,WTI($/b)
positive, and exports increased in higher proportions than production did. In total,
world exports only dropped by 2%, and this drop has probably something to do more
with the economic recession that followed the shock of the invasion of Kuwait in
1990, than with a real lack of oil on international markets, as the low oil prices of
1991 suggest.
Since the 1990s, world excess capacity has shrink, and the persistent decline of
world exports observed since 2006 is different than the decline of the early 1980s. It
started in a context of slowly rising oil prices in the face of a stagnant production.
Due to the slow-motion energy crisis and the absence of any strong geopolitical
events (at least until the Arab revolutions started at the end of 2010), no particular
emergency response of the society to reduce the oil habit has been engaged in oil-
importing nations. Hence, the decline of exports is not due to a lack of demand in oil-
importing countries (though it eventually leads to demand destruction via increases
of oil prices); it is instead driven by a strong demand in oil-exporting countries.
World oil production and auto-consumption are displayed in Figure 5. Auto-
consumption is consumption by oil producers of oil that they themselves produce.
Auto-consumption is significant, now representing 50% of world production. The
export-to-production ratio is thus also 50%. Since the bottom of the exports slump in
1985s, the export-to-production ratio increased from 40% to a maximum of about
55% at the end of the 1990s. In these years, world exports thus expanded faster
than world production did. Then, the export-to-production ratio plateaued for about
10 years and started a slow decline in 2006. Since then, exports are evolving more
poorly than production, and because production is almost flat, exports are also
declining since 2006.
Figure 5, left: Evolution of world oil production and auto-consumption of oil
producers. Note the drop of consumption associated to the breakup of Soviet Union
in 1991. Right: Evolution of oil production, oil exports, and the export-to-
production ratio for the worlda
. Phases I and II have been represented.
a: Production and exports are relative to the production at the peak date. They are expressed in
terms of percentage, as well as the export-to-production ratio.
0
20
40
60
80
100
1980 1990 2000 2010
Oilvolumes(Mb/d)
Time (years)
0
20
40
60
80
100
1980 1990 2000 2010
Relativescale
Time (Year)
III
Production
The performance of exports with respect to production since the end of the counter
oil-shock is better appreciated by following the evolution of ∆ (Figure 6). A clear
trend is visible, punctuated by strong fluctuations related to changes in the
fundamentals of the economy. Exports perform poorly with respect to production
when the world economic environment is weak, as demand weakens in oil-importing
countries. These drops of ∆ are associated with declines in oil prices on international
markets, as seen after the crises of 1991, 1998, 2001, and 2008. Such dynamics
were also present during the counter oil-shock of the early 1980s, but at that time, ∆
dropped deeply several years in a raw, while later the drops were temporary and
shallow. When the economy recovered, ∆ rebounded. In 1992, the rebound was
especially strong, likely helped by the return of Kuwait on international markets.
Despite these ups and downs, for almost 30 years ∆ has followed a trend as
described by the theoretical model, slowly eroding from positive to negative territory.
The crossing has spanned several years, with ∆ going back and forth below and
above zero between the end of the 1990s and 2006 (this period corresponds to the
plateau of the export-to-production ratio). These results suggest that the
deterioration of the fundamentals is a long term dynamics, and that the world is
already in phase II. A good correspondence between the model and what is
observed is particularly worrisome, as the model expects that the fall of ∆, and of oil
exports in fine, accelerates with time if no drastic adjustments of energy policies
occur in oil exporting countries.
Figure 6: Evolution of the difference ∆ between the growth rate of oil exports (rexp)
and the growth rate of oil production (rprod) for the world. Evolution of the oil price
($2011, West Texas Intermediate spot price). Economic crises are shown, with those
of 1991 and 2008 related to an oil shock.
Oilprice(2011$)
Differencebetweenthegrowthrateofoilexports
andthegrowthrateofoilproduction(%)
10
30
50
70
90
110
130
150
1986 1991 1996 2001 2006 2011
-6
-4
-2
0
2
4
6
8
10
Apparently no rescue from the MENA countries, nor from Russia.
In 2011, the MENA (Middle East and North Africa) countries have contributed to
half the global oil exports, and eight of the twelve OPEC members are from MENA.
Their evolution is thus especially critical for the world. However, all indicators of the
region are deteriorating and performing more poorly than at the world level.
Production is on a plateau since 2005 (Figure 7). The export-to-production ratio is
declining since 1990, i.e. earlier than for the world, and it is now lower than the
minimum reached in 1985. The evolution is not promising, as shown by ∆, which is
more and more in the red. As a result, export started their decline in 2006, and this
decline thus contributes significantly to the decline of global oil exports observed
since 2006. Again, these observations justify concerns about the ability of the
region to fulfill the future oil demand of the world, especially that its role is
expected to grow in the future due to the peaking and decline of oil production in
many non-opec countries.
Figure 7, left: Evolution of oil production and auto-consumption of countries from
Middle East and North Africa (MENA). Right: Evolution of oil production, oil
exports, and the export-to-production ratio for MENA countriesa
. Phases I to III
have been represented. Bottom: Difference ∆ between the export growth rate
(rexp) and the production growth rate (rprod), for MENA countries.
a: Production and exports are relative to the production at the peak date. They are expressed in
terms of percentage, as well as the export-to-production ratio.
0
5
10
15
20
25
30
35
1980 1990 2000 2010
OilVolume(Mb/d)
0
20
40
60
80
100
1980 1990 2000 2010
Relativescale
-4
-3
-2
-1
0
1
2
3
∆∆∆∆(%)
1985 1990 1995 2000 2005 2010
counter
oil shock
III
Production Production
Alongside MENA countries, Russia is a significant oil player, occupying the second
place as an oil exporter, not far behind Saudi Arabia (Figure 4). Russia has also
played a very prominent role in raising global oil exports in the early 2000s. After
the collapse of Soviet Union, both oil production and consumption declined
precipitously, but especially consumption, which dropped by about 45% in six years
(Figure 8). Then, at the end of the 1990s, production recovered quickly, but
consumption was slow to increase. The result was a quick and large increase in
Russian oil exports. Between 1998 and 2004, Russia has increased its exports by
2,9 Mb/d, which represents 65% of the rise of global oil exports observed during
the period. But Russia will not repeat this achievement in the future. Production has
not much room for growth, while consumption does grow (by an average of 2.5%/y
in the last five years). As a result, Russia entered in phase II in 2008, and its
exports are now plateauing. The evolution of ∆ shows the long term deterioration of
the performance of exports with respect to production (Figure 8).
Figure 8: Russia: left: Evolution of oil production and auto-consumption. Right:
Evolution of oil production, oil exports, and the export-to-production ratioa
. Phases I
and II have been represented. Bottom: Difference between the export growth rate
(rexp) and the production growth rate (rprod).
a: Production and exports are relative to the production at the peak date. They are expressed in
terms of percentage, as well as the export-to-production ratio.
0
2
4
6
8
10
12
1992 1996 2000 2004 2008
Production(Mb/d)
Year
0
20
40
60
80
100
1992 1996 2000 2004 2008
Relatvescale
Year
-5
0
5
10
rexp-rprod(%)
Year
I II
1993 1998 2003 2008
2010
Exports
If MENA countries and Russia both continue deteriorating, the evolution of global oil
exports will also likely continue deteriorating. The exportations of several other
exporters are also evolving poorly, and we may wonder to which extent new
exporters such as Chad and Brasil can attenuate the losses observed elsewhere.
What does attenuate those losses, however, is the rejuvenation of oil production in
the US, which implies less import from the biggest oil importer in the world. With
declining global oil exports, someone has to consume less, and economic crises are
another mechanism that decreases oil imports. This effect has been at work in
occidental countries since 2008. It is then a matter of debate whether these
demand destructions are what is required to balance oil exports and imports, some
studies claiming that high oil prices are one of the factors responsible of the crises
that occidental countries suffer since oil prices are in triple digits (Sankey et al.,
2010; Hamilton, 2009a,b).
Economic growth eating up oil export capacities
Vietnam, Indonesia, and the MENA countries powerfully illustrate the effects of
domestic consumption on the level of oil exports. Though these exports are critical
to balance their fiscal and current account budgets, oil-exporting countries have
generally much difficulty to avoid their exports disappearing under the burden of
their own consumption.
One driver of energy consumption is economic growth, and no government is
willing to cool down economic growth. Energy is necessary to any activity, and the
growth rate of GDP, rGDP, can be expressed as a function of the growth rate of the
economic intensity of energy, rEIE, and the growth rate of energy consumption rE:
‫ݎ‬ீ஽௉ =	‫ݎ‬ாூா + ‫ݎ‬ா +	‫ݎ‬ாூா × ‫ݎ‬ா Eq. 1
The “Economic intensity of Energy” is the amount of GDP produced per unit of
energy consumed.
For small rE an rEIE (<10%/y if we deal with annual rates), the last term of Eq.1 can
be neglected, and this approximation leads to the following expression:
‫ݎ‬ீ஽௉	~	‫ݎ‬ாூா + ‫ݎ‬ா Eq. 2
It is rather intuitive that building one more hotel in Dubai, or sending one more sms
from Riyadh to Jeddah is made possible thanks to extra energy consumption. The
value of these goods and services, added to many others, are used to calculate
GDP. Thus, an economy increases its energy consumption as it grows. However,
the efficiency at which an economy uses energy to produce wealth evolves with
time. This can be due to technological and social factors, or because the
contribution of the economic sectors to the economy changes with time. As a result,
the growth rate of the economy is not strictly equal to the growth rate of energy
consumption. Eq. 2 reflects these aspects.
Though the economic efficiency of energy evolves with time, improvements are
generally slow, especially if they are technological, partly because it means
investments, for instance in more efficient energy convertors in factories,
transportation, households, and these investments are costly and are amortized
over years. Hence, in the last 30 years, EIE has grown worldwide by about
1.5%/y1
. The United States beat the average (+2.0%/y)2
, but the MENA countries
evolved in almost inverse proportion to the US (-1.4%/y). This poor performance
(see Figure 9) means that the MENA countries consumed more and more energy to
produce a given amount of GDP. Though most of the deterioration of EIE has
occurred in the 1980s, nowadays there is still no signal that EIE is on track to
improve.
Figure 9: Annual growth rates of economic intensity of energy (rEIE), of primary
energy consumption (rE), and the product of both rates (rEIE x rE), from 1981 to
2009, for the MENA countries and the US. The sum of the three rates is equal to
the annual growth rate of GDP.
1
The EIE growth rates of the world and MENA countries have been calculated using Eq.1, GDP growth rate in
constant prices from IMF, World Economic Outlook, April 2012, and total primary energy consumption data
from EIA.
2
The EIE growth rates of the US have been calculated using Eq.1, GDP in constant prices from the US bureau of
Economic Analysis, and total primary energy consumption data from EIA.
-10
-5
0
5
10
15
Annualgrowthrate(%/y)
rEIE
rE
rEIE x rE
1985 1990 1995 2000 2005
United States
-10
-5
0
5
10
15
Annualgrowthrate(%/y)
rEIE
rE
rEIE x rE
MENA countries
1985 1990 1995 2000 2005
Due to a deteriorating EIE, in the last 30 years, energy consumption of MENA
countries grew faster (5.1%/y) than the economy (3.3%/y). Most of this energy is
oil and gas (Figure 10), oil growing at a slower pace (4.1%/y) than natural gas
(7.2%/y) (EIA, 2012). Nowadays, such high rates are still prevailing, and if left
unchanged – the IMF forecasts average economic growth of about 4%/y in the next
five years (IMF, 2012), it means that oil consumption of MENA countries will double
in only 18 years. Because less than two doubling of oil consumption would totally
consume oil production from the region, leaving no exports, the amplitude of the
challenge facing both oil-exporting and oil-importing countries is huge.
Figure 10: Annual growth rates of oil and gas consumption in Middle East and
North Africa countries.
It is striking that the high oil prices environment that built up since 2004 did not
slowed down the growth rate of oil consumption in MENA countries. On the
contrary, it accelerated it (4.3%/y on average, against 3.3%/y in the 1990s3
). This
is likely because the massive inflow of petrodollars stimulates other energy
intensive sectors of the economy, such as construction and petrochemistry, and
encourages lifestyles that are more energy intensive, based on air-conditioning and
the acquisition of cars, in markets where car ownership has significant margins for
growth. The second reason behind the boom of oil consumption in an environment
of triple digit oil prices on international markets, is that the consumers have no
incentive to cut back on consumption; they are rather immune to high oil prices
because in their country, fuels are generally sold well below international standards
(Figure 11) (The World Bank, 2012). In Iran for instance, gasoline costs less than
25$/b while it is almost 300$/b in the euro area.
3
Averages based on EIA total petroleum consumption data from 2004 to 2009, and from 1989 to 1999.
-10
-5
0
5
10
15
20
25
Annualgrowthrate(%/y)
natural gas
oil
Figure 11: Average 2010 price of gasoline (in $ per barrela
) in some oil exporting
countries (black), in some oil producing countries that have switched from the
status of oil exporter to oil importer or will do so in the next five years (black and
white), and in the US and the euro area (light color).
a: The price of gasoline is expressed in $ per barrel, to compare to the international oil price
Flows of petrodollars and cheap domestic gas thus contribute to create a feedback
mechanism leading to growing oil consumption in oil exporting countries and higher
prices on international oil markets:
Oil consumption encouraged by cheap fuel
As long as an oil-exporting country is self-sufficient to fill its tanks, fuel prices can
be maintained by the government well below international standards. This policy is
often regarded as a policy of fuel subsidy, though the basis to calculate the size of
the subsidy is subject to debate. International bodies such as the IEA and the World
Bank use the difference between fuel prices on international markets and domestic
fuel prices. OPEC, however, considers that the reference price should be the
domestic cost of oil production, not the international price (Fattouh, El-Katiri, 2012).
From this point of view, if a national oil company extracts, refines, and sells oil
0
50
100
150
200
250
300
Priceofgasoline($/b,2010)
Price increase on
international oil markets
Higher earnings for oil
exporting countries
Higher economic growth
Higher oil consumption
Less oil exports
below international prices, but above its cost, the company is still profitable, and
such policy does not have to be considered as a subsidy. Only an opportunity to
earn more is lost.
This is true as long as the country is self-sufficient. Once it has to import fuel from
international markets, the lost opportunity becomes a real loss and a policy of
cheap fuel becomes unsustainable for the government budget.
This is clearly what forced the Indonesian government to engage in reforms to
gradually increase fuel prices towards international standards when it was realized
that the country was losing its exports. However, it was (and still is) a long
struggle, as such reforms have to be carefully crafted and explained to be
successful. Many reforms faced public resistance and were rolled back several
times, even though they have been accompanied by compensation programs to
reduce the impact on low-income households. An OECD report lists policy changes
to domestic energy prices since 1998. But it is mainly after the country has become
oil importer that large changes occurred. In 2005, fuel subsidies were eliminated for
large industrial consumers, the price of diesel more than doubled, and that of
kerosene, used for cooking by many poor households, nearly tripled. In 2008, the
government announced a plan to remove subsidies for all vehicles excluding
motorcycles and public transportation vehicles by 2014, and increased gasoline and
diesel prices by 29% in May 2008, and LPG prices by 23% in July. In December,
however, the government erased part of the hike on gasoline and diesel due to the
drop of international oil prices. These measures are examples of measures that
were passed in the last ten years. As a result, the gasoline price is today on a par
with that in the United States (Figure 11). The adjustments are still ongoing and
the results on domestic consumption, though visible (Figure 2), are clearly
insufficient and unable to restore Indonesia in its former status of oil exporter. Up
to now, these measures only slowed down the growth of oil consumption; oil
consumption declined in the two years following the 2005 adjustment, but then
rebounded, and exceeded the 2005 level in 2008.
Focus on Saudi Arabia
Saudi Arabia is the first oil exporter in the world, and is still regarded by many as
the only country remaining as a swing producer able to dampen geopolitical shocks
and to maintain some oil price stability. However, the degradation of the
parameters of the MENA countries reflects in large part the degradation of the
Saudi parameters. With a population growing rapidly, and high unemployment,
economic growth is mandatory, but this, in turn, fuels energy consumption. The
current energy consumption of Saudi Arabia is growing at twice the rate of GDP
growth, meaning that the EIE of the country is deteriorating. Even the non-oil
sector GDP, less affected by the price of oil on international markets than total GDP,
does not perform well either (Lahn, Stevens 2011).
Energy used in the country is mainly oil and gas, both domestic energies cheap to
produce. Cheap prices provide strong incentives for both domestic and international
petrochemical industries to develop in Saudi Arabia, with nowadays about 17% of
the total oil and gas consumption used as industrial feedstock. Water desalination
also requires much energy, and this sector is projected to grow in the future. But
electricity producers are on top of the heaviest consumers, with the result that the
entire domestic production of natural gas is consumed locally. And due to the
reluctance of the country to import additional quantities of natural gas, shortages
have appeared in the last decades, especially upon peak power demands in the
summer month, for air-conditioning. Natural gas shortages prompted some
substitution from gas to oil to feed petrochemical and power plants, thus reversing a
four decades decline in the share of oil in the mix of primary energy consumption.
The Saudi authorities are aware that this strong growth of electricity demand is
threatening their hydrocarbon-based economy, and they have plans to produce
electricity using nuclear energy, concentrated solar energy, photovoltaic, and wind
power. But the scale of the task (more than doubling the current power production
by 2030) and international political hurdle to massively deploy nuclear power in Saudi
Arabia does not bode well for the future of oil exports (Lahn, Stevens 2011).
According to a study from Chatham House, on a “business as usual” trajectory, even
if Saudi Arabia is able to sustain a production above 12 Mb/d, the country would
become a net oil importer by 2038, and due to its high dependence on oil revenue,
its economy would collapse before that point, with deficits appearing in its fiscal and
current accounts as early as 2023 (Lahn, Stevens 2011). The state of these accounts
not only depends on volume exported, but also on the price of oil on international
markets. And with budgetary needs that increase with time, the price that Saudi
Arabia considers fair tends to rise over time: it was $35/b in 2004-05, $70-80/b in
2010-11, and now, the Institute of International finance estimates that oil has to be
above $88/b to maintain the 2011 budget in positive territory (Lahn, Stevens 2011).
This increase is in large part due to the vast sum of money that the government
injected to appease the population during the Arab Spring, about $37bn, which
correspond to add $14/b on the price of oil exports for 2010. Much of this extra
spending is permanent, for instance in the form of pay raises for the state
employees.
But before Saudi Arabia becomes oil importer – but from where could it import oil?
– we have to contemplate the long decline of its exports. The oil exports of Saudi
Arabia have already declined by 8.5% between 2005 to 2011, while production
increased by 0.5%. Chatham House estimates that current consumption trends
could deprive the world market of up to 2 mb/d by 2020 compared with the IEA’s
supply scenario (Lahn, Stevens 2011). In 2010, Khalid A. Al-Falih, President of the
national oil company, Saudi Aramco, said that an additional 1 mb/d of crude export
capacity would disappear by 2028 if the evolution of the domestic energy
consumption does not change. Exports would then drop below 7 mb/d. This
represents a drop of 16% with respect to the 2011 export level, but this also means
that more than the entire production growth that is expected in the future will be
used for domestic consumption. With these developments, if Saudi Arabia is urged
to maintain exports as high as possible to supply the markets, the country could be
forced to run at full capacity in the very near future. The disappearance of its
excess capacity will undoubtedly translate in more volatile oil prices.
Countries of the Arab spring: oil exports are gone
The evolutions observed in Saudi Arabia are also occurring in many oil exporting
nations. Benefiting from high oil prices, oil exporters have generally grown faster
than their oil importing neighbors in 2011, but have vulnerabilities similar to those
of Saudi Arabia. For some, the problem posed by a rising consumption is
compounded by a declining production. While Saudi Arabia is still in phase II, they
are in phase III and have already been forced to change their policies of fuel prices
and policies in other economic domains.
Mitchell and Stevens (2008) have defined three moments of economic development
of oil-exporting countries, which roughly correspond to the three phases of the oil
age that we have defined. Phase I corresponds to the depletion-led development:
production and export rise, and oil revenues accelerate the country development by
financing the fiscal and foreign exchange deficits of the non-hydrocarbon sectors.
Phase II corresponds to the transition: production stalls, exports start falling, and the
country must begin reducing its reliance on the hydrocarbon sector to support
economic growth. This means less expenditure, higher taxes, higher fuel prices,
lower imports or higher exports in the non-hydrocarbon sectors. Phase III
corresponds to unsustainable dependence of the country’s economy to the
hydrocarbon sector: the need for alternatives accelerates, not only to maintain
growth but to prevent economic decline.
As already discussed, many of those changes are politically risky, notably those
affecting fuel prices, because cheap energy is part of the social contract. When
Indonesia was forced to adapt its policy of fuel prices due to the disappearing of its
oil exports, demonstrations and riots occurred in the country, those of 1998 having
precipitated the downfall of Suharto. Little incentive thus exists to preventively
revise policies to address the issue of energy prices. And, when they are finally
adjusted, it is generally late in the process of disappearing oil exports, when the
economic and social environment is more difficult. Though Saudi oil exports have
declined in the last few years, the Saudi authorities have mainly focused on the
supply side of the problem, by envisaging alternative energies to save oil for
exportation, but they were reluctant to address the demand side of the problem.
Being one of the cheapest countries in the world for transport fuel, Saudi Arabia
even lowered the price when oil was at triple digit prices to content its population.
And in a moment of high domestic tensions in the region, the Saudis are more
encouraged than ever to promote such economic concessions.
Other MENA countries were less fortunate than Saudi Arabia, being in phase III or
having already left phase III. At the end of 2010, a revolutionary wave of protests
called the Arab Spring set ablaze several Arab countries. Regime were toppled in
Tunisia, Libya, Egypt and Yemen, civil uprisings occurred in Bahrain and Syria. With
the exception of Libya, all of these countries have recently lost their oil exports, or
will lose them in the next few years. Tunisia has become oil importer in 2000, Egypt
in 2008, and Bahrain in 2010. And at the onset of the Arab Spring, Yemen and Syria
were expected to start importing oil in about 5 years. The revolution, however,
accelerated the decline of their oil exports. This is clearly seen in Figure 12: the last
dot of the production and export curves of Yemen and Syria deviates significantly
from the trend. A rebound of oil exports could thus happen in Yemen and Syria in
the next few years if the political situation appeases, but this rebound will likely be
temporary. Figure 12 also show that it took between 10 and 30 years for oil exports
to disappear completely since their peak, while in the same time, production has far
less declined: by less than 20% to more than 60%.
Figure 12: Evolution of exports (left) and production (right), and number of years
since “peak exports” for Bahrain, Egypt, Syria, Tunisia, and Yemen. The year when
exports have peaked, the value of exports and production has been set to 100,
allowing to follow their evolution in terms of percentage.
-•- Bahrain -•- Egypt -♦- Syria -ο- Tunisia -♦- Yemen
To have a clear evaluation of the role played by the loss of oil exports on the
political, social, and economic conditions that led to the Arab Spring, a careful
analysis of data and events accumulated on several years must be done for each
country, as oil can have different weights in their economies. However, impacts on
budgets due to fuel subsidies and lost revenues, higher fuel prices than in other oil
exporting countries (notably Syria and Tunisia, Figure 11), and the loss of a mean to
appease social protests that confer petrodollars – a tool used by Saudi Arabia,
Kuwait, Oman and others during the Arab Spring – likely played a role. In the past
few years, several studies had already pointed difficulties associated to the
disappearance of oil exports, even for countries like Yemen and Syria, which were
still exporting significant amounts of oil when they were hit by the wave of protests.
For Yemen, an IMF document of 2010 indicates that the past few years have been
exceptionally difficult for the economy (IMF, 2010). With the collapse of international
oil prices in late 2008, and a declining oil production only partially offset by the
production of liquefied natural gas that started in 2009, the country’s oil revenues
have declined. Combined to large energy subsidies, the loss of oil revenue had a
strong negative impact on public finances and the balance of payments. As oil
revenues account for about 60 percent of government revenues and over 90 percent
of export revenues, the loss of oil exports will have a significant impact on the
economy. The complete disappearance of oil exports is expected by 2016, in the
absence of new oil discoveries.
0
20
40
60
80
100
120
0 10 20 30 40
RelativeOilexports(%)
Years
0
20
40
60
80
100
120
0 10 20 30 40
RelativeOilProduction(%)
Years
For Syria, much of gasoil and diesel have to be imported due to insufficient refining
capacity (EIA, 2011a). But because crude oil exports are in decline and imported
refined products cost more than crude oil, the net value of Syria's oil exports and
imports has strongly deteriorated. Between 2006 and 2008, the balance dropped
from a positive value of $1.9 billion to a negative value of $100 million. Syria thus
announced a long-term plan to phase out the subsidies, but these plans were
delayed when the political situation turned sour in 2011.
Is Iran next on the list?
Iran entered in phase II in the mid-1990s. Since then, oil production has increased
by 13%, but this increase has been entirely consumed locally. The export-to-
production ratio has declined to less than 60%, and consumption is still rising. A
country is more vulnerable to the dynamics of oil consumption when its export-to-
production ratio is low. The political and financial situation of Iran could thus change
dramatically in the next few years, at the image of the fallen MENA countries, if its
economy is forced to a disorderly exit from its hydrocarbon basis. It is a situation
both Iran and the international community are likely aware, as it is exactly what the
international sanctions are about. Their effect artificially pushes Iran in phase III,
where oil exports vanish and the government budget becomes so unsustainable that
the Iranian authorities eventually decide to negotiate on their nuclear program.
The vulnerability of Iran is aggravated because Iran has limited refinery capacity for
the production of light fuels, and consequently imports a sizeable share of its
gasoline supply (EIA, 2011b). And as the price of gasoline is heavily subsidized by
the government – Iran still maintains one of the cheapest fuels in the world (Figure
11), a small decrease in oil exports has the potential to produce devastative effects
on the government budget.
The Iranian authorities developed several responses to these risks. In December
2010, the legislature passed the Targeted Subsidies Law to phase out
subsidies over a five-year period (CIA, 2012). According to EIA, in 2010, the
price that private motorists pay for their monthly quota has been increased fourfold,
and the quota allowance at that preferential price has been decreased from 100 to
60 liters per month (EIA, 2011b). The reform generated political opposition because
of inflationary fears in the midst of an economic downturn. In addition to reforms
affecting the demand side, the supply side (of fuels) has not been neglected neither.
Petrochemical plants were converted to produce gasoline as a short-term measure,
meanwhile a number of new as well as expansions of existing refineries were
programmed. These projects are expected to come online between 2012 and 2017,
in which case it is possible that the country will become a gasoline exporter in 2015.
Though these measures will certainly help by avoiding wasting money importing
refined products, it is far from certain that it will be sufficient to cut back on
consumption and to avoid a crunch of oil exports in the medium term.
Figure 13: Iran: left: Evolution of oil production and auto-consumption. Right:
Evolution of oil production, oil exports, and export-to-production ratioa
. Phases I
and II have been represented. Bottom: Difference between the export growth rate
(rexp) and the production growth rate (rprod).
a: Production and exports are relative to the production at the peak date. They are expressed in
terms of percentage, as well as the export-to-production ratio.
Conclusions
In a business-as-usual scenario, for any oil-exporting country, oil production follows
a typical pattern comprising a stage of growth, then stabilization with possible
temporary rebounds, and finally a terminal decline. On the contrary, consumption
leans towards relentless growth. Due to these dynamics, the oil exports-to-
production ratio, net exports, and production pass their peak sequentially. Hence,
any oil exporting country passing its first peak is warned that the next two peaks will
follow and that it must adapt its policies without delay to reduce its economic
dependency on hydrocarbons.
0
1
2
3
4
5
1980 1990 2000 2010
Production(Mb/d)
Year
0
20
40
60
80
100
1980 1990 2000 2010
Relatvescale Year
-10
-5
0
5
10
rexp-rprod(%)
Year
I II
Production
Exports
When such a sequence is observed for the world, oil-importing countries have also to
adapt their policies to reduce their reliance on imported oil, as possibilities to replace
failing oil-exporters by emerging oil-exporters become inadequate. For the world, the
exports-to-production ratio has already peaked, in 1998, and oil exports have also
peaked, in 2005, and have declined by 5.3% (2011). This evolution is likely
responsible of the high oil-prices observed since then, as the fall of supply of
exported oil must be compensated by an equivalent demand destruction in oil
importing countries.
Using the difference ∆ between the growth rate of global oil exports (rexp) and the
growth rate of global oil production (rprod), we showed that the degradation of the
global oil exports is a long term dynamics, and not a temporary phenomenon.
Though temporary rebounds can occur, global oil exports will likely continue
declining. Indeed, global oil production has not much room to progress, and auto-
consumption from oil-exporting countries is difficult to moderate, due to economic
growth boosted by high international oil prices, and fuels that are maintained cheap
by government intervention. Reversing this evolution would require immense efforts
from oil exporters to reduce domestic demand, but the authorities are often reluctant
to adopt such unpopular policies, and when they do so, it is often too little and too
late. The demise of oil exports has already led to profound social, economic and
political consequences for some oil-producing country (Indonesia, several countries
engulfed in the Arab Spring).
These evolutions, especially the consistent decline of world oil exports observed since
2006, are particularly worrisome and should have prompted oil-importing countries
to study carefully these dynamics and consequences, and implement energy policies
that reduce oil dependency as fast as possible. Indeed, the decline of oil exports
tends to accelerate with time, and a transition is costly and needs much time to
produce significant effects.
To plan and implement quickly a broad transition to a low oil-society, it is critical to
have a better forecast of the future availability of oil. Transparency must improve for
oil data, especially reserves, which are unaudited by independent parties in most oil-
exporting countries. It is also critical to study the likely consequences that the decline
of global oil exports has and will have on the price of oil, as well as the political and
economic consequences of the massive transfer of wealth from oil-importing to oil-
exporting countries that is allowed by triple digit oil prices. Finally, technical and
societal solutions must be implemented quickly to reduce oil consumption and
release the grip that high oil prices exert on the economy, before high oil prices kill
solutions to oil dependency. Once an economy is hurt, environmental policies, public
transportation, subsidies to alternative energies and energy conservation, research
and development budgets, can suffer badly.
Though high oil prices already affect painfully our societies, the issue of decreasing
net oil exports has received very little attention up to now. Most studies still focus on
global production, avoiding the fact that much oil is not traded on free markets, and
is produced, transformed, and sold locally at prices controlled by the government.
References
Brown, J.J., Foucher, S., (2010), Peak Oil Versus Peak Exports, ASPO conference
BP, (2012), BP Statistical Review of World Energy 2012
CIA, (2012), The World Factbook, Iran
EIA, (2011), a: Country Analysis Briefs, Syria; b: Country Analysis Briefs, Iran
EIA, (2012), Total petroleum and dry natural gas consumption data from 1980 to
2009
Fattouh, B., El-Katiri L., (2012), United Nations Development Programme, Arab
Human Development Report, Energy Subsidies in the Arab World
Hamilton J.D., (2009), a: Oil Prices and the Economic Downturn, testimony before
the « Joint Economic Committee of the United States Congress »; b: Causes and
Consequences of the Oil Shock of 2007-08 », Brookings Papers on Economic
Activity, 215-259
IMF, (2010), Republic of Yemen: Request for a Three-Year Arrangement Under the
Extended Credit Facility—Staff Report; Press Release on the Executive Board
Discussion; and Statement by the Executive Director for Yemen, September 2010
IMF, (2012), World Economic Outlook April 2012
Lahn, G., Stevens, P., (2011), Burning Oil to Keep Cool: The Hidden Energy Crisis in
Saudi Arabia, Programme Report, Chatham House
Mitchell, J. V., Stevens, P., (2008), Ending Dependence: Hard Choices for Oil-
Exporting States, Chatham House Report
Sankey P., Clark D. T., Micheloto S. (2010), The End of the Oil Age, 2011 and
beyond: a reality check, Deutsche Bank
The World Bank, (2012), Pump price for gasoline (US$ per liter); Fuel prices refer to
the pump prices of the most widely sold grade of gasoline. Prices have been
converted from the local currency to U.S. dollars.

More Related Content

What's hot

Tamohara investment newsletter August
Tamohara investment newsletter AugustTamohara investment newsletter August
Tamohara investment newsletter Augusttamohara
 
An Evaluation of the Impact of Fluctuating Oil Revenue and the Performance of...
An Evaluation of the Impact of Fluctuating Oil Revenue and the Performance of...An Evaluation of the Impact of Fluctuating Oil Revenue and the Performance of...
An Evaluation of the Impact of Fluctuating Oil Revenue and the Performance of...Triple A Research Journal
 
The impact of oil demand and oil supply shocks on the real price of oil and o...
The impact of oil demand and oil supply shocks on the real price of oil and o...The impact of oil demand and oil supply shocks on the real price of oil and o...
The impact of oil demand and oil supply shocks on the real price of oil and o...Fundación Ramón Areces
 
Promoting Export-Led Economic Growth in Nigeria –The Export Processing Zone O...
Promoting Export-Led Economic Growth in Nigeria –The Export Processing Zone O...Promoting Export-Led Economic Growth in Nigeria –The Export Processing Zone O...
Promoting Export-Led Economic Growth in Nigeria –The Export Processing Zone O...inventionjournals
 
11.11.2015 new macro economic balance bo m munkhbayar eng (1)
11.11.2015 new macro economic balance bo m munkhbayar eng (1)11.11.2015 new macro economic balance bo m munkhbayar eng (1)
11.11.2015 new macro economic balance bo m munkhbayar eng (1)The Business Council of Mongolia
 
Impact of Oil Prices Crunch on Currencies
Impact of Oil Prices Crunch on CurrenciesImpact of Oil Prices Crunch on Currencies
Impact of Oil Prices Crunch on CurrenciesPrashant Mirgule
 
Economic and Financial Development, and Income Inequality
Economic and Financial Development, and Income InequalityEconomic and Financial Development, and Income Inequality
Economic and Financial Development, and Income InequalityOECD Development Centre, Paris
 
Mercer Capital's Value Focus: Energy Industry | 3Q 2015 | Segment: Explorati...
Mercer Capital's Value Focus: Energy Industry | 3Q 2015 | Segment:  Explorati...Mercer Capital's Value Focus: Energy Industry | 3Q 2015 | Segment:  Explorati...
Mercer Capital's Value Focus: Energy Industry | 3Q 2015 | Segment: Explorati...Mercer Capital
 
Impact of oil price in gcc banking system 2016 - 2017
Impact of oil price in gcc banking system 2016 - 2017Impact of oil price in gcc banking system 2016 - 2017
Impact of oil price in gcc banking system 2016 - 2017Massimo Falcioni
 
Economic Growth in the UK Economy
Economic Growth in the UK EconomyEconomic Growth in the UK Economy
Economic Growth in the UK Economytutor2u
 
Exxon Initiating Coverage Report
Exxon Initiating Coverage ReportExxon Initiating Coverage Report
Exxon Initiating Coverage ReportMichael Butkerait
 
Economic fluctuations
Economic fluctuationsEconomic fluctuations
Economic fluctuationscmsrahaman
 
Economic Outlook of Turkey
Economic Outlook of TurkeyEconomic Outlook of Turkey
Economic Outlook of TurkeyBCN Turkey
 
Special report-12-feb-2019-epic-research
Special report-12-feb-2019-epic-researchSpecial report-12-feb-2019-epic-research
Special report-12-feb-2019-epic-researchEpic Research Limited
 

What's hot (20)

Tamohara investment newsletter August
Tamohara investment newsletter AugustTamohara investment newsletter August
Tamohara investment newsletter August
 
oilprice
oilpriceoilprice
oilprice
 
Russia and Oil – Out of Control
Russia and Oil – Out of ControlRussia and Oil – Out of Control
Russia and Oil – Out of Control
 
An Evaluation of the Impact of Fluctuating Oil Revenue and the Performance of...
An Evaluation of the Impact of Fluctuating Oil Revenue and the Performance of...An Evaluation of the Impact of Fluctuating Oil Revenue and the Performance of...
An Evaluation of the Impact of Fluctuating Oil Revenue and the Performance of...
 
The impact of oil demand and oil supply shocks on the real price of oil and o...
The impact of oil demand and oil supply shocks on the real price of oil and o...The impact of oil demand and oil supply shocks on the real price of oil and o...
The impact of oil demand and oil supply shocks on the real price of oil and o...
 
Investeurs chronicles 12
Investeurs chronicles 12Investeurs chronicles 12
Investeurs chronicles 12
 
Promoting Export-Led Economic Growth in Nigeria –The Export Processing Zone O...
Promoting Export-Led Economic Growth in Nigeria –The Export Processing Zone O...Promoting Export-Led Economic Growth in Nigeria –The Export Processing Zone O...
Promoting Export-Led Economic Growth in Nigeria –The Export Processing Zone O...
 
Impact of Oil Price Volatility on Macroeconomic Variables and Sustainable Dev...
Impact of Oil Price Volatility on Macroeconomic Variables and Sustainable Dev...Impact of Oil Price Volatility on Macroeconomic Variables and Sustainable Dev...
Impact of Oil Price Volatility on Macroeconomic Variables and Sustainable Dev...
 
11.11.2015 new macro economic balance bo m munkhbayar eng (1)
11.11.2015 new macro economic balance bo m munkhbayar eng (1)11.11.2015 new macro economic balance bo m munkhbayar eng (1)
11.11.2015 new macro economic balance bo m munkhbayar eng (1)
 
Impact of Oil Prices Crunch on Currencies
Impact of Oil Prices Crunch on CurrenciesImpact of Oil Prices Crunch on Currencies
Impact of Oil Prices Crunch on Currencies
 
Economic and Financial Development, and Income Inequality
Economic and Financial Development, and Income InequalityEconomic and Financial Development, and Income Inequality
Economic and Financial Development, and Income Inequality
 
Mercer Capital's Value Focus: Energy Industry | 3Q 2015 | Segment: Explorati...
Mercer Capital's Value Focus: Energy Industry | 3Q 2015 | Segment:  Explorati...Mercer Capital's Value Focus: Energy Industry | 3Q 2015 | Segment:  Explorati...
Mercer Capital's Value Focus: Energy Industry | 3Q 2015 | Segment: Explorati...
 
Impact of oil price in gcc banking system 2016 - 2017
Impact of oil price in gcc banking system 2016 - 2017Impact of oil price in gcc banking system 2016 - 2017
Impact of oil price in gcc banking system 2016 - 2017
 
Economic Growth in the UK Economy
Economic Growth in the UK EconomyEconomic Growth in the UK Economy
Economic Growth in the UK Economy
 
Exxon Initiating Coverage Report
Exxon Initiating Coverage ReportExxon Initiating Coverage Report
Exxon Initiating Coverage Report
 
Economic cycle slide
Economic cycle slideEconomic cycle slide
Economic cycle slide
 
Economic fluctuations
Economic fluctuationsEconomic fluctuations
Economic fluctuations
 
Economic Outlook of Turkey
Economic Outlook of TurkeyEconomic Outlook of Turkey
Economic Outlook of Turkey
 
Special report-12-feb-2019-epic-research
Special report-12-feb-2019-epic-researchSpecial report-12-feb-2019-epic-research
Special report-12-feb-2019-epic-research
 
Turkish Economy 2016
Turkish Economy 2016Turkish Economy 2016
Turkish Economy 2016
 

Similar to Understanding the decline of global oil exports

2010 Kelly work example Analytical report for Siemens - High oil and gas pr...
2010 Kelly work example   Analytical report for Siemens - High oil and gas pr...2010 Kelly work example   Analytical report for Siemens - High oil and gas pr...
2010 Kelly work example Analytical report for Siemens - High oil and gas pr...JAKIRL
 
Oil Prices and the Global Economy: Is It Di¤erent This Time Around?
Oil Prices and the Global Economy: Is It Di¤erent This Time Around?Oil Prices and the Global Economy: Is It Di¤erent This Time Around?
Oil Prices and the Global Economy: Is It Di¤erent This Time Around?Economic Research Forum
 
New economics-of-oil-spencer-dale
New economics-of-oil-spencer-daleNew economics-of-oil-spencer-dale
New economics-of-oil-spencer-daleaguslatief
 
Oil Insights November 2015
Oil Insights November 2015Oil Insights November 2015
Oil Insights November 2015Oussama Laroussi
 
Crude Oil Price Research
Crude Oil Price ResearchCrude Oil Price Research
Crude Oil Price ResearchFaisal Hamawi
 
Research Paper: How much oil remains for the world to produce? Comparing asse...
Research Paper: How much oil remains for the world to produce? Comparing asse...Research Paper: How much oil remains for the world to produce? Comparing asse...
Research Paper: How much oil remains for the world to produce? Comparing asse...Energy for One World
 
An Investigation of Crude Oil and its Implication for Financial Markets
An Investigation of Crude Oil and its Implication for Financial Markets An Investigation of Crude Oil and its Implication for Financial Markets
An Investigation of Crude Oil and its Implication for Financial Markets Priesnell Warren ✔
 
Project on petroleum industries
Project on petroleum industriesProject on petroleum industries
Project on petroleum industriesAdit Shamanur
 
Vectorautoregressivemodel and the nigerian economy
Vectorautoregressivemodel and the nigerian economyVectorautoregressivemodel and the nigerian economy
Vectorautoregressivemodel and the nigerian economyAlexander Decker
 
MLA_Impacts of low oil prices on American unconventional and offshore oil pro...
MLA_Impacts of low oil prices on American unconventional and offshore oil pro...MLA_Impacts of low oil prices on American unconventional and offshore oil pro...
MLA_Impacts of low oil prices on American unconventional and offshore oil pro...Mohamed Lahjibi
 
2011 mmui total business environment
2011 mmui total business environment2011 mmui total business environment
2011 mmui total business environmentChristophe Benavent
 
IS THIS END OF CRUDE OIL INDUSTRY?
IS THIS END OF CRUDE OIL INDUSTRY?IS THIS END OF CRUDE OIL INDUSTRY?
IS THIS END OF CRUDE OIL INDUSTRY?Arjun Reghu
 
Crude oil price, stock price and some selected macroeconomic indicators
Crude oil price, stock price and some selected macroeconomic indicatorsCrude oil price, stock price and some selected macroeconomic indicators
Crude oil price, stock price and some selected macroeconomic indicatorsAlexander Decker
 
11.crude oil price, stock price and some selected macroeconomic indicators
11.crude oil price, stock price and some selected macroeconomic indicators11.crude oil price, stock price and some selected macroeconomic indicators
11.crude oil price, stock price and some selected macroeconomic indicatorsAlexander Decker
 

Similar to Understanding the decline of global oil exports (20)

2010 Kelly work example Analytical report for Siemens - High oil and gas pr...
2010 Kelly work example   Analytical report for Siemens - High oil and gas pr...2010 Kelly work example   Analytical report for Siemens - High oil and gas pr...
2010 Kelly work example Analytical report for Siemens - High oil and gas pr...
 
Oil Prices and the Global Economy: Is It Di¤erent This Time Around?
Oil Prices and the Global Economy: Is It Di¤erent This Time Around?Oil Prices and the Global Economy: Is It Di¤erent This Time Around?
Oil Prices and the Global Economy: Is It Di¤erent This Time Around?
 
whatifscenario-2015-oil
whatifscenario-2015-oilwhatifscenario-2015-oil
whatifscenario-2015-oil
 
New economics-of-oil-spencer-dale
New economics-of-oil-spencer-daleNew economics-of-oil-spencer-dale
New economics-of-oil-spencer-dale
 
Oil Insights November 2015
Oil Insights November 2015Oil Insights November 2015
Oil Insights November 2015
 
Changes in Oil Price and Economic Impacts
Changes in Oil Price and Economic ImpactsChanges in Oil Price and Economic Impacts
Changes in Oil Price and Economic Impacts
 
Crude Oil Price Research
Crude Oil Price ResearchCrude Oil Price Research
Crude Oil Price Research
 
Research Paper: How much oil remains for the world to produce? Comparing asse...
Research Paper: How much oil remains for the world to produce? Comparing asse...Research Paper: How much oil remains for the world to produce? Comparing asse...
Research Paper: How much oil remains for the world to produce? Comparing asse...
 
An Investigation of Crude Oil and its Implication for Financial Markets
An Investigation of Crude Oil and its Implication for Financial Markets An Investigation of Crude Oil and its Implication for Financial Markets
An Investigation of Crude Oil and its Implication for Financial Markets
 
Project on petroleum industries
Project on petroleum industriesProject on petroleum industries
Project on petroleum industries
 
Can OPEC Cartel Reverse Crude Oil Price Downfall?
Can OPEC Cartel Reverse Crude Oil Price Downfall?Can OPEC Cartel Reverse Crude Oil Price Downfall?
Can OPEC Cartel Reverse Crude Oil Price Downfall?
 
Vectorautoregressivemodel and the nigerian economy
Vectorautoregressivemodel and the nigerian economyVectorautoregressivemodel and the nigerian economy
Vectorautoregressivemodel and the nigerian economy
 
Publish
PublishPublish
Publish
 
MLA_Impacts of low oil prices on American unconventional and offshore oil pro...
MLA_Impacts of low oil prices on American unconventional and offshore oil pro...MLA_Impacts of low oil prices on American unconventional and offshore oil pro...
MLA_Impacts of low oil prices on American unconventional and offshore oil pro...
 
2011 mmui total business environment
2011 mmui total business environment2011 mmui total business environment
2011 mmui total business environment
 
Oil Revenues and Economic Growth in Saudi Arabia
Oil Revenues and Economic Growth in Saudi ArabiaOil Revenues and Economic Growth in Saudi Arabia
Oil Revenues and Economic Growth in Saudi Arabia
 
IS THIS END OF CRUDE OIL INDUSTRY?
IS THIS END OF CRUDE OIL INDUSTRY?IS THIS END OF CRUDE OIL INDUSTRY?
IS THIS END OF CRUDE OIL INDUSTRY?
 
Crude oil price, stock price and some selected macroeconomic indicators
Crude oil price, stock price and some selected macroeconomic indicatorsCrude oil price, stock price and some selected macroeconomic indicators
Crude oil price, stock price and some selected macroeconomic indicators
 
11.crude oil price, stock price and some selected macroeconomic indicators
11.crude oil price, stock price and some selected macroeconomic indicators11.crude oil price, stock price and some selected macroeconomic indicators
11.crude oil price, stock price and some selected macroeconomic indicators
 
CASE Network E-briefs 1.2010 - The global recession and energy markets
CASE Network E-briefs 1.2010 - The global recession and energy marketsCASE Network E-briefs 1.2010 - The global recession and energy markets
CASE Network E-briefs 1.2010 - The global recession and energy markets
 

Recently uploaded

Mature dropshipping via API with DroFx.pptx
Mature dropshipping via API with DroFx.pptxMature dropshipping via API with DroFx.pptx
Mature dropshipping via API with DroFx.pptxolyaivanovalion
 
Edukaciniai dropshipping via API with DroFx
Edukaciniai dropshipping via API with DroFxEdukaciniai dropshipping via API with DroFx
Edukaciniai dropshipping via API with DroFxolyaivanovalion
 
VIP High Profile Call Girls Amravati Aarushi 8250192130 Independent Escort Se...
VIP High Profile Call Girls Amravati Aarushi 8250192130 Independent Escort Se...VIP High Profile Call Girls Amravati Aarushi 8250192130 Independent Escort Se...
VIP High Profile Call Girls Amravati Aarushi 8250192130 Independent Escort Se...Suhani Kapoor
 
꧁❤ Greater Noida Call Girls Delhi ❤꧂ 9711199171 ☎️ Hard And Sexy Vip Call
꧁❤ Greater Noida Call Girls Delhi ❤꧂ 9711199171 ☎️ Hard And Sexy Vip Call꧁❤ Greater Noida Call Girls Delhi ❤꧂ 9711199171 ☎️ Hard And Sexy Vip Call
꧁❤ Greater Noida Call Girls Delhi ❤꧂ 9711199171 ☎️ Hard And Sexy Vip Callshivangimorya083
 
代办国外大学文凭《原版美国UCLA文凭证书》加州大学洛杉矶分校毕业证制作成绩单修改
代办国外大学文凭《原版美国UCLA文凭证书》加州大学洛杉矶分校毕业证制作成绩单修改代办国外大学文凭《原版美国UCLA文凭证书》加州大学洛杉矶分校毕业证制作成绩单修改
代办国外大学文凭《原版美国UCLA文凭证书》加州大学洛杉矶分校毕业证制作成绩单修改atducpo
 
Al Barsha Escorts $#$ O565212860 $#$ Escort Service In Al Barsha
Al Barsha Escorts $#$ O565212860 $#$ Escort Service In Al BarshaAl Barsha Escorts $#$ O565212860 $#$ Escort Service In Al Barsha
Al Barsha Escorts $#$ O565212860 $#$ Escort Service In Al BarshaAroojKhan71
 
Call Girls in Sarai Kale Khan Delhi 💯 Call Us 🔝9205541914 🔝( Delhi) Escorts S...
Call Girls in Sarai Kale Khan Delhi 💯 Call Us 🔝9205541914 🔝( Delhi) Escorts S...Call Girls in Sarai Kale Khan Delhi 💯 Call Us 🔝9205541914 🔝( Delhi) Escorts S...
Call Girls in Sarai Kale Khan Delhi 💯 Call Us 🔝9205541914 🔝( Delhi) Escorts S...Delhi Call girls
 
VidaXL dropshipping via API with DroFx.pptx
VidaXL dropshipping via API with DroFx.pptxVidaXL dropshipping via API with DroFx.pptx
VidaXL dropshipping via API with DroFx.pptxolyaivanovalion
 
Ravak dropshipping via API with DroFx.pptx
Ravak dropshipping via API with DroFx.pptxRavak dropshipping via API with DroFx.pptx
Ravak dropshipping via API with DroFx.pptxolyaivanovalion
 
Market Analysis in the 5 Largest Economic Countries in Southeast Asia.pdf
Market Analysis in the 5 Largest Economic Countries in Southeast Asia.pdfMarket Analysis in the 5 Largest Economic Countries in Southeast Asia.pdf
Market Analysis in the 5 Largest Economic Countries in Southeast Asia.pdfRachmat Ramadhan H
 
RA-11058_IRR-COMPRESS Do 198 series of 1998
RA-11058_IRR-COMPRESS Do 198 series of 1998RA-11058_IRR-COMPRESS Do 198 series of 1998
RA-11058_IRR-COMPRESS Do 198 series of 1998YohFuh
 
Low Rate Call Girls Bhilai Anika 8250192130 Independent Escort Service Bhilai
Low Rate Call Girls Bhilai Anika 8250192130 Independent Escort Service BhilaiLow Rate Call Girls Bhilai Anika 8250192130 Independent Escort Service Bhilai
Low Rate Call Girls Bhilai Anika 8250192130 Independent Escort Service BhilaiSuhani Kapoor
 
BPAC WITH UFSBI GENERAL PRESENTATION 18_05_2017-1.pptx
BPAC WITH UFSBI GENERAL PRESENTATION 18_05_2017-1.pptxBPAC WITH UFSBI GENERAL PRESENTATION 18_05_2017-1.pptx
BPAC WITH UFSBI GENERAL PRESENTATION 18_05_2017-1.pptxMohammedJunaid861692
 
Invezz.com - Grow your wealth with trading signals
Invezz.com - Grow your wealth with trading signalsInvezz.com - Grow your wealth with trading signals
Invezz.com - Grow your wealth with trading signalsInvezz1
 
Call me @ 9892124323 Cheap Rate Call Girls in Vashi with Real Photo 100% Secure
Call me @ 9892124323  Cheap Rate Call Girls in Vashi with Real Photo 100% SecureCall me @ 9892124323  Cheap Rate Call Girls in Vashi with Real Photo 100% Secure
Call me @ 9892124323 Cheap Rate Call Girls in Vashi with Real Photo 100% SecurePooja Nehwal
 
Apidays Singapore 2024 - Building Digital Trust in a Digital Economy by Veron...
Apidays Singapore 2024 - Building Digital Trust in a Digital Economy by Veron...Apidays Singapore 2024 - Building Digital Trust in a Digital Economy by Veron...
Apidays Singapore 2024 - Building Digital Trust in a Digital Economy by Veron...apidays
 
Industrialised data - the key to AI success.pdf
Industrialised data - the key to AI success.pdfIndustrialised data - the key to AI success.pdf
Industrialised data - the key to AI success.pdfLars Albertsson
 

Recently uploaded (20)

Mature dropshipping via API with DroFx.pptx
Mature dropshipping via API with DroFx.pptxMature dropshipping via API with DroFx.pptx
Mature dropshipping via API with DroFx.pptx
 
꧁❤ Aerocity Call Girls Service Aerocity Delhi ❤꧂ 9999965857 ☎️ Hard And Sexy ...
꧁❤ Aerocity Call Girls Service Aerocity Delhi ❤꧂ 9999965857 ☎️ Hard And Sexy ...꧁❤ Aerocity Call Girls Service Aerocity Delhi ❤꧂ 9999965857 ☎️ Hard And Sexy ...
꧁❤ Aerocity Call Girls Service Aerocity Delhi ❤꧂ 9999965857 ☎️ Hard And Sexy ...
 
Edukaciniai dropshipping via API with DroFx
Edukaciniai dropshipping via API with DroFxEdukaciniai dropshipping via API with DroFx
Edukaciniai dropshipping via API with DroFx
 
VIP High Profile Call Girls Amravati Aarushi 8250192130 Independent Escort Se...
VIP High Profile Call Girls Amravati Aarushi 8250192130 Independent Escort Se...VIP High Profile Call Girls Amravati Aarushi 8250192130 Independent Escort Se...
VIP High Profile Call Girls Amravati Aarushi 8250192130 Independent Escort Se...
 
꧁❤ Greater Noida Call Girls Delhi ❤꧂ 9711199171 ☎️ Hard And Sexy Vip Call
꧁❤ Greater Noida Call Girls Delhi ❤꧂ 9711199171 ☎️ Hard And Sexy Vip Call꧁❤ Greater Noida Call Girls Delhi ❤꧂ 9711199171 ☎️ Hard And Sexy Vip Call
꧁❤ Greater Noida Call Girls Delhi ❤꧂ 9711199171 ☎️ Hard And Sexy Vip Call
 
代办国外大学文凭《原版美国UCLA文凭证书》加州大学洛杉矶分校毕业证制作成绩单修改
代办国外大学文凭《原版美国UCLA文凭证书》加州大学洛杉矶分校毕业证制作成绩单修改代办国外大学文凭《原版美国UCLA文凭证书》加州大学洛杉矶分校毕业证制作成绩单修改
代办国外大学文凭《原版美国UCLA文凭证书》加州大学洛杉矶分校毕业证制作成绩单修改
 
Al Barsha Escorts $#$ O565212860 $#$ Escort Service In Al Barsha
Al Barsha Escorts $#$ O565212860 $#$ Escort Service In Al BarshaAl Barsha Escorts $#$ O565212860 $#$ Escort Service In Al Barsha
Al Barsha Escorts $#$ O565212860 $#$ Escort Service In Al Barsha
 
VIP Call Girls Service Charbagh { Lucknow Call Girls Service 9548273370 } Boo...
VIP Call Girls Service Charbagh { Lucknow Call Girls Service 9548273370 } Boo...VIP Call Girls Service Charbagh { Lucknow Call Girls Service 9548273370 } Boo...
VIP Call Girls Service Charbagh { Lucknow Call Girls Service 9548273370 } Boo...
 
Call Girls in Sarai Kale Khan Delhi 💯 Call Us 🔝9205541914 🔝( Delhi) Escorts S...
Call Girls in Sarai Kale Khan Delhi 💯 Call Us 🔝9205541914 🔝( Delhi) Escorts S...Call Girls in Sarai Kale Khan Delhi 💯 Call Us 🔝9205541914 🔝( Delhi) Escorts S...
Call Girls in Sarai Kale Khan Delhi 💯 Call Us 🔝9205541914 🔝( Delhi) Escorts S...
 
VidaXL dropshipping via API with DroFx.pptx
VidaXL dropshipping via API with DroFx.pptxVidaXL dropshipping via API with DroFx.pptx
VidaXL dropshipping via API with DroFx.pptx
 
Delhi 99530 vip 56974 Genuine Escort Service Call Girls in Kishangarh
Delhi 99530 vip 56974 Genuine Escort Service Call Girls in  KishangarhDelhi 99530 vip 56974 Genuine Escort Service Call Girls in  Kishangarh
Delhi 99530 vip 56974 Genuine Escort Service Call Girls in Kishangarh
 
Ravak dropshipping via API with DroFx.pptx
Ravak dropshipping via API with DroFx.pptxRavak dropshipping via API with DroFx.pptx
Ravak dropshipping via API with DroFx.pptx
 
Market Analysis in the 5 Largest Economic Countries in Southeast Asia.pdf
Market Analysis in the 5 Largest Economic Countries in Southeast Asia.pdfMarket Analysis in the 5 Largest Economic Countries in Southeast Asia.pdf
Market Analysis in the 5 Largest Economic Countries in Southeast Asia.pdf
 
RA-11058_IRR-COMPRESS Do 198 series of 1998
RA-11058_IRR-COMPRESS Do 198 series of 1998RA-11058_IRR-COMPRESS Do 198 series of 1998
RA-11058_IRR-COMPRESS Do 198 series of 1998
 
Low Rate Call Girls Bhilai Anika 8250192130 Independent Escort Service Bhilai
Low Rate Call Girls Bhilai Anika 8250192130 Independent Escort Service BhilaiLow Rate Call Girls Bhilai Anika 8250192130 Independent Escort Service Bhilai
Low Rate Call Girls Bhilai Anika 8250192130 Independent Escort Service Bhilai
 
BPAC WITH UFSBI GENERAL PRESENTATION 18_05_2017-1.pptx
BPAC WITH UFSBI GENERAL PRESENTATION 18_05_2017-1.pptxBPAC WITH UFSBI GENERAL PRESENTATION 18_05_2017-1.pptx
BPAC WITH UFSBI GENERAL PRESENTATION 18_05_2017-1.pptx
 
Invezz.com - Grow your wealth with trading signals
Invezz.com - Grow your wealth with trading signalsInvezz.com - Grow your wealth with trading signals
Invezz.com - Grow your wealth with trading signals
 
Call me @ 9892124323 Cheap Rate Call Girls in Vashi with Real Photo 100% Secure
Call me @ 9892124323  Cheap Rate Call Girls in Vashi with Real Photo 100% SecureCall me @ 9892124323  Cheap Rate Call Girls in Vashi with Real Photo 100% Secure
Call me @ 9892124323 Cheap Rate Call Girls in Vashi with Real Photo 100% Secure
 
Apidays Singapore 2024 - Building Digital Trust in a Digital Economy by Veron...
Apidays Singapore 2024 - Building Digital Trust in a Digital Economy by Veron...Apidays Singapore 2024 - Building Digital Trust in a Digital Economy by Veron...
Apidays Singapore 2024 - Building Digital Trust in a Digital Economy by Veron...
 
Industrialised data - the key to AI success.pdf
Industrialised data - the key to AI success.pdfIndustrialised data - the key to AI success.pdf
Industrialised data - the key to AI success.pdf
 

Understanding the decline of global oil exports

  • 1. UNDERSTANDING THE DECLINE OF GLOBAL OIL EXPORTS Patrick Brocorens Laboratory for chemistry of novel materials, UMONS, Belgium e-mail: patrick.brocorens@umons.ac.be phone: + 32 (0)65373867  Patrick Brocorens got its PhD in chemistry in 2002 and used for years modeling tools to predict properties of hydrocarbon-based molecules. In 2007, he launched the Belgian section of the Association for the Study of Peak Oil and gas (ASPO), and now uses its expertise in modeling to predict oil production evolution. This paper has been published in the Recueil du premier congrès interdisciplinaire du développement durable, Thème 1 : Biens communs mondiaux, Service public de Wallonie, Namur, 2013  Abstract In this study, we use indicators such as the exports-to-production ratio, and the difference between the growth rate of oil exports and the growth rate of oil production, to characterize the dynamics that lead to a decline of oil exports. Many countries have passed their peak of oil exports, and the world as well, in 2005. The indicators presented here show that the deterioration of the fundamentals is a long term dynamics, thus meaning that global oil export will likely continue declining, though temporary rebounds can occur. These evolutions are then related to recent events such as the Arab Spring, the rise of oil prices on international markets, and the current economic crises. The peaking of world oil exports is a recent and significant turning point, though still largely ignored, but its implications for both oil- importing and oil-exporting countries are vast.
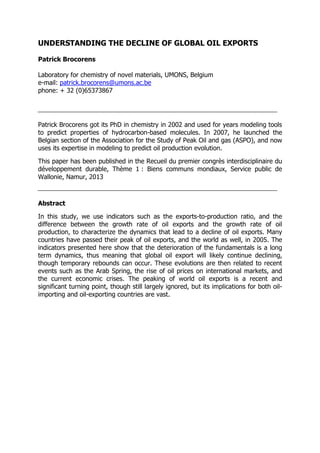
  • 2. Introduction For the last few years, there has been a lot of discussion to know whether world oil production can still grow in the future, or is reaching a maximum that is the prelude to a long decline of the oil flow that irrigates the world economy. Though this debate about peak oil is still far from reaching its own peak, a more immediate concern far less discussed is the peaking and decline of oil exports. A production decline is indeed not mandatory for a decline of oil exports to happen. Oil exports peak when an oil producing country has a domestic consumption that rises faster than its production does. Such dynamics have to be studied carefully as declining oil exports are critical both for nations that depend on others for filling their oil thirst, and for oil exporting countries that see their oil-based earnings evaporating. A few authors studied the dynamics of oil exports. Jeffrey Brown built an “export land model” that shows and explains that the decline of oil exports tends to accelerate with time (Brown, Foucher, 2010). Mitchell and Stevens (2008) built predictions of future oil exports for several countries and analyzed the consequences for the economies and policies of these countries. In this study, we show that two indicators, the exports-to-production ratio, and the difference ∆ between the growth rate of oil exports (rexp) and the growth rate of oil production (rprod), can complement these earlier prospective methods. Using these tools, we analyze the dynamics of oil exports at country and world level, examine the consequences of these evolutions, and suggest measures to deal with these consequences. Oil production and oil consumption on a collision course For an oil-producing country to export oil, it must produce more oil than it consumes. The evolution of oil exports is thus the combination of two trends: the evolution of production and the evolution of consumption. In any country, the historical evolution of oil extraction follows a typical pattern. It begins by the discovery of a few fields and the successful production of the first barrels, which attract more prospections and kick off a dynamic of oil discoveries and development that feeds on past successes and expectations of new successes. The potential of the region is full and oil production grows exponentially. Later, as the industry matures, the new oil fields are more difficult to find and to exploit, they tend to be smaller, while more and more ageing fields enter into decline. The growth of oil production slows down. Eventually, when the pace of development of new fields is unable to compensate the loss of ageing fields despite ongoing investments, growth stops, the production of the whole country reaches a maximum and then enters into decline. The historical production maximum is called peak oil. Often, some technological, economic or political effects rejuvenate the production, and several peaks or a plateau occur before the terminal decline sets in. However, in the long term, the general pattern of oil production looks like a succession of three phases: growth, stabilization, and terminal decline, as schematically represented in Figure 1 for an hypothetical country exploiting oil for more than 200 years.
  • 3. As for oil consumption in oil exporting countries, it tends to increase with time, due to economic growth and fuel prices that are often lower than international standards. In the hypothetical country of Figure 1 (left), oil consumption is assumed to rise at a constant rate. Export is the share of production above the consumption curve. This country thus evolves from the status of oil importer to oil exporter, then to oil importer again. During the time window the country is exporter, oil exports also get through the three stages of growth, stabilization, and decline, but they peak and decline before production does (Figure 1, right). The export-to-production ratio, i.e. the share of production that is exported, follows a similar pattern, but peaks before both exports and production do (Figure 1, right). Figure 1, left: Evolution of oil production and oil consumption in a model country. Right: Evolution of oil production, oil exports, and the export-to-production ratio in the same model countrya . The dotted lines indicate the onset of the decline of these three parameters. The graphic has been divided in phase I (simultaneous growth of the three parameters), phase II (successive decline of the three parameters), and phase III (simultaneous decline of the three parameters). a: Production and exports are relative to the production at the peak date. They are expressed in terms of percentage, as well as the export-to-production ratio. In Figure 1, right, we have distinguished three phases: phase I (simultaneous growth of production, exports, and the export-to-production ratio), phase II (successive decline of the three parameters), and phase III (simultaneous decline of the three parameters). In phases I and III, the rate of variation of exports is larger than it is for production: in phase I, exports represent a growing share of production (Figure 1, right), which itself is growing, and in phase III, exports represent a declining share of production, which itself is declining. The two compounded effects imply that in these phases, significant growth or decline of oil exports can occur in a relatively short period of time, sometimes in a few years. Phase I lasts as long as the growth rate of production is above that of consumption. But with time, the growth rate of production always slows down, and when it has slowed down enough to match the growth rate of consumption, the export-to- production ratio peaks – exports then grow at the same pace as consumption and production – and phase II starts. In phase II, the growth rate of production slows down further and drops below that of consumption, and the export-to-production 25 50 75 100 125 150 Oilvolumes(a.u.) Time (years) 0 20 40 60 80 100 25 50 75 100 125 150 Relativescale Time (years) II IIII
  • 4. ratio starts declining. Exports, however, can continue growing for a while because the growth rate of production, though smaller than that of consumption, generally applies to a larger volume. Hence, the increment of production is still above the increment of consumption. But eventually, the increment of consumption becomes equal to the increment of production, and then becomes larger, and exports in turn reach their peak and start declining. This is especially true when production is plateauing, i.e. when no increment of production is observed at all. Finally, production starts declining and phase III starts. The decline of exports accelerates. In a ‘business as usual’ trajectory, the export-to-production ratio, oil exports, and oil production peak and enter into decline sequentially. No one is affirming this pattern should always occur as strictly as described. Production can rebound and consumption pattern can change. It is imaginable that a peaking country implement new policies that decrease domestic consumption fast enough to offset any production decline, thus raising exports in the face of a declining production. If history is any guide, these measures are, however, politically challenging, at least in the magnitude required to produce significant effects on the level of exports. Thus, in the absence of such events, the ‘business as usual’ scenario prevails. This means that passing one of these peaks is a warning for the next two peaks, and signals the urgency for additional studies and adaptation of policies for both oil-exporting and oil-importing countries, especially that many changes of energy policies require much time, sometimes decades, to produce significant effects. Two case figures: Vietnam and Indonesia Two real countries are analyzed to validate the model: Vietnam and Indonesia. Consumption data were subtracted from production data to obtain net export values; unless specified otherwise, the EIA database has been used for all countries that will follow in this study. For Vietnam, the export-to-production ratio plateaued in 1992, immediately after the country has become oil exporter (Figure 2). Although the production was growing at a strong pace of 12% per year, oil consumption was also growing at that pace, thus making stagnant the export-to-production ratio. This plateau lasted more than 10 years, and was low. Only 40% of the production was exported, meaning that exports were highly susceptible to a reversal of fortune in oil production. The rise of exports stopped in 2001, three years before production did. Exports then plummeted and disappeared in 10 years, while production declined by a mere 19% since their peak. Vietnam is an example where the production downturn was sharp. Indonesia, on the contrary, maintained a long production plateau (1974-2000). During that period, the evolution of exports was thus entirely dominated by the evolution of consumption, which was growing at an average pace of 7% per year (BP, 2012), meaning a doubling of consumption every 10 years. As a result, exports had already halved when production finally started its decline in 2000, an event that accelerated the demise of exports. About 40% of the production was still exported in 1999, but five years later Indonesia had become a net oil importer (Figure 2). In
  • 5. January 2009, the country suspended its membership to the Organization of the Petroleum Exporting Countries (OPEC), to which it belonged since 1962. Figure 2, left: Evolution of oil production and oil consumption in Vietnam and Indonesia. Right: Evolution of oil production, oil exports, and the export-to- production ratio in Vietnam and Indonesiaa . Phases I to III have been represented. Vietnam Indonesia a: Production and exports are relative to the production at the peak date. They are expressed in terms of percentage, as well as the export-to-production ratio. The declining performance of exports with respect to production To better evaluate how exports perform with respect to production, the difference ∆ between the growth rate of exports (rexp) and the growth rate of production (rprod) has been calculated. A positive ∆ means that the rate of change of exports is some percentage points higher (equal to ∆) than that of production. Thus, if production increases, exports increase at a faster pace, and if production decreases, exports decrease more slowly or even continue growing. A negative ∆ means that exports evolve more poorly than production. In a worst case scenario, production rises, but exports decline. Initially, when a country becomes exporter, the difference between both rates is positive and huge (Figure 3), but it rapidly slows down because when exports grow faster than production, the export-to-production ratio increases, and that ratio cannot go beyond 100%. In reality, its maximum is always lower than 100% 0 0.1 0.2 0.3 0.4 1980 1985 1990 1995 2000 2005 2010 Production(Mb/d) Year 0 20 40 60 80 100 1980 1990 2000 2010Relatvescale Year 0 0.3 0.6 0.9 1.2 1.5 1.8 1980 1985 1990 1995 2000 2005 2010 Production(Mb/d) Year 0 20 40 60 80 100 1980 1990 2000 2010 Relatvescale Year Indonesia leaves OPEC I II III II III Production Production
  • 6. because all countries consume oil. When the exports-to-production ratio peaks (Figure 3), exports evolve like production, meaning that ∆ is zero. Then, ∆ turns negative, and the decline accelerates with time, especially in phase III. The evolution of ∆ has a very characteristic shape, which illustrates well that oil exports get through the phases of precipitous rise, slow erosion, and then accelerating decline (Figure 3). Indonesia, for instance, was characterized by a long period where the export growth rate performed a few percentage points below the production growth rate, then leaped over the cliff in the last six years of existence of the country as an oil exporter. Figure 3: Evolution of the export-to-production ratio, and of the difference between the export growth rate (rexp) and the production growth rate (rprod), for the hypothetical country of Figure 1, for Vietnam, and for Indonesia. Phases I to III have been represented. World oil exports in decline World oil exports peaked in 2005 and since then have declined by 5.3% (2011, Figure 4). This is not the first time in history that oil exports have suffered a sustained decline. During the 1970s, two oil-shocks rocked the occidental societies. Deep recessions and important policy changes occured simultaneously in oil-importing countries, which quickly reduced oil consumption in the early 1980s. This was the counter-oil shock. With the slump of demand, world production, world exports, and oil prices all collapsed simultaneously, and hammered strongly the economies of oil exporting nations. The decline bottomed up in 1985. Then two decades of recovery followed, punctuated by temporary drops associated to economic crises. The recovery was a reality for oil production and exports, but not for the oil price, as excess capacity ensured that the market was well supplied, even in the context of sensitive geopolitical events. The crisis of 1990-1991 provides a very good overview of oil excess capacity existing at that time, as two political events could have produced more dire consequences on the oil markets if that excess capacity had not been there. The first event is the -50 -25 0 25 50 rexp-rprod(%) Time (years) -100 -80 -60 -40 -20 0 20 40 60 80 100 rexp-rprod(%) Time (Years) -100 -80 -60 -40 -20 0rexp-rprod(%) Time (Years) Vietnam (1992-2011) Indonesia (1981-2004) I II III II III IIIIII
  • 7. breakup of the Soviet Union, which led to a precipitous decline of the country’s oil production: -35% in only four years. A drop of such amplitude could have wiped out completely the exports of the second world exporter in the world. And indeed, in 1991, the exports had already collapsed by a whopping 32%. However, this drop was temporary and exports have quickly rebounded in the following years because consumption was declining still more precipitously than production, by 42% in four years. While the Soviet Union was collapsing and splitting into new countries, Iraq invaded Kuwait. In January 17 1991, Operation Desert Storm was launched. Both the Iraqi and Kuwaiti oil productions were halted, but that very day, the price of the West Texas Intermediate lost one third of its value, and finished at 21$/b, i.e. a level typical of the 1980s and 1990s. Figure 4: Evolution of world oil exports, distributed between oil-exporting countries, and of the oil price ($2011, West Texas Intermediate spot price) since 1986. Economic crises are shown, with those of 1991 and 2008 related to an oil shock. We may wonder why it is possible that the oil price has settled at such lows, given that the oil markets were simultaneously suffering two blows that have wiped out the equivalent of 12% of world exports. It is clear that the markets were confident that a successful resolution of the conflict with Iraq would happen soon, and that the release of the IEA strategic oil reserves helped significantly. But a sufficient excess capacity to dampen such events was likely the most critical factor. The loss of Iraqi and Kuwaiti oil exports and the breakup of the Soviet Union are clearly seen in Figure 4 (most of the USSR contribution, in orange until 1991, is displayed as Russian in the following years, in blue). Despite these events, world exports did not suffer much because Saudi Arabia, Norway, United Arab Emirates (UAE) and others, were able to quickly increase their production to compensate. The ∆ of the rescuing countries was Exports(Mb/d) Oilprice,WTI($/b)
  • 8. positive, and exports increased in higher proportions than production did. In total, world exports only dropped by 2%, and this drop has probably something to do more with the economic recession that followed the shock of the invasion of Kuwait in 1990, than with a real lack of oil on international markets, as the low oil prices of 1991 suggest. Since the 1990s, world excess capacity has shrink, and the persistent decline of world exports observed since 2006 is different than the decline of the early 1980s. It started in a context of slowly rising oil prices in the face of a stagnant production. Due to the slow-motion energy crisis and the absence of any strong geopolitical events (at least until the Arab revolutions started at the end of 2010), no particular emergency response of the society to reduce the oil habit has been engaged in oil- importing nations. Hence, the decline of exports is not due to a lack of demand in oil- importing countries (though it eventually leads to demand destruction via increases of oil prices); it is instead driven by a strong demand in oil-exporting countries. World oil production and auto-consumption are displayed in Figure 5. Auto- consumption is consumption by oil producers of oil that they themselves produce. Auto-consumption is significant, now representing 50% of world production. The export-to-production ratio is thus also 50%. Since the bottom of the exports slump in 1985s, the export-to-production ratio increased from 40% to a maximum of about 55% at the end of the 1990s. In these years, world exports thus expanded faster than world production did. Then, the export-to-production ratio plateaued for about 10 years and started a slow decline in 2006. Since then, exports are evolving more poorly than production, and because production is almost flat, exports are also declining since 2006. Figure 5, left: Evolution of world oil production and auto-consumption of oil producers. Note the drop of consumption associated to the breakup of Soviet Union in 1991. Right: Evolution of oil production, oil exports, and the export-to- production ratio for the worlda . Phases I and II have been represented. a: Production and exports are relative to the production at the peak date. They are expressed in terms of percentage, as well as the export-to-production ratio. 0 20 40 60 80 100 1980 1990 2000 2010 Oilvolumes(Mb/d) Time (years) 0 20 40 60 80 100 1980 1990 2000 2010 Relativescale Time (Year) III Production
  • 9. The performance of exports with respect to production since the end of the counter oil-shock is better appreciated by following the evolution of ∆ (Figure 6). A clear trend is visible, punctuated by strong fluctuations related to changes in the fundamentals of the economy. Exports perform poorly with respect to production when the world economic environment is weak, as demand weakens in oil-importing countries. These drops of ∆ are associated with declines in oil prices on international markets, as seen after the crises of 1991, 1998, 2001, and 2008. Such dynamics were also present during the counter oil-shock of the early 1980s, but at that time, ∆ dropped deeply several years in a raw, while later the drops were temporary and shallow. When the economy recovered, ∆ rebounded. In 1992, the rebound was especially strong, likely helped by the return of Kuwait on international markets. Despite these ups and downs, for almost 30 years ∆ has followed a trend as described by the theoretical model, slowly eroding from positive to negative territory. The crossing has spanned several years, with ∆ going back and forth below and above zero between the end of the 1990s and 2006 (this period corresponds to the plateau of the export-to-production ratio). These results suggest that the deterioration of the fundamentals is a long term dynamics, and that the world is already in phase II. A good correspondence between the model and what is observed is particularly worrisome, as the model expects that the fall of ∆, and of oil exports in fine, accelerates with time if no drastic adjustments of energy policies occur in oil exporting countries. Figure 6: Evolution of the difference ∆ between the growth rate of oil exports (rexp) and the growth rate of oil production (rprod) for the world. Evolution of the oil price ($2011, West Texas Intermediate spot price). Economic crises are shown, with those of 1991 and 2008 related to an oil shock. Oilprice(2011$) Differencebetweenthegrowthrateofoilexports andthegrowthrateofoilproduction(%) 10 30 50 70 90 110 130 150 1986 1991 1996 2001 2006 2011 -6 -4 -2 0 2 4 6 8 10
  • 10. Apparently no rescue from the MENA countries, nor from Russia. In 2011, the MENA (Middle East and North Africa) countries have contributed to half the global oil exports, and eight of the twelve OPEC members are from MENA. Their evolution is thus especially critical for the world. However, all indicators of the region are deteriorating and performing more poorly than at the world level. Production is on a plateau since 2005 (Figure 7). The export-to-production ratio is declining since 1990, i.e. earlier than for the world, and it is now lower than the minimum reached in 1985. The evolution is not promising, as shown by ∆, which is more and more in the red. As a result, export started their decline in 2006, and this decline thus contributes significantly to the decline of global oil exports observed since 2006. Again, these observations justify concerns about the ability of the region to fulfill the future oil demand of the world, especially that its role is expected to grow in the future due to the peaking and decline of oil production in many non-opec countries. Figure 7, left: Evolution of oil production and auto-consumption of countries from Middle East and North Africa (MENA). Right: Evolution of oil production, oil exports, and the export-to-production ratio for MENA countriesa . Phases I to III have been represented. Bottom: Difference ∆ between the export growth rate (rexp) and the production growth rate (rprod), for MENA countries. a: Production and exports are relative to the production at the peak date. They are expressed in terms of percentage, as well as the export-to-production ratio. 0 5 10 15 20 25 30 35 1980 1990 2000 2010 OilVolume(Mb/d) 0 20 40 60 80 100 1980 1990 2000 2010 Relativescale -4 -3 -2 -1 0 1 2 3 ∆∆∆∆(%) 1985 1990 1995 2000 2005 2010 counter oil shock III Production Production
  • 11. Alongside MENA countries, Russia is a significant oil player, occupying the second place as an oil exporter, not far behind Saudi Arabia (Figure 4). Russia has also played a very prominent role in raising global oil exports in the early 2000s. After the collapse of Soviet Union, both oil production and consumption declined precipitously, but especially consumption, which dropped by about 45% in six years (Figure 8). Then, at the end of the 1990s, production recovered quickly, but consumption was slow to increase. The result was a quick and large increase in Russian oil exports. Between 1998 and 2004, Russia has increased its exports by 2,9 Mb/d, which represents 65% of the rise of global oil exports observed during the period. But Russia will not repeat this achievement in the future. Production has not much room for growth, while consumption does grow (by an average of 2.5%/y in the last five years). As a result, Russia entered in phase II in 2008, and its exports are now plateauing. The evolution of ∆ shows the long term deterioration of the performance of exports with respect to production (Figure 8). Figure 8: Russia: left: Evolution of oil production and auto-consumption. Right: Evolution of oil production, oil exports, and the export-to-production ratioa . Phases I and II have been represented. Bottom: Difference between the export growth rate (rexp) and the production growth rate (rprod). a: Production and exports are relative to the production at the peak date. They are expressed in terms of percentage, as well as the export-to-production ratio. 0 2 4 6 8 10 12 1992 1996 2000 2004 2008 Production(Mb/d) Year 0 20 40 60 80 100 1992 1996 2000 2004 2008 Relatvescale Year -5 0 5 10 rexp-rprod(%) Year I II 1993 1998 2003 2008 2010 Exports
  • 12. If MENA countries and Russia both continue deteriorating, the evolution of global oil exports will also likely continue deteriorating. The exportations of several other exporters are also evolving poorly, and we may wonder to which extent new exporters such as Chad and Brasil can attenuate the losses observed elsewhere. What does attenuate those losses, however, is the rejuvenation of oil production in the US, which implies less import from the biggest oil importer in the world. With declining global oil exports, someone has to consume less, and economic crises are another mechanism that decreases oil imports. This effect has been at work in occidental countries since 2008. It is then a matter of debate whether these demand destructions are what is required to balance oil exports and imports, some studies claiming that high oil prices are one of the factors responsible of the crises that occidental countries suffer since oil prices are in triple digits (Sankey et al., 2010; Hamilton, 2009a,b). Economic growth eating up oil export capacities Vietnam, Indonesia, and the MENA countries powerfully illustrate the effects of domestic consumption on the level of oil exports. Though these exports are critical to balance their fiscal and current account budgets, oil-exporting countries have generally much difficulty to avoid their exports disappearing under the burden of their own consumption. One driver of energy consumption is economic growth, and no government is willing to cool down economic growth. Energy is necessary to any activity, and the growth rate of GDP, rGDP, can be expressed as a function of the growth rate of the economic intensity of energy, rEIE, and the growth rate of energy consumption rE: ‫ݎ‬ீ஽௉ = ‫ݎ‬ாூா + ‫ݎ‬ா + ‫ݎ‬ாூா × ‫ݎ‬ா Eq. 1 The “Economic intensity of Energy” is the amount of GDP produced per unit of energy consumed. For small rE an rEIE (<10%/y if we deal with annual rates), the last term of Eq.1 can be neglected, and this approximation leads to the following expression: ‫ݎ‬ீ஽௉ ~ ‫ݎ‬ாூா + ‫ݎ‬ா Eq. 2 It is rather intuitive that building one more hotel in Dubai, or sending one more sms from Riyadh to Jeddah is made possible thanks to extra energy consumption. The value of these goods and services, added to many others, are used to calculate GDP. Thus, an economy increases its energy consumption as it grows. However, the efficiency at which an economy uses energy to produce wealth evolves with time. This can be due to technological and social factors, or because the contribution of the economic sectors to the economy changes with time. As a result, the growth rate of the economy is not strictly equal to the growth rate of energy consumption. Eq. 2 reflects these aspects. Though the economic efficiency of energy evolves with time, improvements are
  • 13. generally slow, especially if they are technological, partly because it means investments, for instance in more efficient energy convertors in factories, transportation, households, and these investments are costly and are amortized over years. Hence, in the last 30 years, EIE has grown worldwide by about 1.5%/y1 . The United States beat the average (+2.0%/y)2 , but the MENA countries evolved in almost inverse proportion to the US (-1.4%/y). This poor performance (see Figure 9) means that the MENA countries consumed more and more energy to produce a given amount of GDP. Though most of the deterioration of EIE has occurred in the 1980s, nowadays there is still no signal that EIE is on track to improve. Figure 9: Annual growth rates of economic intensity of energy (rEIE), of primary energy consumption (rE), and the product of both rates (rEIE x rE), from 1981 to 2009, for the MENA countries and the US. The sum of the three rates is equal to the annual growth rate of GDP. 1 The EIE growth rates of the world and MENA countries have been calculated using Eq.1, GDP growth rate in constant prices from IMF, World Economic Outlook, April 2012, and total primary energy consumption data from EIA. 2 The EIE growth rates of the US have been calculated using Eq.1, GDP in constant prices from the US bureau of Economic Analysis, and total primary energy consumption data from EIA. -10 -5 0 5 10 15 Annualgrowthrate(%/y) rEIE rE rEIE x rE 1985 1990 1995 2000 2005 United States -10 -5 0 5 10 15 Annualgrowthrate(%/y) rEIE rE rEIE x rE MENA countries 1985 1990 1995 2000 2005
  • 14. Due to a deteriorating EIE, in the last 30 years, energy consumption of MENA countries grew faster (5.1%/y) than the economy (3.3%/y). Most of this energy is oil and gas (Figure 10), oil growing at a slower pace (4.1%/y) than natural gas (7.2%/y) (EIA, 2012). Nowadays, such high rates are still prevailing, and if left unchanged – the IMF forecasts average economic growth of about 4%/y in the next five years (IMF, 2012), it means that oil consumption of MENA countries will double in only 18 years. Because less than two doubling of oil consumption would totally consume oil production from the region, leaving no exports, the amplitude of the challenge facing both oil-exporting and oil-importing countries is huge. Figure 10: Annual growth rates of oil and gas consumption in Middle East and North Africa countries. It is striking that the high oil prices environment that built up since 2004 did not slowed down the growth rate of oil consumption in MENA countries. On the contrary, it accelerated it (4.3%/y on average, against 3.3%/y in the 1990s3 ). This is likely because the massive inflow of petrodollars stimulates other energy intensive sectors of the economy, such as construction and petrochemistry, and encourages lifestyles that are more energy intensive, based on air-conditioning and the acquisition of cars, in markets where car ownership has significant margins for growth. The second reason behind the boom of oil consumption in an environment of triple digit oil prices on international markets, is that the consumers have no incentive to cut back on consumption; they are rather immune to high oil prices because in their country, fuels are generally sold well below international standards (Figure 11) (The World Bank, 2012). In Iran for instance, gasoline costs less than 25$/b while it is almost 300$/b in the euro area. 3 Averages based on EIA total petroleum consumption data from 2004 to 2009, and from 1989 to 1999. -10 -5 0 5 10 15 20 25 Annualgrowthrate(%/y) natural gas oil
  • 15. Figure 11: Average 2010 price of gasoline (in $ per barrela ) in some oil exporting countries (black), in some oil producing countries that have switched from the status of oil exporter to oil importer or will do so in the next five years (black and white), and in the US and the euro area (light color). a: The price of gasoline is expressed in $ per barrel, to compare to the international oil price Flows of petrodollars and cheap domestic gas thus contribute to create a feedback mechanism leading to growing oil consumption in oil exporting countries and higher prices on international oil markets: Oil consumption encouraged by cheap fuel As long as an oil-exporting country is self-sufficient to fill its tanks, fuel prices can be maintained by the government well below international standards. This policy is often regarded as a policy of fuel subsidy, though the basis to calculate the size of the subsidy is subject to debate. International bodies such as the IEA and the World Bank use the difference between fuel prices on international markets and domestic fuel prices. OPEC, however, considers that the reference price should be the domestic cost of oil production, not the international price (Fattouh, El-Katiri, 2012). From this point of view, if a national oil company extracts, refines, and sells oil 0 50 100 150 200 250 300 Priceofgasoline($/b,2010) Price increase on international oil markets Higher earnings for oil exporting countries Higher economic growth Higher oil consumption Less oil exports
  • 16. below international prices, but above its cost, the company is still profitable, and such policy does not have to be considered as a subsidy. Only an opportunity to earn more is lost. This is true as long as the country is self-sufficient. Once it has to import fuel from international markets, the lost opportunity becomes a real loss and a policy of cheap fuel becomes unsustainable for the government budget. This is clearly what forced the Indonesian government to engage in reforms to gradually increase fuel prices towards international standards when it was realized that the country was losing its exports. However, it was (and still is) a long struggle, as such reforms have to be carefully crafted and explained to be successful. Many reforms faced public resistance and were rolled back several times, even though they have been accompanied by compensation programs to reduce the impact on low-income households. An OECD report lists policy changes to domestic energy prices since 1998. But it is mainly after the country has become oil importer that large changes occurred. In 2005, fuel subsidies were eliminated for large industrial consumers, the price of diesel more than doubled, and that of kerosene, used for cooking by many poor households, nearly tripled. In 2008, the government announced a plan to remove subsidies for all vehicles excluding motorcycles and public transportation vehicles by 2014, and increased gasoline and diesel prices by 29% in May 2008, and LPG prices by 23% in July. In December, however, the government erased part of the hike on gasoline and diesel due to the drop of international oil prices. These measures are examples of measures that were passed in the last ten years. As a result, the gasoline price is today on a par with that in the United States (Figure 11). The adjustments are still ongoing and the results on domestic consumption, though visible (Figure 2), are clearly insufficient and unable to restore Indonesia in its former status of oil exporter. Up to now, these measures only slowed down the growth of oil consumption; oil consumption declined in the two years following the 2005 adjustment, but then rebounded, and exceeded the 2005 level in 2008. Focus on Saudi Arabia Saudi Arabia is the first oil exporter in the world, and is still regarded by many as the only country remaining as a swing producer able to dampen geopolitical shocks and to maintain some oil price stability. However, the degradation of the parameters of the MENA countries reflects in large part the degradation of the Saudi parameters. With a population growing rapidly, and high unemployment, economic growth is mandatory, but this, in turn, fuels energy consumption. The current energy consumption of Saudi Arabia is growing at twice the rate of GDP growth, meaning that the EIE of the country is deteriorating. Even the non-oil sector GDP, less affected by the price of oil on international markets than total GDP, does not perform well either (Lahn, Stevens 2011). Energy used in the country is mainly oil and gas, both domestic energies cheap to produce. Cheap prices provide strong incentives for both domestic and international petrochemical industries to develop in Saudi Arabia, with nowadays about 17% of
  • 17. the total oil and gas consumption used as industrial feedstock. Water desalination also requires much energy, and this sector is projected to grow in the future. But electricity producers are on top of the heaviest consumers, with the result that the entire domestic production of natural gas is consumed locally. And due to the reluctance of the country to import additional quantities of natural gas, shortages have appeared in the last decades, especially upon peak power demands in the summer month, for air-conditioning. Natural gas shortages prompted some substitution from gas to oil to feed petrochemical and power plants, thus reversing a four decades decline in the share of oil in the mix of primary energy consumption. The Saudi authorities are aware that this strong growth of electricity demand is threatening their hydrocarbon-based economy, and they have plans to produce electricity using nuclear energy, concentrated solar energy, photovoltaic, and wind power. But the scale of the task (more than doubling the current power production by 2030) and international political hurdle to massively deploy nuclear power in Saudi Arabia does not bode well for the future of oil exports (Lahn, Stevens 2011). According to a study from Chatham House, on a “business as usual” trajectory, even if Saudi Arabia is able to sustain a production above 12 Mb/d, the country would become a net oil importer by 2038, and due to its high dependence on oil revenue, its economy would collapse before that point, with deficits appearing in its fiscal and current accounts as early as 2023 (Lahn, Stevens 2011). The state of these accounts not only depends on volume exported, but also on the price of oil on international markets. And with budgetary needs that increase with time, the price that Saudi Arabia considers fair tends to rise over time: it was $35/b in 2004-05, $70-80/b in 2010-11, and now, the Institute of International finance estimates that oil has to be above $88/b to maintain the 2011 budget in positive territory (Lahn, Stevens 2011). This increase is in large part due to the vast sum of money that the government injected to appease the population during the Arab Spring, about $37bn, which correspond to add $14/b on the price of oil exports for 2010. Much of this extra spending is permanent, for instance in the form of pay raises for the state employees. But before Saudi Arabia becomes oil importer – but from where could it import oil? – we have to contemplate the long decline of its exports. The oil exports of Saudi Arabia have already declined by 8.5% between 2005 to 2011, while production increased by 0.5%. Chatham House estimates that current consumption trends could deprive the world market of up to 2 mb/d by 2020 compared with the IEA’s supply scenario (Lahn, Stevens 2011). In 2010, Khalid A. Al-Falih, President of the national oil company, Saudi Aramco, said that an additional 1 mb/d of crude export capacity would disappear by 2028 if the evolution of the domestic energy consumption does not change. Exports would then drop below 7 mb/d. This represents a drop of 16% with respect to the 2011 export level, but this also means that more than the entire production growth that is expected in the future will be used for domestic consumption. With these developments, if Saudi Arabia is urged to maintain exports as high as possible to supply the markets, the country could be forced to run at full capacity in the very near future. The disappearance of its excess capacity will undoubtedly translate in more volatile oil prices.
  • 18. Countries of the Arab spring: oil exports are gone The evolutions observed in Saudi Arabia are also occurring in many oil exporting nations. Benefiting from high oil prices, oil exporters have generally grown faster than their oil importing neighbors in 2011, but have vulnerabilities similar to those of Saudi Arabia. For some, the problem posed by a rising consumption is compounded by a declining production. While Saudi Arabia is still in phase II, they are in phase III and have already been forced to change their policies of fuel prices and policies in other economic domains. Mitchell and Stevens (2008) have defined three moments of economic development of oil-exporting countries, which roughly correspond to the three phases of the oil age that we have defined. Phase I corresponds to the depletion-led development: production and export rise, and oil revenues accelerate the country development by financing the fiscal and foreign exchange deficits of the non-hydrocarbon sectors. Phase II corresponds to the transition: production stalls, exports start falling, and the country must begin reducing its reliance on the hydrocarbon sector to support economic growth. This means less expenditure, higher taxes, higher fuel prices, lower imports or higher exports in the non-hydrocarbon sectors. Phase III corresponds to unsustainable dependence of the country’s economy to the hydrocarbon sector: the need for alternatives accelerates, not only to maintain growth but to prevent economic decline. As already discussed, many of those changes are politically risky, notably those affecting fuel prices, because cheap energy is part of the social contract. When Indonesia was forced to adapt its policy of fuel prices due to the disappearing of its oil exports, demonstrations and riots occurred in the country, those of 1998 having precipitated the downfall of Suharto. Little incentive thus exists to preventively revise policies to address the issue of energy prices. And, when they are finally adjusted, it is generally late in the process of disappearing oil exports, when the economic and social environment is more difficult. Though Saudi oil exports have declined in the last few years, the Saudi authorities have mainly focused on the supply side of the problem, by envisaging alternative energies to save oil for exportation, but they were reluctant to address the demand side of the problem. Being one of the cheapest countries in the world for transport fuel, Saudi Arabia even lowered the price when oil was at triple digit prices to content its population. And in a moment of high domestic tensions in the region, the Saudis are more encouraged than ever to promote such economic concessions. Other MENA countries were less fortunate than Saudi Arabia, being in phase III or having already left phase III. At the end of 2010, a revolutionary wave of protests called the Arab Spring set ablaze several Arab countries. Regime were toppled in Tunisia, Libya, Egypt and Yemen, civil uprisings occurred in Bahrain and Syria. With the exception of Libya, all of these countries have recently lost their oil exports, or will lose them in the next few years. Tunisia has become oil importer in 2000, Egypt in 2008, and Bahrain in 2010. And at the onset of the Arab Spring, Yemen and Syria were expected to start importing oil in about 5 years. The revolution, however,
  • 19. accelerated the decline of their oil exports. This is clearly seen in Figure 12: the last dot of the production and export curves of Yemen and Syria deviates significantly from the trend. A rebound of oil exports could thus happen in Yemen and Syria in the next few years if the political situation appeases, but this rebound will likely be temporary. Figure 12 also show that it took between 10 and 30 years for oil exports to disappear completely since their peak, while in the same time, production has far less declined: by less than 20% to more than 60%. Figure 12: Evolution of exports (left) and production (right), and number of years since “peak exports” for Bahrain, Egypt, Syria, Tunisia, and Yemen. The year when exports have peaked, the value of exports and production has been set to 100, allowing to follow their evolution in terms of percentage. -•- Bahrain -•- Egypt -♦- Syria -ο- Tunisia -♦- Yemen To have a clear evaluation of the role played by the loss of oil exports on the political, social, and economic conditions that led to the Arab Spring, a careful analysis of data and events accumulated on several years must be done for each country, as oil can have different weights in their economies. However, impacts on budgets due to fuel subsidies and lost revenues, higher fuel prices than in other oil exporting countries (notably Syria and Tunisia, Figure 11), and the loss of a mean to appease social protests that confer petrodollars – a tool used by Saudi Arabia, Kuwait, Oman and others during the Arab Spring – likely played a role. In the past few years, several studies had already pointed difficulties associated to the disappearance of oil exports, even for countries like Yemen and Syria, which were still exporting significant amounts of oil when they were hit by the wave of protests. For Yemen, an IMF document of 2010 indicates that the past few years have been exceptionally difficult for the economy (IMF, 2010). With the collapse of international oil prices in late 2008, and a declining oil production only partially offset by the production of liquefied natural gas that started in 2009, the country’s oil revenues have declined. Combined to large energy subsidies, the loss of oil revenue had a strong negative impact on public finances and the balance of payments. As oil revenues account for about 60 percent of government revenues and over 90 percent of export revenues, the loss of oil exports will have a significant impact on the economy. The complete disappearance of oil exports is expected by 2016, in the absence of new oil discoveries. 0 20 40 60 80 100 120 0 10 20 30 40 RelativeOilexports(%) Years 0 20 40 60 80 100 120 0 10 20 30 40 RelativeOilProduction(%) Years
  • 20. For Syria, much of gasoil and diesel have to be imported due to insufficient refining capacity (EIA, 2011a). But because crude oil exports are in decline and imported refined products cost more than crude oil, the net value of Syria's oil exports and imports has strongly deteriorated. Between 2006 and 2008, the balance dropped from a positive value of $1.9 billion to a negative value of $100 million. Syria thus announced a long-term plan to phase out the subsidies, but these plans were delayed when the political situation turned sour in 2011. Is Iran next on the list? Iran entered in phase II in the mid-1990s. Since then, oil production has increased by 13%, but this increase has been entirely consumed locally. The export-to- production ratio has declined to less than 60%, and consumption is still rising. A country is more vulnerable to the dynamics of oil consumption when its export-to- production ratio is low. The political and financial situation of Iran could thus change dramatically in the next few years, at the image of the fallen MENA countries, if its economy is forced to a disorderly exit from its hydrocarbon basis. It is a situation both Iran and the international community are likely aware, as it is exactly what the international sanctions are about. Their effect artificially pushes Iran in phase III, where oil exports vanish and the government budget becomes so unsustainable that the Iranian authorities eventually decide to negotiate on their nuclear program. The vulnerability of Iran is aggravated because Iran has limited refinery capacity for the production of light fuels, and consequently imports a sizeable share of its gasoline supply (EIA, 2011b). And as the price of gasoline is heavily subsidized by the government – Iran still maintains one of the cheapest fuels in the world (Figure 11), a small decrease in oil exports has the potential to produce devastative effects on the government budget. The Iranian authorities developed several responses to these risks. In December 2010, the legislature passed the Targeted Subsidies Law to phase out subsidies over a five-year period (CIA, 2012). According to EIA, in 2010, the price that private motorists pay for their monthly quota has been increased fourfold, and the quota allowance at that preferential price has been decreased from 100 to 60 liters per month (EIA, 2011b). The reform generated political opposition because of inflationary fears in the midst of an economic downturn. In addition to reforms affecting the demand side, the supply side (of fuels) has not been neglected neither. Petrochemical plants were converted to produce gasoline as a short-term measure, meanwhile a number of new as well as expansions of existing refineries were programmed. These projects are expected to come online between 2012 and 2017, in which case it is possible that the country will become a gasoline exporter in 2015. Though these measures will certainly help by avoiding wasting money importing refined products, it is far from certain that it will be sufficient to cut back on consumption and to avoid a crunch of oil exports in the medium term.
  • 21. Figure 13: Iran: left: Evolution of oil production and auto-consumption. Right: Evolution of oil production, oil exports, and export-to-production ratioa . Phases I and II have been represented. Bottom: Difference between the export growth rate (rexp) and the production growth rate (rprod). a: Production and exports are relative to the production at the peak date. They are expressed in terms of percentage, as well as the export-to-production ratio. Conclusions In a business-as-usual scenario, for any oil-exporting country, oil production follows a typical pattern comprising a stage of growth, then stabilization with possible temporary rebounds, and finally a terminal decline. On the contrary, consumption leans towards relentless growth. Due to these dynamics, the oil exports-to- production ratio, net exports, and production pass their peak sequentially. Hence, any oil exporting country passing its first peak is warned that the next two peaks will follow and that it must adapt its policies without delay to reduce its economic dependency on hydrocarbons. 0 1 2 3 4 5 1980 1990 2000 2010 Production(Mb/d) Year 0 20 40 60 80 100 1980 1990 2000 2010 Relatvescale Year -10 -5 0 5 10 rexp-rprod(%) Year I II Production Exports
  • 22. When such a sequence is observed for the world, oil-importing countries have also to adapt their policies to reduce their reliance on imported oil, as possibilities to replace failing oil-exporters by emerging oil-exporters become inadequate. For the world, the exports-to-production ratio has already peaked, in 1998, and oil exports have also peaked, in 2005, and have declined by 5.3% (2011). This evolution is likely responsible of the high oil-prices observed since then, as the fall of supply of exported oil must be compensated by an equivalent demand destruction in oil importing countries. Using the difference ∆ between the growth rate of global oil exports (rexp) and the growth rate of global oil production (rprod), we showed that the degradation of the global oil exports is a long term dynamics, and not a temporary phenomenon. Though temporary rebounds can occur, global oil exports will likely continue declining. Indeed, global oil production has not much room to progress, and auto- consumption from oil-exporting countries is difficult to moderate, due to economic growth boosted by high international oil prices, and fuels that are maintained cheap by government intervention. Reversing this evolution would require immense efforts from oil exporters to reduce domestic demand, but the authorities are often reluctant to adopt such unpopular policies, and when they do so, it is often too little and too late. The demise of oil exports has already led to profound social, economic and political consequences for some oil-producing country (Indonesia, several countries engulfed in the Arab Spring). These evolutions, especially the consistent decline of world oil exports observed since 2006, are particularly worrisome and should have prompted oil-importing countries to study carefully these dynamics and consequences, and implement energy policies that reduce oil dependency as fast as possible. Indeed, the decline of oil exports tends to accelerate with time, and a transition is costly and needs much time to produce significant effects. To plan and implement quickly a broad transition to a low oil-society, it is critical to have a better forecast of the future availability of oil. Transparency must improve for oil data, especially reserves, which are unaudited by independent parties in most oil- exporting countries. It is also critical to study the likely consequences that the decline of global oil exports has and will have on the price of oil, as well as the political and economic consequences of the massive transfer of wealth from oil-importing to oil- exporting countries that is allowed by triple digit oil prices. Finally, technical and societal solutions must be implemented quickly to reduce oil consumption and release the grip that high oil prices exert on the economy, before high oil prices kill solutions to oil dependency. Once an economy is hurt, environmental policies, public transportation, subsidies to alternative energies and energy conservation, research and development budgets, can suffer badly. Though high oil prices already affect painfully our societies, the issue of decreasing net oil exports has received very little attention up to now. Most studies still focus on global production, avoiding the fact that much oil is not traded on free markets, and is produced, transformed, and sold locally at prices controlled by the government.
  • 23. References Brown, J.J., Foucher, S., (2010), Peak Oil Versus Peak Exports, ASPO conference BP, (2012), BP Statistical Review of World Energy 2012 CIA, (2012), The World Factbook, Iran EIA, (2011), a: Country Analysis Briefs, Syria; b: Country Analysis Briefs, Iran EIA, (2012), Total petroleum and dry natural gas consumption data from 1980 to 2009 Fattouh, B., El-Katiri L., (2012), United Nations Development Programme, Arab Human Development Report, Energy Subsidies in the Arab World Hamilton J.D., (2009), a: Oil Prices and the Economic Downturn, testimony before the « Joint Economic Committee of the United States Congress »; b: Causes and Consequences of the Oil Shock of 2007-08 », Brookings Papers on Economic Activity, 215-259 IMF, (2010), Republic of Yemen: Request for a Three-Year Arrangement Under the Extended Credit Facility—Staff Report; Press Release on the Executive Board Discussion; and Statement by the Executive Director for Yemen, September 2010 IMF, (2012), World Economic Outlook April 2012 Lahn, G., Stevens, P., (2011), Burning Oil to Keep Cool: The Hidden Energy Crisis in Saudi Arabia, Programme Report, Chatham House Mitchell, J. V., Stevens, P., (2008), Ending Dependence: Hard Choices for Oil- Exporting States, Chatham House Report Sankey P., Clark D. T., Micheloto S. (2010), The End of the Oil Age, 2011 and beyond: a reality check, Deutsche Bank The World Bank, (2012), Pump price for gasoline (US$ per liter); Fuel prices refer to the pump prices of the most widely sold grade of gasoline. Prices have been converted from the local currency to U.S. dollars.