SlideShare une entreprise Scribd logo
1  sur  1
Télécharger pour lire hors ligne
Evaluating Tissue Expression of RANTES With Subtype
                                                          Specific Breast Cancer Biomarkers Found Elevated in Plasma
                                                                                Rachel Gonzalez2, Li Ding2, Bob Melton2, Ming Xiao2, Xiaoping Zhang2, Lutong Zhang3, Zhongdong Liu3,
                                                                                                            Chuanbo Xu3, Alice Li3 and James R Mansfield1.
                                                                           1PerkinElmer, Hopkinton, MA, United States; 2GBI Labs, Mukilteo, WA, United States; 3BioChain Institute, Inc., Hayward, CA, United States.

Abstract                                                                                                         Results                                                                                                                                                     Figure 3
Background: A previous analysis of 23 plasma proteins found that levels increased in cancer patients                                                                                                                                                                         The graphs show increased expression and different subtype of TGFa and VEGF when measured by Vectra Automated Imaging system. In
compared to benign-breast-disease controls when the cancer was analyzed based on tumor subtypes.
                                                                                                                  Figure 1                                                                                                                                                   order to see the pattern of staining, tumors cores were sorted to show expression from least to highest and then graphed. Double negative
Circulating levels of RANTES were significantly increased in cancer patients and were commonly                    Multispectral imaging of double-stained VEGF and TGFa Breast Cancer Tissue Array                                                                           tumors are represented with twice as many samples (red). TGFa was not expressed at all in the benign tissue but was significantly increased in
associated with two or more of the following proteins; amphiregulin, EGF, HB-EGF, TGFa, PDGF, and                                                                                                                                                                            all tumor types.
VEGF in a tumor subtype specific pattern. However, it is unknown if expression of these proteins correlate
in the tumor tissue of breast cancer subtypes thus contributing to the elevated expression seen in plasma.
In this study, we evaluate the expression of 5 of plasma biomarkers in a 70-subject breast cancer tissue
microarray (TMA) to determine if these proteins are increased differentially by tumor subtypes.
Design: BioChain TMA containing 70 duplicated cores covering the common types of breast cancer, 5
normal, and 5 benign cases are assayed using GBI Labs triple stain kits to evaluate subtype specific
expression of amphiregulin and HB-EGF or PDGF and VEGF with RANTES. Imaging and quantitative
assessment of the distribution and intensity of each stain was evaluated using a multispectral imaging
(MSI) approach, automated morphologic analysis software and compared to a visual screen.
Results: Results indicate that an algorithm can be developed to accurately recognize tumor versus stromal
tissue within each core. Furthermore, as compared to visual evaluation, the MSI approach has the added
capability to separate the color of the three immunostains from the triple stain for precise quantification of
each protein without crosstalk. The automated scoring algorithm shows the limitations of visual                                                                                                                                                                              Figure 4          The graphs show that Amphiregulin increased                Figure 5        The graphs show that HB-EGF increased significantly in
assessment. Especially in the case when three proteins are localized in the cytoplasm.                                                                                                                                                                                       significantly only in the ER tumor. In our previous study, Amphiregulin      the ER and Her2+ tumor subtypes which was similar to early stage breast
Conclusion: The knowledge gained from correlating these subtype-specific patterns of tissue antigens with                                                                                                                                                                    increased only in plasma of ER+ tumors. Scored on intensity and              cancer. The plasma samples found HB-EGF increased in plasma of ER+
                                                                                                                                                                                                                                                                             number of positive cells.                                                    and Her2+ tumors. Scored on intensity and number of positive cells.
circulating levels in plasma may provide important information about the contribution of specific markers of
breast cancers. Application of MSI to the triple staining in the TMA screen provided a superior quantitative                                                                                                                                                                      Amphiregulin Expression Pattern In Four Tumor Types                             HB-EGF Expression Pattern in Four Tumor Types
method for evaluation of multiple chromogens linked proteins within a tumor core compared to visual
observations/grading of the complex multicolor immunostaining in this study.

Introduction Sandwich ELISA microarray platform was use to evaluate candidate biomarkers in plasma
samples from women with newly diagnosed breast cancer (Cancer Epidemiol Biomarkers July
2011 20; 1543). In our previous study, the disease data set was compared with plasma samples of women
with benign breast neoplasia. We showed that RANTES significantly increased in women with newly
diagnosed breast cancer independent of breast cancer subtype. However the other biomarker whose
expression changed such as AREG, EGF, HB-EGF, PDGF, RANTES, TGFα, and VEGF did so in breast
disease subtype dependent manner as defined by ER and HER2 expression levels. Studies have shown                                                                                                                                                                            Figure 6 These graphs show that EGF was rarely expressed in any               Figure 7 These graphs show that RANTES was expressed in all               type
that these biomarkers are associated with other diseases, so we can not conclude that the breast tumors                                                                                                                                                                     type of breast tumor epithelial cells. In our previous study, EGF was         of breast tumor epithelial cells. However the ER+ and Her2+ breast tumors
are directly contributing to change noted of these cytokines in the plasma. In this study, our goal is to                                                                                                                                                                   significantly increased in the plasma samples from HER2+ breast tumors.       showed ~30% of the tumors with low expression. It is hard to know if the
evaluate the tumor tissue expression pattern of the plasma biomarkers to see if the tumors expression of                                                                                                                                                                    The question is why did we see significant increase in plasma samples?        tissue results correlates to the plasma study which found RANTES
                                                                                                                       Original Image From Scope       Map =Tumor Red / Normal   Individual Cell Assessment             Yellow is double positive                                                                                                         significantly since the benign cases number was low on the tissue array.
the biomarker correlated with the biomarker expression seen in the plasma of our earlier study. Additionally                                                                                                                                                                The answer may lie in the increase expression of EGF in the tissue
                                                                                                                       VEGF-DAB & TGFa-AP-Red          Green/ Blue Empty Space                                          Green is single positive TGFa                                                                                                     However if the expression pattern seen in this study holds true in larger sent
                                                                                                                                                                                                                                                                            surrounding the tumor as seen in Fig.2 B1 and B2 to the left of this panel.
we evaluated if the expression of multiple biomarkers were expressed in the same tumor cell or not. Using                                                                                                               Red is single positive VEGF                                                                                                       of benign and tumor cases the results would show that RANTES may be
                                                                                                                                                                                                                                                                            One could hypothesize that the tissue surrounding the tumor cells is
BioChain’s Breast Cancer tissue microarray (TMA) which has a good representation of three of the breast                                                                                                                 Blue is double negative                                                                                                           contributed from diseased breast tissue.
                                                                                                                                                                                                                                                                            receiving signals from the tumor.
cancer subtypes (double negative tumors; ER+; and Her2+) and benign/normal breast tissue, we found
that, indeed, the markers were expressed in the tumors; however they did and did not seem to follow the                                                                                         Figure 2                                                                          EGF Expression Pattern In Four Tumor Types                                  RANTES Expression Pattern In Four Tumor Types
pattern found in the earlier study.

                                                                                                                  BioChain -Z7020004 2x70 cores
Methods The 70 case breast cancer TMA was obtained from BioChain Cat# Z7020004. Slides were de-
                                                                                                                  Breast Cancer Tissue Array
waxed in xylene and re-hydrated using graded alcohols then rinsed in tap water. Endogenous peroxidase
was blocked with 3% H2O2 for 10 minutes and washed in several changes of water. If Heat Induced                  Table1 Antibody Source
Epitope Retrieval was required for primary antibody, this step was done with 10mM Citrate buffer pH6.0 for                                                                                                                 A1                                   B1
15 min at 98C with a cool-down to 45C. The double and triple staining procedure is highly dependent on           Antibody Used             Source/Cat#
the primary antibody combination with respect to animal species. Mouse-Rabbit or Mouse-Rabbit-Goat               Gt anti-EGF               SantaCruz/SC-1343
                                                                                                                 Gt anti-HB-EGF            SantaCruz/SC-1414
primary antibody combinations were incubated on the tissue together. Mouse-Mouse-Rabbit or Rabbit-               Ms anti-Ampheregulin      SantaCruz/SC-74501
Rabbit-Mouse primary antibody combinations were stained sequentially according to manufactures                   Ms anti-VEGF              SantaCruz/SC-3462
                                                                                                                                                                                                                                                                              Conclusion: The goal of this study was to observe in tumor tissues the expression of the EGFR ligands in the subtype-
protocols with GBI Triple Stain kits listed in table. Most primary antibody combinations were incubated for      Rb anti RANTES            Abcam /Ab9678                                                                                                                      dependent plasma samples of early-stage breast cancers studied previously. The subtype-dependent tumor tissue expression of
30 minutes at room temperature unless otherwise indicated by primary antibody source. Manual scoring             Rb anti-TGFalpha          Abcam /Ab9585                                                                   A2                                   B2            AREG, HB-EGF and TGFa results mirrored the plasma-expression patterns for these EGFR ligands. RANTES was found to be
                                                                                                                 Rb anti-PDGF              SantaCruz/SC-128                                                                                                                   significantly increased in the four major types of breast cancer, but not the benign set. However, the number of benign samples (5
using Olympus BX40 Light microscope was assessed on total percent positive cells and intensity of stain.
Each core of the TMA was imaged multispectrally using a Vectra® Automated Imaging System.                        Mult-Stained Kits         Source/Cat#
                                                                                                                                                                                             Fig.2 Image A1 and A2 are from tissue array stained with Ms anti-AREG and        total) is to small to conclude that RANTES is increased in all breast tumors; however there is literature to support the findings in
Multispectral images were unmixed using spectral signatures developed from singly stained control                Mouse, Rabbit             GBI Labs/DS201                                    Goat anti-HB-EGF. In A1 you see strong expression of both Amphiregulin-DAB       this study. For RANTES, the double-negative breast tumors showed the most significant increase in RANTES expression within
                                                                                                                                                                                             and HB-EGF-AP Red. In A2 AREG is expressed but much less of HB-EGF is
samples. The unmixed images were analyzed using inForm® Tissue Finder, which was trained to                      Rabbit,Mouse, Mouse       GBI Labs/TS301                                    expressed. Images B1 and B2 are from tissue arrays stained with Ms anti-ER
                                                                                                                                                                                                                                                                              the tumor group when comparing the number of tumors that are not expressing RANTES to those that are expressing RANTES. It
automatically find tumor regions. Within the tumor regions, cell segmentation was performed, and each            Rabbit, Rabbit, Mouse     GBI Labs/TS302
                                                                                                                                                                                             DAB , Rb anti-RANTES AP-Red, and Gt anti-EGF Emerald . B1 shows                  was rare to see EGF in the tumor epithelial cytoplasm, but we did see significant increase in the stroma surrounding the tumor, as
marker scored for positive/negative according to a manually selected intensity threshold. Double positivity                                                      Vectra® Automated           expression of all three proteins, B2 is an ER negative tumor showing             seen in fig 2B1 and 2B2. Our future goal is to evaluate the expression of the EGF in the stroma using the Vectra Automated
                                                                                                                 Mouse, Rabbit, Goat       GBI Labs/TS303        Imaging System              expression of RANTES and EGF. The EGF was rarely detected in the tumor
scoring was also performed.                                                                                                                                                                  cells but was often increased in the surrounding stromal cells of the tumor.     Imaging system to see if truly the expression the EGF is altered in the stroma in a subtype-specific manner..

Contenu connexe

Plus de PerkinElmer, Inc.

GCMS Portátil: Análises em 5 minutos!
GCMS Portátil: Análises em 5 minutos!GCMS Portátil: Análises em 5 minutos!
GCMS Portátil: Análises em 5 minutos!PerkinElmer, Inc.
 
Nós transformamos complexidade em simplicidade
Nós transformamos complexidade em simplicidadeNós transformamos complexidade em simplicidade
Nós transformamos complexidade em simplicidadePerkinElmer, Inc.
 
Janus G3: Rapidez e Automação que você precisa.
Janus G3: Rapidez e Automação que você precisa.Janus G3: Rapidez e Automação que você precisa.
Janus G3: Rapidez e Automação que você precisa.PerkinElmer, Inc.
 
Como a PerkinElmer contribui para diagnósticos mais rápidos?
Como a PerkinElmer contribui para diagnósticos mais rápidos?Como a PerkinElmer contribui para diagnósticos mais rápidos?
Como a PerkinElmer contribui para diagnósticos mais rápidos?PerkinElmer, Inc.
 
Como a PerkinElmer contribui para diagnósticos mais rápidos?
Como a PerkinElmer contribui para diagnósticos mais rápidos?Como a PerkinElmer contribui para diagnósticos mais rápidos?
Como a PerkinElmer contribui para diagnósticos mais rápidos?PerkinElmer, Inc.
 
O Mercado da Carne no Brasil
O Mercado da Carne no BrasilO Mercado da Carne no Brasil
O Mercado da Carne no BrasilPerkinElmer, Inc.
 
KITS de Preparo para Biblioteca NGS
KITS de Preparo para Biblioteca NGSKITS de Preparo para Biblioteca NGS
KITS de Preparo para Biblioteca NGSPerkinElmer, Inc.
 
Escolha um parceiro e não um fornecedor
Escolha um parceiro e não um fornecedorEscolha um parceiro e não um fornecedor
Escolha um parceiro e não um fornecedorPerkinElmer, Inc.
 
Eletroforese Capilar Automatizada
Eletroforese Capilar Automatizada Eletroforese Capilar Automatizada
Eletroforese Capilar Automatizada PerkinElmer, Inc.
 
Analysis of Trace Elements in Fertilizer with AVIO 200 ICP-OES
Analysis of Trace Elements in Fertilizer with AVIO 200 ICP-OESAnalysis of Trace Elements in Fertilizer with AVIO 200 ICP-OES
Analysis of Trace Elements in Fertilizer with AVIO 200 ICP-OESPerkinElmer, Inc.
 
Analysis of Impurities in Semiconductor-Grade Hydrochloric Acid with the NexI...
Analysis of Impurities in Semiconductor-Grade Hydrochloric Acid with the NexI...Analysis of Impurities in Semiconductor-Grade Hydrochloric Acid with the NexI...
Analysis of Impurities in Semiconductor-Grade Hydrochloric Acid with the NexI...PerkinElmer, Inc.
 
New Research Evaluating Cisplatin Uptake in Ovarian Cancer Cells by Single Ce...
New Research Evaluating Cisplatin Uptake in Ovarian Cancer Cells by Single Ce...New Research Evaluating Cisplatin Uptake in Ovarian Cancer Cells by Single Ce...
New Research Evaluating Cisplatin Uptake in Ovarian Cancer Cells by Single Ce...PerkinElmer, Inc.
 
High Quality DNA Isolation Suitable for Ultra Rapid Sequencing
High Quality DNA Isolation Suitable for Ultra Rapid SequencingHigh Quality DNA Isolation Suitable for Ultra Rapid Sequencing
High Quality DNA Isolation Suitable for Ultra Rapid SequencingPerkinElmer, Inc.
 
Analysis of In-Service Oils Following ASTM D5185 with the Avio 200 ICP-OES
Analysis of In-Service Oils Following ASTM D5185 with the Avio 200 ICP-OESAnalysis of In-Service Oils Following ASTM D5185 with the Avio 200 ICP-OES
Analysis of In-Service Oils Following ASTM D5185 with the Avio 200 ICP-OESPerkinElmer, Inc.
 
Analysis of Oil Additives Following ASTM D4951 with the Avio 200 ICP-OES
Analysis of Oil Additives Following ASTM D4951 with the Avio 200 ICP-OESAnalysis of Oil Additives Following ASTM D4951 with the Avio 200 ICP-OES
Analysis of Oil Additives Following ASTM D4951 with the Avio 200 ICP-OESPerkinElmer, Inc.
 
A Comparison of Microsecond vs. Millisecond Dwell Times on Particle Number Co...
A Comparison of Microsecond vs. Millisecond Dwell Times on Particle Number Co...A Comparison of Microsecond vs. Millisecond Dwell Times on Particle Number Co...
A Comparison of Microsecond vs. Millisecond Dwell Times on Particle Number Co...PerkinElmer, Inc.
 

Plus de PerkinElmer, Inc. (20)

GCMS Portátil: Análises em 5 minutos!
GCMS Portátil: Análises em 5 minutos!GCMS Portátil: Análises em 5 minutos!
GCMS Portátil: Análises em 5 minutos!
 
Nós transformamos complexidade em simplicidade
Nós transformamos complexidade em simplicidadeNós transformamos complexidade em simplicidade
Nós transformamos complexidade em simplicidade
 
Janus G3: Rapidez e Automação que você precisa.
Janus G3: Rapidez e Automação que você precisa.Janus G3: Rapidez e Automação que você precisa.
Janus G3: Rapidez e Automação que você precisa.
 
Como a PerkinElmer contribui para diagnósticos mais rápidos?
Como a PerkinElmer contribui para diagnósticos mais rápidos?Como a PerkinElmer contribui para diagnósticos mais rápidos?
Como a PerkinElmer contribui para diagnósticos mais rápidos?
 
Como a PerkinElmer contribui para diagnósticos mais rápidos?
Como a PerkinElmer contribui para diagnósticos mais rápidos?Como a PerkinElmer contribui para diagnósticos mais rápidos?
Como a PerkinElmer contribui para diagnósticos mais rápidos?
 
Aspirina Vs Pré Eclampsia
Aspirina Vs Pré Eclampsia Aspirina Vs Pré Eclampsia
Aspirina Vs Pré Eclampsia
 
O Mercado da Carne no Brasil
O Mercado da Carne no BrasilO Mercado da Carne no Brasil
O Mercado da Carne no Brasil
 
KITS de Preparo para Biblioteca NGS
KITS de Preparo para Biblioteca NGSKITS de Preparo para Biblioteca NGS
KITS de Preparo para Biblioteca NGS
 
O que é X Frágil?
O que é X Frágil?O que é X Frágil?
O que é X Frágil?
 
Escolha um parceiro e não um fornecedor
Escolha um parceiro e não um fornecedorEscolha um parceiro e não um fornecedor
Escolha um parceiro e não um fornecedor
 
Eletroforese Capilar Automatizada
Eletroforese Capilar Automatizada Eletroforese Capilar Automatizada
Eletroforese Capilar Automatizada
 
Analysis of Trace Elements in Fertilizer with AVIO 200 ICP-OES
Analysis of Trace Elements in Fertilizer with AVIO 200 ICP-OESAnalysis of Trace Elements in Fertilizer with AVIO 200 ICP-OES
Analysis of Trace Elements in Fertilizer with AVIO 200 ICP-OES
 
Analysis of Impurities in Semiconductor-Grade Hydrochloric Acid with the NexI...
Analysis of Impurities in Semiconductor-Grade Hydrochloric Acid with the NexI...Analysis of Impurities in Semiconductor-Grade Hydrochloric Acid with the NexI...
Analysis of Impurities in Semiconductor-Grade Hydrochloric Acid with the NexI...
 
New Research Evaluating Cisplatin Uptake in Ovarian Cancer Cells by Single Ce...
New Research Evaluating Cisplatin Uptake in Ovarian Cancer Cells by Single Ce...New Research Evaluating Cisplatin Uptake in Ovarian Cancer Cells by Single Ce...
New Research Evaluating Cisplatin Uptake in Ovarian Cancer Cells by Single Ce...
 
CG Clarus® All In One
CG Clarus® All In OneCG Clarus® All In One
CG Clarus® All In One
 
High Quality DNA Isolation Suitable for Ultra Rapid Sequencing
High Quality DNA Isolation Suitable for Ultra Rapid SequencingHigh Quality DNA Isolation Suitable for Ultra Rapid Sequencing
High Quality DNA Isolation Suitable for Ultra Rapid Sequencing
 
XXI Encontro de Genética
XXI Encontro de GenéticaXXI Encontro de Genética
XXI Encontro de Genética
 
Analysis of In-Service Oils Following ASTM D5185 with the Avio 200 ICP-OES
Analysis of In-Service Oils Following ASTM D5185 with the Avio 200 ICP-OESAnalysis of In-Service Oils Following ASTM D5185 with the Avio 200 ICP-OES
Analysis of In-Service Oils Following ASTM D5185 with the Avio 200 ICP-OES
 
Analysis of Oil Additives Following ASTM D4951 with the Avio 200 ICP-OES
Analysis of Oil Additives Following ASTM D4951 with the Avio 200 ICP-OESAnalysis of Oil Additives Following ASTM D4951 with the Avio 200 ICP-OES
Analysis of Oil Additives Following ASTM D4951 with the Avio 200 ICP-OES
 
A Comparison of Microsecond vs. Millisecond Dwell Times on Particle Number Co...
A Comparison of Microsecond vs. Millisecond Dwell Times on Particle Number Co...A Comparison of Microsecond vs. Millisecond Dwell Times on Particle Number Co...
A Comparison of Microsecond vs. Millisecond Dwell Times on Particle Number Co...
 

Dernier

call girls in green park DELHI 🔝 >༒9540349809 🔝 genuine Escort Service 🔝✔️✔️
call girls in green park  DELHI 🔝 >༒9540349809 🔝 genuine Escort Service 🔝✔️✔️call girls in green park  DELHI 🔝 >༒9540349809 🔝 genuine Escort Service 🔝✔️✔️
call girls in green park DELHI 🔝 >༒9540349809 🔝 genuine Escort Service 🔝✔️✔️saminamagar
 
call girls in Dwarka Sector 21 Metro DELHI 🔝 >༒9540349809 🔝 genuine Escort Se...
call girls in Dwarka Sector 21 Metro DELHI 🔝 >༒9540349809 🔝 genuine Escort Se...call girls in Dwarka Sector 21 Metro DELHI 🔝 >༒9540349809 🔝 genuine Escort Se...
call girls in Dwarka Sector 21 Metro DELHI 🔝 >༒9540349809 🔝 genuine Escort Se...saminamagar
 
PULMONARY EMBOLISM AND ITS MANAGEMENTS.pdf
PULMONARY EMBOLISM AND ITS MANAGEMENTS.pdfPULMONARY EMBOLISM AND ITS MANAGEMENTS.pdf
PULMONARY EMBOLISM AND ITS MANAGEMENTS.pdfDolisha Warbi
 
Presentation on General Anesthetics pdf.
Presentation on General Anesthetics pdf.Presentation on General Anesthetics pdf.
Presentation on General Anesthetics pdf.Prerana Jadhav
 
Report Back from SGO: What’s New in Uterine Cancer?.pptx
Report Back from SGO: What’s New in Uterine Cancer?.pptxReport Back from SGO: What’s New in Uterine Cancer?.pptx
Report Back from SGO: What’s New in Uterine Cancer?.pptxbkling
 
Statistical modeling in pharmaceutical research and development.
Statistical modeling in pharmaceutical research and development.Statistical modeling in pharmaceutical research and development.
Statistical modeling in pharmaceutical research and development.ANJALI
 
SYNDESMOTIC INJURY- ANATOMICAL REPAIR.pptx
SYNDESMOTIC INJURY- ANATOMICAL REPAIR.pptxSYNDESMOTIC INJURY- ANATOMICAL REPAIR.pptx
SYNDESMOTIC INJURY- ANATOMICAL REPAIR.pptxdrashraf369
 
SWD (Short wave diathermy)- Physiotherapy.ppt
SWD (Short wave diathermy)- Physiotherapy.pptSWD (Short wave diathermy)- Physiotherapy.ppt
SWD (Short wave diathermy)- Physiotherapy.pptMumux Mirani
 
Music Therapy's Impact in Palliative Care| IAPCON2024| Dr. Tara Rajendran
Music Therapy's Impact in Palliative Care| IAPCON2024| Dr. Tara RajendranMusic Therapy's Impact in Palliative Care| IAPCON2024| Dr. Tara Rajendran
Music Therapy's Impact in Palliative Care| IAPCON2024| Dr. Tara RajendranTara Rajendran
 
call girls in paharganj DELHI 🔝 >༒9540349809 🔝 genuine Escort Service 🔝✔️✔️
call girls in paharganj DELHI 🔝 >༒9540349809 🔝 genuine Escort Service 🔝✔️✔️call girls in paharganj DELHI 🔝 >༒9540349809 🔝 genuine Escort Service 🔝✔️✔️
call girls in paharganj DELHI 🔝 >༒9540349809 🔝 genuine Escort Service 🔝✔️✔️saminamagar
 
METHODS OF ACQUIRING KNOWLEDGE IN NURSING.pptx by navdeep kaur
METHODS OF ACQUIRING KNOWLEDGE IN NURSING.pptx by navdeep kaurMETHODS OF ACQUIRING KNOWLEDGE IN NURSING.pptx by navdeep kaur
METHODS OF ACQUIRING KNOWLEDGE IN NURSING.pptx by navdeep kaurNavdeep Kaur
 
COVID-19 (NOVEL CORONA VIRUS DISEASE PANDEMIC ).pptx
COVID-19  (NOVEL CORONA  VIRUS DISEASE PANDEMIC ).pptxCOVID-19  (NOVEL CORONA  VIRUS DISEASE PANDEMIC ).pptx
COVID-19 (NOVEL CORONA VIRUS DISEASE PANDEMIC ).pptxBibekananda shah
 
April 2024 ONCOLOGY CARTOON by DR KANHU CHARAN PATRO
April 2024 ONCOLOGY CARTOON by  DR KANHU CHARAN PATROApril 2024 ONCOLOGY CARTOON by  DR KANHU CHARAN PATRO
April 2024 ONCOLOGY CARTOON by DR KANHU CHARAN PATROKanhu Charan
 
The next social challenge to public health: the information environment.pptx
The next social challenge to public health:  the information environment.pptxThe next social challenge to public health:  the information environment.pptx
The next social challenge to public health: the information environment.pptxTina Purnat
 
Primary headache and facial pain. (2024)
Primary headache and facial pain. (2024)Primary headache and facial pain. (2024)
Primary headache and facial pain. (2024)Mohamed Rizk Khodair
 
VarSeq 2.6.0: Advancing Pharmacogenomics and Genomic Analysis
VarSeq 2.6.0: Advancing Pharmacogenomics and Genomic AnalysisVarSeq 2.6.0: Advancing Pharmacogenomics and Genomic Analysis
VarSeq 2.6.0: Advancing Pharmacogenomics and Genomic AnalysisGolden Helix
 
Glomerular Filtration and determinants of glomerular filtration .pptx
Glomerular Filtration and  determinants of glomerular filtration .pptxGlomerular Filtration and  determinants of glomerular filtration .pptx
Glomerular Filtration and determinants of glomerular filtration .pptxDr.Nusrat Tariq
 
Biomechanics- Shoulder Joint!!!!!!!!!!!!
Biomechanics- Shoulder Joint!!!!!!!!!!!!Biomechanics- Shoulder Joint!!!!!!!!!!!!
Biomechanics- Shoulder Joint!!!!!!!!!!!!ibtesaam huma
 
epilepsy and status epilepticus for undergraduate.pptx
epilepsy and status epilepticus  for undergraduate.pptxepilepsy and status epilepticus  for undergraduate.pptx
epilepsy and status epilepticus for undergraduate.pptxMohamed Rizk Khodair
 

Dernier (20)

call girls in green park DELHI 🔝 >༒9540349809 🔝 genuine Escort Service 🔝✔️✔️
call girls in green park  DELHI 🔝 >༒9540349809 🔝 genuine Escort Service 🔝✔️✔️call girls in green park  DELHI 🔝 >༒9540349809 🔝 genuine Escort Service 🔝✔️✔️
call girls in green park DELHI 🔝 >༒9540349809 🔝 genuine Escort Service 🔝✔️✔️
 
call girls in Dwarka Sector 21 Metro DELHI 🔝 >༒9540349809 🔝 genuine Escort Se...
call girls in Dwarka Sector 21 Metro DELHI 🔝 >༒9540349809 🔝 genuine Escort Se...call girls in Dwarka Sector 21 Metro DELHI 🔝 >༒9540349809 🔝 genuine Escort Se...
call girls in Dwarka Sector 21 Metro DELHI 🔝 >༒9540349809 🔝 genuine Escort Se...
 
PULMONARY EMBOLISM AND ITS MANAGEMENTS.pdf
PULMONARY EMBOLISM AND ITS MANAGEMENTS.pdfPULMONARY EMBOLISM AND ITS MANAGEMENTS.pdf
PULMONARY EMBOLISM AND ITS MANAGEMENTS.pdf
 
Presentation on General Anesthetics pdf.
Presentation on General Anesthetics pdf.Presentation on General Anesthetics pdf.
Presentation on General Anesthetics pdf.
 
Report Back from SGO: What’s New in Uterine Cancer?.pptx
Report Back from SGO: What’s New in Uterine Cancer?.pptxReport Back from SGO: What’s New in Uterine Cancer?.pptx
Report Back from SGO: What’s New in Uterine Cancer?.pptx
 
Statistical modeling in pharmaceutical research and development.
Statistical modeling in pharmaceutical research and development.Statistical modeling in pharmaceutical research and development.
Statistical modeling in pharmaceutical research and development.
 
Epilepsy
EpilepsyEpilepsy
Epilepsy
 
SYNDESMOTIC INJURY- ANATOMICAL REPAIR.pptx
SYNDESMOTIC INJURY- ANATOMICAL REPAIR.pptxSYNDESMOTIC INJURY- ANATOMICAL REPAIR.pptx
SYNDESMOTIC INJURY- ANATOMICAL REPAIR.pptx
 
SWD (Short wave diathermy)- Physiotherapy.ppt
SWD (Short wave diathermy)- Physiotherapy.pptSWD (Short wave diathermy)- Physiotherapy.ppt
SWD (Short wave diathermy)- Physiotherapy.ppt
 
Music Therapy's Impact in Palliative Care| IAPCON2024| Dr. Tara Rajendran
Music Therapy's Impact in Palliative Care| IAPCON2024| Dr. Tara RajendranMusic Therapy's Impact in Palliative Care| IAPCON2024| Dr. Tara Rajendran
Music Therapy's Impact in Palliative Care| IAPCON2024| Dr. Tara Rajendran
 
call girls in paharganj DELHI 🔝 >༒9540349809 🔝 genuine Escort Service 🔝✔️✔️
call girls in paharganj DELHI 🔝 >༒9540349809 🔝 genuine Escort Service 🔝✔️✔️call girls in paharganj DELHI 🔝 >༒9540349809 🔝 genuine Escort Service 🔝✔️✔️
call girls in paharganj DELHI 🔝 >༒9540349809 🔝 genuine Escort Service 🔝✔️✔️
 
METHODS OF ACQUIRING KNOWLEDGE IN NURSING.pptx by navdeep kaur
METHODS OF ACQUIRING KNOWLEDGE IN NURSING.pptx by navdeep kaurMETHODS OF ACQUIRING KNOWLEDGE IN NURSING.pptx by navdeep kaur
METHODS OF ACQUIRING KNOWLEDGE IN NURSING.pptx by navdeep kaur
 
COVID-19 (NOVEL CORONA VIRUS DISEASE PANDEMIC ).pptx
COVID-19  (NOVEL CORONA  VIRUS DISEASE PANDEMIC ).pptxCOVID-19  (NOVEL CORONA  VIRUS DISEASE PANDEMIC ).pptx
COVID-19 (NOVEL CORONA VIRUS DISEASE PANDEMIC ).pptx
 
April 2024 ONCOLOGY CARTOON by DR KANHU CHARAN PATRO
April 2024 ONCOLOGY CARTOON by  DR KANHU CHARAN PATROApril 2024 ONCOLOGY CARTOON by  DR KANHU CHARAN PATRO
April 2024 ONCOLOGY CARTOON by DR KANHU CHARAN PATRO
 
The next social challenge to public health: the information environment.pptx
The next social challenge to public health:  the information environment.pptxThe next social challenge to public health:  the information environment.pptx
The next social challenge to public health: the information environment.pptx
 
Primary headache and facial pain. (2024)
Primary headache and facial pain. (2024)Primary headache and facial pain. (2024)
Primary headache and facial pain. (2024)
 
VarSeq 2.6.0: Advancing Pharmacogenomics and Genomic Analysis
VarSeq 2.6.0: Advancing Pharmacogenomics and Genomic AnalysisVarSeq 2.6.0: Advancing Pharmacogenomics and Genomic Analysis
VarSeq 2.6.0: Advancing Pharmacogenomics and Genomic Analysis
 
Glomerular Filtration and determinants of glomerular filtration .pptx
Glomerular Filtration and  determinants of glomerular filtration .pptxGlomerular Filtration and  determinants of glomerular filtration .pptx
Glomerular Filtration and determinants of glomerular filtration .pptx
 
Biomechanics- Shoulder Joint!!!!!!!!!!!!
Biomechanics- Shoulder Joint!!!!!!!!!!!!Biomechanics- Shoulder Joint!!!!!!!!!!!!
Biomechanics- Shoulder Joint!!!!!!!!!!!!
 
epilepsy and status epilepticus for undergraduate.pptx
epilepsy and status epilepticus  for undergraduate.pptxepilepsy and status epilepticus  for undergraduate.pptx
epilepsy and status epilepticus for undergraduate.pptx
 

Evaluating tissue expression of RANTES with subtype specific breast cancer biomarkers found elevated in plasma

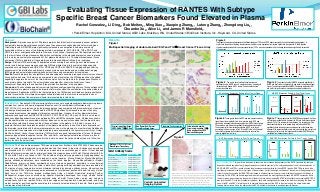
  • 1. Evaluating Tissue Expression of RANTES With Subtype Specific Breast Cancer Biomarkers Found Elevated in Plasma Rachel Gonzalez2, Li Ding2, Bob Melton2, Ming Xiao2, Xiaoping Zhang2, Lutong Zhang3, Zhongdong Liu3, Chuanbo Xu3, Alice Li3 and James R Mansfield1. 1PerkinElmer, Hopkinton, MA, United States; 2GBI Labs, Mukilteo, WA, United States; 3BioChain Institute, Inc., Hayward, CA, United States. Abstract Results Figure 3 Background: A previous analysis of 23 plasma proteins found that levels increased in cancer patients The graphs show increased expression and different subtype of TGFa and VEGF when measured by Vectra Automated Imaging system. In compared to benign-breast-disease controls when the cancer was analyzed based on tumor subtypes. Figure 1 order to see the pattern of staining, tumors cores were sorted to show expression from least to highest and then graphed. Double negative Circulating levels of RANTES were significantly increased in cancer patients and were commonly Multispectral imaging of double-stained VEGF and TGFa Breast Cancer Tissue Array tumors are represented with twice as many samples (red). TGFa was not expressed at all in the benign tissue but was significantly increased in associated with two or more of the following proteins; amphiregulin, EGF, HB-EGF, TGFa, PDGF, and all tumor types. VEGF in a tumor subtype specific pattern. However, it is unknown if expression of these proteins correlate in the tumor tissue of breast cancer subtypes thus contributing to the elevated expression seen in plasma. In this study, we evaluate the expression of 5 of plasma biomarkers in a 70-subject breast cancer tissue microarray (TMA) to determine if these proteins are increased differentially by tumor subtypes. Design: BioChain TMA containing 70 duplicated cores covering the common types of breast cancer, 5 normal, and 5 benign cases are assayed using GBI Labs triple stain kits to evaluate subtype specific expression of amphiregulin and HB-EGF or PDGF and VEGF with RANTES. Imaging and quantitative assessment of the distribution and intensity of each stain was evaluated using a multispectral imaging (MSI) approach, automated morphologic analysis software and compared to a visual screen. Results: Results indicate that an algorithm can be developed to accurately recognize tumor versus stromal tissue within each core. Furthermore, as compared to visual evaluation, the MSI approach has the added capability to separate the color of the three immunostains from the triple stain for precise quantification of each protein without crosstalk. The automated scoring algorithm shows the limitations of visual Figure 4 The graphs show that Amphiregulin increased Figure 5 The graphs show that HB-EGF increased significantly in assessment. Especially in the case when three proteins are localized in the cytoplasm. significantly only in the ER tumor. In our previous study, Amphiregulin the ER and Her2+ tumor subtypes which was similar to early stage breast Conclusion: The knowledge gained from correlating these subtype-specific patterns of tissue antigens with increased only in plasma of ER+ tumors. Scored on intensity and cancer. The plasma samples found HB-EGF increased in plasma of ER+ number of positive cells. and Her2+ tumors. Scored on intensity and number of positive cells. circulating levels in plasma may provide important information about the contribution of specific markers of breast cancers. Application of MSI to the triple staining in the TMA screen provided a superior quantitative Amphiregulin Expression Pattern In Four Tumor Types HB-EGF Expression Pattern in Four Tumor Types method for evaluation of multiple chromogens linked proteins within a tumor core compared to visual observations/grading of the complex multicolor immunostaining in this study. Introduction Sandwich ELISA microarray platform was use to evaluate candidate biomarkers in plasma samples from women with newly diagnosed breast cancer (Cancer Epidemiol Biomarkers July 2011 20; 1543). In our previous study, the disease data set was compared with plasma samples of women with benign breast neoplasia. We showed that RANTES significantly increased in women with newly diagnosed breast cancer independent of breast cancer subtype. However the other biomarker whose expression changed such as AREG, EGF, HB-EGF, PDGF, RANTES, TGFα, and VEGF did so in breast disease subtype dependent manner as defined by ER and HER2 expression levels. Studies have shown Figure 6 These graphs show that EGF was rarely expressed in any Figure 7 These graphs show that RANTES was expressed in all type that these biomarkers are associated with other diseases, so we can not conclude that the breast tumors type of breast tumor epithelial cells. In our previous study, EGF was of breast tumor epithelial cells. However the ER+ and Her2+ breast tumors are directly contributing to change noted of these cytokines in the plasma. In this study, our goal is to significantly increased in the plasma samples from HER2+ breast tumors. showed ~30% of the tumors with low expression. It is hard to know if the evaluate the tumor tissue expression pattern of the plasma biomarkers to see if the tumors expression of The question is why did we see significant increase in plasma samples? tissue results correlates to the plasma study which found RANTES Original Image From Scope Map =Tumor Red / Normal Individual Cell Assessment Yellow is double positive significantly since the benign cases number was low on the tissue array. the biomarker correlated with the biomarker expression seen in the plasma of our earlier study. Additionally The answer may lie in the increase expression of EGF in the tissue VEGF-DAB & TGFa-AP-Red Green/ Blue Empty Space Green is single positive TGFa However if the expression pattern seen in this study holds true in larger sent surrounding the tumor as seen in Fig.2 B1 and B2 to the left of this panel. we evaluated if the expression of multiple biomarkers were expressed in the same tumor cell or not. Using Red is single positive VEGF of benign and tumor cases the results would show that RANTES may be One could hypothesize that the tissue surrounding the tumor cells is BioChain’s Breast Cancer tissue microarray (TMA) which has a good representation of three of the breast Blue is double negative contributed from diseased breast tissue. receiving signals from the tumor. cancer subtypes (double negative tumors; ER+; and Her2+) and benign/normal breast tissue, we found that, indeed, the markers were expressed in the tumors; however they did and did not seem to follow the Figure 2 EGF Expression Pattern In Four Tumor Types RANTES Expression Pattern In Four Tumor Types pattern found in the earlier study. BioChain -Z7020004 2x70 cores Methods The 70 case breast cancer TMA was obtained from BioChain Cat# Z7020004. Slides were de- Breast Cancer Tissue Array waxed in xylene and re-hydrated using graded alcohols then rinsed in tap water. Endogenous peroxidase was blocked with 3% H2O2 for 10 minutes and washed in several changes of water. If Heat Induced Table1 Antibody Source Epitope Retrieval was required for primary antibody, this step was done with 10mM Citrate buffer pH6.0 for A1 B1 15 min at 98C with a cool-down to 45C. The double and triple staining procedure is highly dependent on Antibody Used Source/Cat# the primary antibody combination with respect to animal species. Mouse-Rabbit or Mouse-Rabbit-Goat Gt anti-EGF SantaCruz/SC-1343 Gt anti-HB-EGF SantaCruz/SC-1414 primary antibody combinations were incubated on the tissue together. Mouse-Mouse-Rabbit or Rabbit- Ms anti-Ampheregulin SantaCruz/SC-74501 Rabbit-Mouse primary antibody combinations were stained sequentially according to manufactures Ms anti-VEGF SantaCruz/SC-3462 Conclusion: The goal of this study was to observe in tumor tissues the expression of the EGFR ligands in the subtype- protocols with GBI Triple Stain kits listed in table. Most primary antibody combinations were incubated for Rb anti RANTES Abcam /Ab9678 dependent plasma samples of early-stage breast cancers studied previously. The subtype-dependent tumor tissue expression of 30 minutes at room temperature unless otherwise indicated by primary antibody source. Manual scoring Rb anti-TGFalpha Abcam /Ab9585 A2 B2 AREG, HB-EGF and TGFa results mirrored the plasma-expression patterns for these EGFR ligands. RANTES was found to be Rb anti-PDGF SantaCruz/SC-128 significantly increased in the four major types of breast cancer, but not the benign set. However, the number of benign samples (5 using Olympus BX40 Light microscope was assessed on total percent positive cells and intensity of stain. Each core of the TMA was imaged multispectrally using a Vectra® Automated Imaging System. Mult-Stained Kits Source/Cat# Fig.2 Image A1 and A2 are from tissue array stained with Ms anti-AREG and total) is to small to conclude that RANTES is increased in all breast tumors; however there is literature to support the findings in Multispectral images were unmixed using spectral signatures developed from singly stained control Mouse, Rabbit GBI Labs/DS201 Goat anti-HB-EGF. In A1 you see strong expression of both Amphiregulin-DAB this study. For RANTES, the double-negative breast tumors showed the most significant increase in RANTES expression within and HB-EGF-AP Red. In A2 AREG is expressed but much less of HB-EGF is samples. The unmixed images were analyzed using inForm® Tissue Finder, which was trained to Rabbit,Mouse, Mouse GBI Labs/TS301 expressed. Images B1 and B2 are from tissue arrays stained with Ms anti-ER the tumor group when comparing the number of tumors that are not expressing RANTES to those that are expressing RANTES. It automatically find tumor regions. Within the tumor regions, cell segmentation was performed, and each Rabbit, Rabbit, Mouse GBI Labs/TS302 DAB , Rb anti-RANTES AP-Red, and Gt anti-EGF Emerald . B1 shows was rare to see EGF in the tumor epithelial cytoplasm, but we did see significant increase in the stroma surrounding the tumor, as marker scored for positive/negative according to a manually selected intensity threshold. Double positivity Vectra® Automated expression of all three proteins, B2 is an ER negative tumor showing seen in fig 2B1 and 2B2. Our future goal is to evaluate the expression of the EGF in the stroma using the Vectra Automated Mouse, Rabbit, Goat GBI Labs/TS303 Imaging System expression of RANTES and EGF. The EGF was rarely detected in the tumor scoring was also performed. cells but was often increased in the surrounding stromal cells of the tumor. Imaging system to see if truly the expression the EGF is altered in the stroma in a subtype-specific manner..