Reducing Cycle Time for iDEN Releases – A Development and Test Perspective
A Radical Challenge in Reliability Dynamic Life Test.pdf; Burn-In program Consolidation
1. A Radical Challenge in Reliability Dynamic Life Test; Burn-In program
Consolidation
Submitted to:
Greg Perzanowski/Director of Quality,
Vassilis Danginis, Failure Analysis/Reliability Director
Quality Sys and Reliability
2355 W Chandler Blvd,
Chandler, Arizona, 85224
Prepared by:
Christian Ramiscal, Reliability Engineer
Phillip Chan, Reliability Technician III
Reliability Department/Corporate Reliability
2355 W Chandler Blvd,
Chandler, Arizona, 85224
Authentication:
Arthur Navarro, Failure Analysis/Reliability Manager,
Arthur.Navarro@microchip.com
Shobhie Date, Sr. Quality Manager,
Shobhie.date@microchip.com
February 1, 2015
2. Executive Summary
With the increase of varying product lines, continued Microchip support and company acquisitions,
Reliability ovens are being maximized. This is one of the top problems that Microchip Reliability
department have. Maximized oven capacity can lead to dissatisfied Product Engineers (PE), missed goals
and revenue from the company from failing to release the product on time. On June of 2014,
Continuous Improvement urges Microchip Chandler and Microchip Thailand (MTAI) to team up and find
ways to solve the issue.
Following the Six Sigma methodology and through the use of TRIZ (systematic problem solving, see
appendix C), it shows that one of the major reason is the oven slot level utilization is not being
maximize. TRIZ compliments the first part of the six sigma problem solving methodology (DMAIC) which
is Defining the problem. How to increase slot level utilization on the chamber is the main issue.
With a single oven, it typically has 64 slots with four zones that can only utilize one program per zone.
The current system faces multiple compatibility issues for each product. The 12 ovens tools are
affected with the change: AEHR 12000 (5), MAX 2 (3), MAX 3 (2) and KES (2).
There are three ways to solve the issue; Increase the number of ovens, increase the number of Pattern
Generator (PG) driver or consolidate the program. Purchasing and/or increasing the number of PG driver
are not efficient route since 1 PG driver cost over 20,000 dollars. It is also subjected to maintenance and
repair and oven space.
The team focuses on consolidating the program and on July of 2014 it was found by the Reliability
Engineer, Test engineer and Product Engineer that program consolidation is feasible. The new process
change should be statistically equal or better than the old process. Design of Experiment (DOE, see
appendix D) is used to compare the old process with the new process. DOE was done in Chandler and
Thailand and a Gantt chart was used to accurately schedule the start and finish date.
The DOE results shows that the new program is statistically equal or better (SEB) than the old program
with 95% confidence. The data was presented and approved by Shobhie (quality), Reliability team and
team affected with the changes. More than 80 products with different Dynamic Life Test (DLT)
configuration were affected by the changes.
The project is SMART (Specific, Measurable, Attainable, Relevant and Time bound) project. Specific
means this is one area of improvement. Measurable means the information can be extracted. Attainable
means that the project is feasible. It is relevant to our department and time bound means the project
was completed in 6 months time frame.
Beginning December of 2014, the new change was implemented and the benefits are:
Increase Burn-In Run rate (capacity) through increase of slot level utilization in the chamber
Save multiple orders of PG driver boards which cost $20k each from MTAI
Easier planning since products affected can now share chamber zones
Reduce backlog in Microchip Chandler/MTAI given that all slots are up to production
Reduce operation cost by minimizing the number of days to support a project
New change will be carry over to the new process/technology that requires similar set-up
3. 1.0 Introduction
Reliability department focuses on the reduction of infant mortality, allowing Microchip Technology (see
appendix A) to bridge the gap between latent defect densities intrinsic to the silicon (Si) and the failure
rates established in Microchip’s quality goals. This is done by stressing the parts at higher voltages and
temperature than typical conditions, to further accelerate the ‘activation’ of latent defects also known
as Burn-In (see appendix B).
With the increase of varying product lines, continued Microchip support and company acquisitions,
Reliability ovens are being maximized. This is one of the top problems that Microchip Reliability
department have. Maximized oven capacity can lead to dissatisfied Product Engineers (PE), missed goals
and revenue from the company from failing to release the product on time. On June of 2014,
Continuous Improvement urges Microchip Chandler and Microchip Thailand (MTAI) to team up and find
ways to solve the issue.
With a single oven, it typically has 64 slots with four zones that can only utilize one program per zone.
The current system faces multiple compatibility issues for each product. The 12 ovens tools are
affected with the change: AEHR 12000 (5), MAX 2 (3), MAX 3 (2) and KES (2).
The report presents how Microchip Chandler and Microchip Thailand team up to find ways to overcome
the problem. Furthermore, the paper will show detailed information how Six Sigma was used and how
the company benefits from it. The methodologies and techniques used in this paper can be applied in
different projects.
2.0 The Improvement Opportunity: The Define Phase
Define phase is the first part of the Six sigma problem solving strategy. This is also the hardest part of
the project since defining the problem and the project requires a lot of brainstorming, gathering of data
and approval from the management. The team decides to use TRIZ (see appendix c). TRIZ compliments
this phase since it helps to define the root cause of the problem.
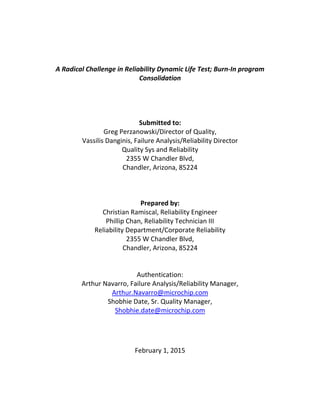
Figure 1 shows TRIZ’s Cause and effect analysis. Cause and effects analysis is a method leading to the
listing of all possible reasons and outcomes associated with a particular problem or situation. It is a
group process direct at uncovering possible or probable causal factors and their manifestation. The
original problem statement is “Reliability ovens are being maximized”. But using the Cause and Effect
analysis we can see that actual the problem is “How to avoid different pattern program to increase tool
utilization”.
The major problem in Burn-In (BI)/Reliability department is capacity. Different products require different
BI programs. Thus we found out that we can simplify the program to one universal pattern. The change
will increase the slot level utilization of the tool and a universal program means easier for the
technicians to operate. The limitation of the project is this will be effective for program that requires
only DLT code of Reset (MCLR), 1 MHz and 2 MHz signal. This affects 80+ products that are running in
4. our current set-up. The change will also benefit the future process/technology new product
development that requires similar set-up.
Figure 1
Universal pattern should was evaluated and should be comparing to the old pattern. The new process
change should be statistically equal or better than the old process. This project requires a DOE to
compare the old process with the new process. Areas the team decides to look for are current and
output DLT waveform.
Benefits of the universal pattern:
Increase Burn-In Run rate (capacity) through increase of slot level utilization in the chamber
Save multiple orders of PG driver boards which cost $20k each from MTAI
Easier planning since products affected can now share chamber zones
Reduce backlog in Microchip Chandler/MTAI given that all slots are up to production
Reduce operation cost by minimizing the number of days to support a project
New change will be carry over to the new process/technology that requires similar set-up
The team manages to gather people resources and had a meeting with our quality guru in Microchip,
Shobhie Date and Nagateja Tadepalli, which will be our statistics mentor inside the company. The
meeting talks about how to implement this in our organization and the legal boundaries. Based on
quality guru, the project does not need a white paper to implement the new process. A memo should be
enough.
5. 3.0 Performance: The Measure Phase
Our Phase 2 stage, we manage to identify the key input and output variables. Our input variables are the
MCLR program and the output variables are the current consumptions and output waveform readings.
The goal of the project is the new universal program should be statistically equal or better than the old
program.
Table 1
The project phase 2 starts from August to September of 2014 based on Gantt chart (table 1). In addition,
due to low sample in Microchip Chandler, Christian travelled to the manufacturing plant in Thailand to
complete the project Design of experiment. The travel was schedule between 8/21/14 to 9/6/2014. The
plan is to run as many lots as possible and compare to the old system. AEHR 1200, KES, MAX and MAX2
oven machines are affected with the change.
In addition, we manage to get Microchip Thailand to support us in checking the BI specs. Udom
Suksansakul (Reliability Engineer) is driving the project in Microchip Thailand. Information below shows
the program that we can improve. Table 2 shows the masks affected and were gathered from the Burn-
In (BI) spec. BI spec will show how to stress each product.
Table2
6. Focusing on the MCLR column, it shows that it can be standardized. The plan is to make the Master clear
(MCLR) as universal as possible so program is universal. The proposed MCLR is 100 micro second low
and 2 seconds high. MCLR dictates the products in DLT (Dynamic Life Test) mode. MCLR high means the
product is in DLT mode or parts are being exercised, MCLR in low means that the product is not being
exercised. The reason MCLR has low is that Product Engineers (PE) found out that there is a probability
that the DLT stops. The fix is to pulse a low voltage on MCLR to reset the code. The proposed MCLR
signal is undergoing review by the PE partners and the Reliability Engineers (RE). After this then we will
start doing the choice of design and conducting the experiment.
Using the blocking principle, RE and PE engineers found out that the variable that needs to be tracked
on the Design of Experiment is output waveform. The test will randomly pick the 1 product and will do
compare the old process with the new process. Basically the output expected is passing or failing.
Passing meaning the parts are being exercised in DLT mode and failing meaning the parts are not
exercised in DLT mode. Also we will check the voltage and current consumption and compare it from the
old system with the new system.
4.0 Analysis and Interpretation: The Analyze Phase
DOE (Design of Experiments) result proved that the new program is Statistically Equal or Better (SEB)
than the old program with 95% confidence. Do not reject null Hypothesis. Proposal is to implement the
universal program across all the affected masks. The new program will require including 2 MHz clock on
C0-C3 signal, 1 MHz clock on C4-C7 signal and 100us low and 5s high for A0-A15 signal. The mask used
for the DOE are LECP1, LECV1, DEEU1, LEBA1, DECH1 and will measure the current loadings and DLT
waveform.
On September 2014, the team completed the Design of Experiments (DOE). The DOE is being set up to
compare the old program with the new program. Sample size minimum is 50 for the old program and 50
for the new program. The areas to look for are the output DLT waveform and the current draw. Please
see below for the results here in chandler:
Table 3: Chandler result Yield comparison
7. Table 3 shows the Yield comparison of the between the old program and the new program. We had 100
readings. Comparing the 2, it is found that the new program is statistically equal or better than the old
program with 95% confidence.
Table 4: Chandler current comparison
Table 4 shows that the current reading between the old program and the new program is statistically
equal with 95% confidence. T-test was used with the help of Tukey-Kramer HSD analysis to compare the
two set-ups. We used 3 mask or product (LECP, LECV and DEEU). Sample size is 100
Table 5: MTAI result yield comparison
Table 5 shows the comparison of the DLT (Dynamic Life Test) waveform between the old program and
the new program. We had 1000 readings. Comparing the 2, it is found that the new program is
statistically equal or better than the old program with 95% confidence.
8. The result below is for MAX2 oven only. Due to limited resources here in Arizona, the management
decided to continue the DOE in Thailand. Christian travelled to Thailand from August 28, 2014 to
September 26, 2014. Results in MTAI below:
Table 6: MAX oven yield comparison
Table 7: AEHR 1200 oven yield comparison
Table 8: KES oven yield comparison
9. DLT waveform comparison shows that the new program is statistically equal or better (SEB) than the old
program with 95% confidence across MAX, AEHR and KES tools. Mask used: LEBA1, DECH1
5.0 Recommendation: The Improve Phase
The data was presented to the management including the Reliability manager in Thailand and Chandler,
Quality manager and the decision is to move forward with the change. The change is to implement the
new BI program/pattern.
6.0 The Control Phase
Table 9: universal pattern limitation
Table 9 shows that out of 80+ products affected, only 9 (10%) needs rework on the Burn-In Board
header card. The plan is to update the BI spec for the 70 products and order header card on the
products that needs header card rework.
Table 10: standardize program
Table 10 shows the standard program and can be explained below:
PS1(55), PS2(55), Pattern (A1), PG (P), number of PG(1 or 3)
5555A1P1 8 bit 5.5V and for PG and pattern 1
5555A1P3 8 bit 5.5V and for PG3
3535A1P1 8 bit 3.5V and for PG
3535A1P3 8 bit 3.5V and for PG3
10. Standardize program and BI specs update was used to control the new change. These actions will
make sure that the changes are properly done. The BI specs updates started in October of 2014 and
were completed last December of 2014.
7.0 Conclusion
With the increase of varying product lines, continued Microchip support and company acquisitions,
Reliability ovens are being maximized. This is one of the top problems that Microchip Reliability
department have. Maximized oven capacity can lead to dissatisfied Product Engineers (PE), missed goals
and revenue from the company from failing to release the product on time. On June of 2014,
Continuous Improvement urges Microchip Chandler and Microchip Thailand (MTAI) to team up and find
ways to solve the issue.
With the proposed solution to standardize the program making it universal, The DOE results
showed that comparison shows that the new program is statistically equal or better (SEB) than the old
program with 95% confidence across different ovens (MAX, AEHR and KES).
The benefits:
Increase Burn-In Run rate (capacity) through increase of slot level utilization in the chamber
Save multiple orders of PG driver boards which cost $20k each from MTAI
Easier planning since products affected can now share chamber zones
Reduce backlog in Microchip Chandler/MTAI given that all slots are up to production
Reduce operation cost by minimizing the number of days to support a project
New change will be carry over to the new process/technology that requires similar set-up
Acknowledgments
The author would like to thank the following people:
Greg Perzanowski— Director of Quality
Vassilis Danginis— Reliability Director
Art Navarro/Shobhie Date— Project mentor
Surasit Phurikhup— Sr. QA Manager (Thailand)
Nagateja Tadepalli—Quality and Six Sigma partner
Andres Alvira— Applications Engineer
Marita Whitaker, Martin Kvasnicka, Sonle Levan, Scott Johnson, John Charais, Mike Charles,
Henry Pena, Chintan Desai, Ashwin Natarajan, Rico Aguirang, etc—Product Engineering
Kreethapon Sirianukranvattana, Somnuek Thongprasert, Udom Suksansakul, Wittawat
Premniwat, Sumittra Boonsuan, Thinnapol Nakkasun, Wannapa Pumcharoen, Thitipong
Ngamrit, Yupa Pankaew – Reliability Engineering (Thailand)
Ramakrishna Gopal, Xu Liu, Rodney Crandell, Gabe Romero, Taufa Pulotu — Reliability
Engineering (Chandler)
Tatsanee Arunsopha— Sr. Administrator (Thailand)
11. Appendices
A. Microchip Technology is a US based manufacturer of microcontrollers, memory and analog
semiconductors. Its products include microcontrollers (8, 16, and 32 bit dsPIC and PIC
controllers), Serial EEPROM (Electrically Erasable Program Read Only memory) devices, Serial
SRAM (Static Random Access Memory) devices, KEELOQ (remote keyless entry) devices, radio
frequency (RF) devices, thermal, power and battery management analog devices, as well as
linear, interface and mixed signal devices. Some of the interface devices include USB,
ZigBee/MiWi (Wireless transmission protocol), Controller Area Network, and Ethernet.
B. Burn-In (BI) — is the first process of testing Units. The Primary purpose of BI is to precipitate
infant mortality. Under voltage bias and temperature, certain silicon defect mechanisms
affecting product reliability are accelerated.
C. TRIZ is a structured methodology based on the laws of physics and what innovative patents
have presented as ways of solving problems. It was developed by the Soviet inventor and
science fiction author Genrich Altshuller and his colleagues, beginning in 1946.
D. Design of experiments (DOE) is a systematic method to determine the relationship between
factors affecting a process and the output of that process. In other words, it is used to find
cause-and-effect relationships. This information is needed to manage process inputs in
order to optimize the output.