Get numerous benefits by upgrading to new Dell OptiPlex 7040 SFF and MT desktops
•
1 j'aime•1,271 vues

The new Dell OptiPlex desktops powered by the latest 6th generation Intel Core processors present many advantages over aging desktops, including performance gains, energy efficiency, and an improved user experience. Compared to the Dell OptiPlex 9020 and legacy Dell OptiPlex 980 SFF and MT models, the Intel Core i5-6500 processor-powered Dell OptiPlex 7040 SFF and MT: -Improved performance that can help employees in your business in areas of productivity—up to 70 percent better performance and 10 times better graphics performance -Offered a quieter workspace—up to 274 percent -Saved workspace with an up to 48.6 percent smaller footprint -Consumed less power, a benefit that can reduce your energy costs by up to 63 percent

Recommandé
Recommandé
Contenu connexe
Tendances
Tendances (11)
En vedette
En vedette (12)
Similaire à Get numerous benefits by upgrading to new Dell OptiPlex 7040 SFF and MT desktops
Similaire à Get numerous benefits by upgrading to new Dell OptiPlex 7040 SFF and MT desktops (20)
Plus de Principled Technologies
Plus de Principled Technologies (20)
Dernier
Dernier (20)
Get numerous benefits by upgrading to new Dell OptiPlex 7040 SFF and MT desktops
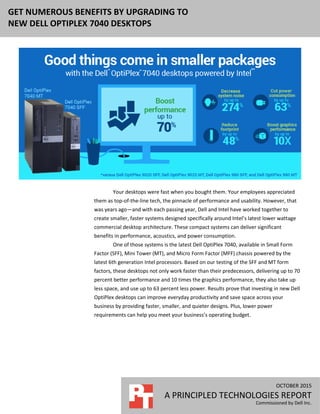
- 1. OCTOBER 2015 (Revised) A PRINCIPLED TECHNOLOGIES REPORT Commissioned by Dell Inc. GET NUMEROUS BENEFITS BY UPGRADING TO NEW DELL OPTIPLEX 7040 DESKTOPS Your desktops were fast when you bought them. Your employees appreciated them as top-of-the-line tech, the pinnacle of performance and usability. However, that was years ago—and with each passing year, Dell and Intel have worked together to create smaller, faster systems designed specifically around Intel’s latest lower wattage commercial desktop architecture. These compact systems can deliver significant benefits in performance, acoustics, and power consumption. One of those systems is the latest Dell OptiPlex 7040, available in Small Form Factor (SFF), Mini Tower (MT), and Micro Form Factor (MFF) chassis powered by the latest 6th generation Intel processors. Based on our testing of the SFF and MT form factors, these desktops not only work faster than their predecessors, delivering up to 70 percent better performance and 10 times the graphics performance, they also take up less space, and use up to 63 percent less power. Results prove that investing in new Dell OptiPlex desktops can improve everyday productivity and save space across your business by providing faster, smaller, and quieter designs. Plus, lower power requirements can help you meet your business’s operating budget.
- 2. A Principled Technologies report 2Get numerous benefits by upgrading to new Dell OptiPlex 7040 SFF and MT desktops ONE UPGRADE, MANY IMPROVEMENTS In addition to being slower than new systems, aging desktops keep employees from gaining the technological advances that new systems and new processors can bring. At Principled Technologies, the new Dell OptiPlex 7040 SFF and 7040 MT delivered CPU and graphics performance wins in our benchmark testing, offered the potential for reduced costs due to consuming less energy, ran quieter, and occupied less space than previous versions of the Dell OptiPlex desktop. Extending the refresh cycle of your business’s desktops means your employees miss these next-generation advantages. We tested three generations of the premium models of the Dell OptiPlex in the two form factors: Five-year-old Dell OptiPlex 980, powered by an Intel Core™ i5-680 processor (legacy) Previous-generation Dell OptiPlex 9020, powered by an Intel Core i5-4590 (recent) Latest generation Dell OptiPlex 7040, powered by an Intel Core i5-6500 (latest) Figure 1 shows some key similarities and differences between the three generations we tested. Latest SFF/MT Recent-gen SFF/MT Legacy SFF/MT USB 3.0 ports 2 front, 4 rear 2 front, 2 rear 0 PS/2 (for keyboards and mice) 2 2 2 RJ-45 ports connector (for Ethernet) 1 1 1 Serial port 1 1 1 HDMI port (for HDMI displays) 1 0 0 VGA port 1 1 1 DIMM slots (for RAM) 4 4 4 Figure 1: Key physical similarities and differences between the three generations of Dell OptiPlex SFF and MT models we tested. All six models were performance-grade systems tested in a standard configuration. For detailed specifications of the test systems, see Appendix A. For systematic details on how we performed our benchmark testing, see Appendix B. For more on the benchmarks, see Appendix C. New OptiPlex 7040 desktops: Better performance in a smaller package without sacrificing business-critical features
- 3. A Principled Technologies report 3Get numerous benefits by upgrading to new Dell OptiPlex 7040 SFF and MT desktops PRODUCTIVITY ADVANTAGES WITH IMPROVED CPU AND GRAPHICS Waiting on a slow desktop to perform basic functions, such as rendering an image, can significantly reduce productivity. Improved CPU and graphics functionality can translate to a faster, more responsive system that saves time on routine tasks. We used three industry-standard benchmarks to demonstrate the performance boost your employees can get with a new Intel Core i5-6500 processor-based Dell OptiPlex 7040 MT or SFF. As Figure 2 shows, both latest generation form factors dramatically improved performance over the five-year-old legacy systems, and showed big improvements over the models that are more recent as well. For detailed results of our benchmark testing, see Appendix D. Vs. legacy system Vs. recent-gen model Dell OptiPlex 7040 SFF CPU test 122% 2% Graphics test 922% 29% Dell OptiPlex 7040 MT CPU test 120% 2% Graphics test 920% 30% Figure 2: The latest Dell OptiPlex models increased performance over legacy and recent model desktops, which means that no matter where you are in your refresh cycle, upgrading could bring big improvements to end users. BAPCo® SYSmark® 2014 BAPCO SYSmark 2014 is an industry-standard benchmark that measures performance in areas such as productivity, media creation, and financial analysis. As Figure 3 shows, the Intel Core i5-6500 processor-powered Dell OptiPlex 7040 SFF and MT desktops had small gains compared to recent-generation models and outperformed the legacy desktops by 70 percent and 69 percent, respectively.
- 4. A Principled Technologies report 4Get numerous benefits by upgrading to new Dell OptiPlex 7040 SFF and MT desktops Figure 3: SYSmark 2014 performance for the Dell OptiPlex 7040 SFF and MT models compared to recent and legacy models. CINEBENCH R15 This latest version of CINEBENCH features three results: Frames-per-second (FPS), a single-CPU score, and a multi-CPU score. The single-CPU score is useful to show the general head-to-head speed advantages for processors regardless of core count, while the multi-CPU score can show the potential of processor functionality when using all available cores. As Figure 4 shows, the Dell OptiPlex 7040 SFF and MT both scored 3 percent higher than the recent-generation systems and scored 56 and 53 percent higher than the legacy systems, respectively. Figure 4: CINEBENCH R15 single-CPU performance for the Dell OptiPlex 7040 SFF and MT models vs. recent- generation and legacy systems.
- 5. A Principled Technologies report 5Get numerous benefits by upgrading to new Dell OptiPlex 7040 SFF and MT desktops On the multi-CPU test, the quad-core Dell OptiPlex 7040 SFF and MT outscored their recent-generation counterparts by 2 percent. In addition, the Dell OptiPlex 7040 SFF and MT outscored the legacy systems by 122 percent and 120 percent, respectively (see Figure 5). Figure 5: CINEBENCH R15 multi-CPU performance for the Dell OptiPlex 7040 SFF and MT vs. recent- generation and legacy systems. Delivering more frames per second (FPS) means better video quality. As Figure 6 shows, the Dell OptiPlex 7040 SFF delivered 45 percent more FPS than its recent-gen equivalent and up to 26 times the FPS of the legacy SFF system. The Dell OptiPlex 7040 MT delivered 47 percent more FPS than the recent-generation system and 26 times the FPS of the legacy MT model. Figure 6: Frames per second as measured by CINEBENCH R15 for the Dell OptiPlex 7040 SFF and MT desktops vs. the recent-generation and legacy systems.
- 6. A Principled Technologies report 6Get numerous benefits by upgrading to new Dell OptiPlex 7040 SFF and MT desktops Futuremark® 3DMark® The 3DMark benchmark runs graphical and computational tests to generate a score for the tested device. The benchmark rates a system’s graphics and virtual physics performance, and high scores generally demonstrate powerful hardware. There are four components to the 3DMark benchmark, each targeting DirectX® (DX) 9, 10, or 11 compatible hardware. The legacy Dell OptiPlex 980 SFF and MT systems could not run two of the components—Fire Strike and Cloud Diver—because they did not have DirectX 11 technology. As Figure 7 shows, the Dell OptiPlex 7040 SFF outscored the recent-generation SFF desktop by up to 29 percent and scored up to 9 times better than the legacy SFF system. Dell OptiPlex 7040 SFF Recent- generation SFF Percent better for Dell OptiPlex 7040 SFF Legacy SFF Percent better for Dell OptiPlex 7040 SFF Fire Strike 924 728 26% Cloud Diver 4,096 3,330 23% Cloud Gate 7,668 6,686 14% 749 922% Ice Storm Extreme 48,037 37,118 29% 10,991 337% Figure 7: 3DMark performance for the Dell OptiPlex 7040 SFF vs. the recent-generation and legacy SFF systems. Higher scores are better. As Figure 8 shows, the Dell OptiPlex 7040 MT outscored the recent-generation MT by up to 30 percent and scored up to 9 times better than the legacy MT system. Dell OptiPlex 7040 MT Recent- generation MT Percent better for Dell OptiPlex 7040 MT Legacy MT Percent better for Dell OptiPlex 7040 MT Fire Strike 925 728 27% Cloud Diver 4,098 3,334 22% Cloud Gate 7,664 6,714 14% 751 920% Ice Storm Extreme 48,052 36,831 30% 10,885 341% Figure 8: 3DMark performance for the Dell OptiPlex 7040 MT vs. the recent-generation and legacy MT systems. Higher scores are better. QUIETER WORKPLACES For employees trying to focus, background system noise can be distracting. While idle, the Dell OptiPlex 7040 SFF was up to 11 percent quieter than the older Dell OptiPlex SFF models, while the Dell OptiPlex 7040 MT was up to 13 percent quieter. When we used PassMark® BurnInTest™ to put the systems under a 75 percent load stressing the CPU, RAM, graphics, and storage, the Dell OptiPlex 7040 MT was the
- 7. A Principled Technologies report 7Get numerous benefits by upgrading to new Dell OptiPlex 7040 SFF and MT desktops quietest system by up to 274 percent.1 Figures 9 and 10 show the results of our acoustic testing. In our testing of the Dell OptiPlex 7040 SFF and MT desktops, the ambient noise of the room had more of an effect on our results than the increase in system load. As such, there was no noticeable difference between idle and load results for the 7040 desktops. Figure 9: The system noise in decibels while idle and under load for the SFF systems. Figure 10: The system noise in decibels while idle and under load for the MT systems. 1 For more information on how we calculated these percentage decreases for perceived loudness, see Appendix E.
- 8. A Principled Technologies report 8Get numerous benefits by upgrading to new Dell OptiPlex 7040 SFF and MT desktops USED LESS POWER Why waste energy and dollars with inefficient aging desktops? The Dell OptiPlex 7040 SFF and MT desktops consumed less power than their recent-generation and legacy counterparts did. The Dell OptiPlex 7040 SFF consumed 22 percent fewer average watts while idle and 17 percent fewer average watts under load than did the recent-generation SFF desktop. In addition, the Dell OptiPlex 7040 SFF consumed 63 percent fewer average watts while idle and 30 percent fewer average watts under load than did the legacy SFF desktop. Figure 11 shows the average power usage of all three SFF systems while idle and under load. Figure 11: The average watts each SFF system consumed while idle and under load. The Dell OptiPlex 7040 MT consumed 9 percent fewer average watts while idle and 12 percent fewer average watts under load than did the Dell OptiPlex 9020 MT. In addition, the Dell OptiPlex 7040 MT consumed 47 percent fewer average watts while idle and 28 percent fewer average watts under load than did the legacy Dell OptiPlex 980 MT. Figure 12 shows the power usage of all three MT systems while idle and under load.
- 9. A Principled Technologies report 9Get numerous benefits by upgrading to new Dell OptiPlex 7040 SFF and MT desktops Figure 12: The average number of watts each MT system consumed while idle and under load. Conventional wisdom indicates that consuming less power can lead to lower operating temperatures, potentially leading to a reduction in cost to cool an office. Figure 13 shows our wattage results converted to British thermal units (BTU) per hour. A single BTU is the amount of heat required to raise the temperature of one pound of water by one degree Fahrenheit. As watts measure power and BTUs measure energy, there is not direct unit-to-unit comparison. The percentage differences between the systems were the same as the wattage results.2 Dell OptiPlex 7040 SFF Recent- generation SFF Legacy SFF Dell OptiPlex 7040 MT Recent- generation MT Legacy MT While idle (BTU/hr) 46.1 59.0 126.6 67.6 74.4 129.3 Under 75 percent load (BTU/hr) 184.3 222.5 265.8 193.1 219.7 268.9 Figure 13: Our power consumption results converted to BTUs per hour. Lower numbers are better. 2 For more information on how we converted watts to BTU/hr, see Appendix E.
- 10. A Principled Technologies report 10Get numerous benefits by upgrading to new Dell OptiPlex 7040 SFF and MT desktops PHYSICAL IMPROVEMENTS Save workspace with the new Small Form Factor desktop or Mini Tower As technology improves and components become smaller or unnecessary, desktops are becoming significantly smaller and more versatile. New space-saving designs can open up more deployment options for businesses and less workstation clutter for employees. As Figure 14 shows, the smaller footprint of the Dell OptiPlex 7040 SFF required less workspace than the recent-generation and legacy SFF systems in our study—10 and 4 percent less space in square inches, respectively. Dell OptiPlex 7040 SFF Recent-generation SFF Legacy SFF Width (inches) 3.6 3.8 3.4 Depth (inches) 11.5 12.2 12.7 Footprint (square inches) 41.4 46.3 43.3 Figure 14: Physical details of the SFF systems we tested. As Figure 15 shows, the smaller footprint of the Dell OptiPlex 7040 MT required less workspace than the recent-generation and legacy MT systems in our study—42.3 and 48.6 percent less space in square inches, respectively. Dell OptiPlex 7040 MT Recent-generation MT Legacy MT Width (inches) 6.1 7.0 7.4 Depth (inches) 10.6 16.0 17.0 Footprint (square inches) 64.7 112.0 125.8 Figure 15: Physical details of the MT systems we tested. Connect via USB 3.0, DisplayPort, and HDMI Upgrading desktops enables employees to take advantage of the latest USB technology. USB 3.0 ports can provide up to 4.8 Gbps transfer rates to USB 3.0 devices— up to 10 times faster than the transfer rate for USB 2.0 connections to USB 2.0 devices. The Dell OptiPlex 7040 MT and SFF models included six USB 3.0 ports. The recent- generation MT and SFF desktops had four, but the legacy systems offered only USB 2.0 ports. Upgrading desktops can also bring the latest digital display technology to employees. Only the latest Dell OptiPlex 7040 MT and SFF systems offered HDMI in addition to DisplayPort, which means your employees can choose how to connect one or more digital displays.
- 11. A Principled Technologies report 11Get numerous benefits by upgrading to new Dell OptiPlex 7040 SFF and MT desktops CONCLUSION The new Dell OptiPlex desktops powered by the latest 6th generation Intel Core processors present many advantages over aging desktops, including performance gains, energy efficiency, and an improved user experience. Compared to the Dell OptiPlex 9020 and legacy Dell OptiPlex 980 SFF and MT models, the Intel Core i5-6500 processor- powered Dell OptiPlex 7040 SFF and MT: Improved performance that can help employees in your business in areas of productivity—up to 70 percent better performance and 10 times better graphics performance Offered a quieter workspace—up to 274 percent Saved workspace with an up to 48.6 percent smaller footprint Consumed less power, a benefit that can reduce your energy costs by up to 63 percent
- 12. A Principled Technologies report 12Get numerous benefits by upgrading to new Dell OptiPlex 7040 SFF and MT desktops APPENDIX A – SYSTEM CONFIGURATION INFORMATION Figure 16 details the SFF systems we used in our tests. System Dell OptiPlex 980 SFF (legacy) Dell OptiPlex 9020 SFF (recent) Dell OptiPlex 7040 SFF (latest) General Number of processor packages 1 1 1 Number of cores per processor 2 4 4 Number of hardware threads per core 2 1 1 Total number of processor threads in system 4 4 4 System power management policy Balanced Dell Dell Processor power-saving option Enhanced Intel SpeedStep Technology Enhanced Intel SpeedStep Technology Enhanced Intel SpeedStep Technology CPU Vendor Intel Intel Intel Name Core i5 Core i5 Core i5 Model number 650 4590 6500 Stepping C2 C0 NA Socket type Socket LGA 1156 Socket LGA 1150 Socket LGA 1151 Core frequency (GHz) 3.20 3.30 3.20 L1 cache 32 KB + 32 KB (per core) 32 KB + 32 KB (per core) 32 KB + 32 KB (per core) L2 cache 256 KB (per core) 256 KB (per core) 256 KB (per core) L3 cache 4 MB 6 MB 6 MB Platform Vendor Dell Dell Dell Motherboard model number 0C522T 00V62H Dell OptiPlex 7040 Motherboard chipset Intel Q57 Intel Q87 Intel Q170 BIOS name and version Dell A16 (05/28/2014) Dell A12 (05/06/2015) Dell 0.2.10 (06/18/2015) Memory module(s) Vendor and model number Kingston® KTW149-ELD Samsung® M378B5173EB0-CK0 Micron® MTA8ATF51264AZ- 2G1A1 Type PC3-10700 PC3-12800 PC4-2133P Speed (MHz) 1,333 1,600 2,133 Speed running in the system (MHz) 1,333 1,600 2,133 Timing/Latency (tCL-tRCD-tRP- tRASmin) 9-9-9-24 11-11-11-28 15-15-15-37 Size (MB) 1,024 4,096 4,096 Number of memory module(s) 4 2 2 Total amount of system RAM (GB) 4 8 8 Channel (single/dual) Dual Dual Dual
- 13. A Principled Technologies report 13Get numerous benefits by upgrading to new Dell OptiPlex 7040 SFF and MT desktops System Dell OptiPlex 980 SFF (legacy) Dell OptiPlex 9020 SFF (recent) Dell OptiPlex 7040 SFF (latest) Hard disk Vendor and model number Western Digital® WDC WD2500AAKX- 00ERMA0 Seagate® ST500DM0 02-1BD142 Seagate ST500LM0 21- 1KJ152 Number of disks in system 1 1 1 Size (GB) 250 500 500 Buffer size (MB) 16 16 32 RPM 7,200 7,200 7,200 Type SATA 6.0 Gb/s SATA 6.0 Gb/s SATA 6.0 Gb/s Controller Intel ICH8R/ICH9R/ICH10R/D O SATA RAID Controller Intel Desktop/Workstation/S erver Express Chipset SATA RAID Controller Intel ICH8R/ICH9R/ICH10R/D O SATA RAID Controller Driver Intel 8.6.2.1315 (8/6/2010) Intel 13.1.0.1058 (5/2/2014) Intel 8.6.2.1315 (8/6/2010) Operating system Name Windows® 7 Professional Windows 7 Professional Windows 7 Professional Build number 7601 7601 7601 Service Pack 1 1 1 File system NTFS NTFS NTFS Kernel ACPI x64-based PC ACPI x64-based PC ACPI x64-based PC Language English English English Microsoft® DirectX version DirectX 11 DirectX 11 DirectX 11 Graphics Vendor and model number Intel HD Graphics Intel HD Graphics 4600 Intel HD Graphics 530 Type Integrated Integrated Integrated Chipset Intel HD Graphics Intel HD Graphics 4600 Intel HD Graphics 530 BIOS version 2080.16 1025.14 1022.7 Total available graphics memory (MB) 1,696 1,696 1,824 Dedicated video memory (MB) 64 64 192 System video memory (MB) 0 0 0 Shared system memory (MB) 1,632 1,632 1,632 Resolution 1,280 × 1,024 1,280 × 1,024 1,280 × 1,024 Driver Intel 8.15.10.2827 (7/31/2012) Intel 10.18.14.4170 (3/16/2015) Intel 10.18.15.4274 (08/13/2015) Sound card/subsystem Vendor and model number Realtek High Definition Audio Realtek High Definition Audio Realtek High Definition Audio Driver Realtek 6.0.1.5876 (11/16/2009) Realtek 6.0.1.6053 (10/16/2014) Realtek 6.0.1.6075 (6/30/2015) Ethernet Vendor and model number Intel 82578DM Gigabit Network Connection Intel Ethernet Connection I217-LM Intel Ethernet Connection I219-LM
- 14. A Principled Technologies report 14Get numerous benefits by upgrading to new Dell OptiPlex 7040 SFF and MT desktops System Dell OptiPlex 980 SFF (legacy) Dell OptiPlex 9020 SFF (recent) Dell OptiPlex 7040 SFF (latest) Driver Intel 11.6.92.0 (12/3/2010) Intel 12.12.80.19 (09/29/2014) Intel 12.13.17.1 (05/19/2015) Optical drive(s) Vendor and model number TSSTcorp TS-L633C TSSTcorp SN-208FB TSSTcorp SU-108GB Type DVD-RW DVD-RW DVD-ROM USB ports Number 8 10 10 Type 8 × USB 2.0 4 × USB 3.0, 6 × USB 2.0 6 × USB 3.0, 4 × USB 2.0 Other eSATA, Display Port, Serial Port 2 × Display Port, Serial Port Media Card Reader, HDMI, 2 × Display Port, Serial Port Figure 16: Detailed information for the SFF test systems. Figure 17 details the MT systems we used in our tests. System Dell OptiPlex 980 MT (legacy) Dell OptiPlex 9020 MT (recent) Dell OptiPlex 7040 MT (latest) General Number of processor packages 1 1 1 Number of cores per processor 2 4 4 Number of hardware threads per core 2 1 1 Total number of processor threads in system 4 4 4 System power management policy Balanced Dell Dell Processor power-saving option Enhanced Intel SpeedStep Technology Enhanced Intel SpeedStep Technology Enhanced Intel SpeedStep Technology CPU Vendor Intel Intel Intel Name Core i5 Core i5 Core i5 Model number 650 4590 6500 Stepping C2 C0 NA Socket type Socket LGA 1156 Socket LGA 1150 Socket LGA 1151 Core frequency (GHz) 3.20 3.30 3.20 L1 cache 32 KB + 32 KB (per core) 32 KB + 32 KB (per core) 32 KB + 32 KB (per core) L2 cache 256 KB (per core) 256 KB (per core) 256 KB (per core) L3 cache 4 MB 6 MB 6 MB Platform Vendor Dell Dell Dell Motherboard model number 0C522T 00V62H OptiPlex 7040 Motherboard chipset Intel Q57 Intel Q87 Intel X99 BIOS name and version Dell A16 (05/28/2014) Dell A12 (05/06/2015) Dell 0.2.10 (06/18/2015)
- 15. A Principled Technologies report 15Get numerous benefits by upgrading to new Dell OptiPlex 7040 SFF and MT desktops System Dell OptiPlex 980 MT (legacy) Dell OptiPlex 9020 MT (recent) Dell OptiPlex 7040 MT (latest) Memory module(s) Vendor and model number Kingston KTW149-ELD Samsung M378B5173EB0-CK0 Micron MTA8ATF51264AZ- 2G1A1 Type PC3-10700 PC3-12800 PC4-2133P Speed (MHz) 1,333 1,600 2,133 Speed running in the system (MHz) 1,333 1,600 2,133 Timing/Latency (tCL-tRCD-tRP- tRASmin) 9-9-9-24 11-11-11-28 15-15-15-37 Size (MB) 1,024 4,096 4096 Number of memory module(s) 4 2 2 Total amount of system RAM (GB) 4 8 8 Channel (single/dual) Dual Dual Dual Hard disk Vendor and model number Western Digital WDC WD2500AAKX- 00ERMA0 Seagate ST500DM0 02- 1BD142 Seagate ST500LM0 21- 1KJ152 Number of disks in system 1 1 1 Size (GB) 250 500 500 Buffer size (MB) 16 16 32 RPM 7,200 7,200 7,200 Type SATA 6.0 Gb/s SATA 6.0 Gb/s SATA 6.0 Gb/s Controller Intel ICH8R/ICH9R/ICH10R/D O SATA RAID Controller Intel Desktop/Workstation/S erver Express Chipset SATA RAID Controller Intel ICH8R/ICH9R/ICH10R/D O SATA RAID Controller Driver Intel 8.6.2.1315 (8/6/2010) Intel 13.1.0.1058 (5/2/2014) Intel 8.6.2.1315 (8/6/2010) Operating system Name Windows 7 Professional Windows 7 Professional Windows 7 Professional Build number 7601 7601 7601 Service Pack 1 1 1 File system NTFS NTFS NTFS Kernel ACPI x64-based PC ACPI x64-based PC ACPI x64-based PC Language English English English Microsoft DirectX version DirectX 11 DirectX 11 DirectX 11 Graphics Vendor and model number Intel HD Graphics Intel HD Graphics 4600 Intel HD Graphics 530 Type Integrated Integrated Integrated Chipset Intel HD Graphics Intel HD Graphics 4600 Intel HD Graphics 530 BIOS version 2080.16 1025.14 1022.7 Total available graphics memory (MB) 1,696 1,696 1,824 Dedicated video memory (MB) 64 64 192 System video memory (MB) 0 0 0
- 16. A Principled Technologies report 16Get numerous benefits by upgrading to new Dell OptiPlex 7040 SFF and MT desktops System Dell OptiPlex 980 MT (legacy) Dell OptiPlex 9020 MT (recent) Dell OptiPlex 7040 MT (latest) Shared system memory (MB) 1,632 1,632 1,632 Resolution 1,280 × 1,024 1,280 × 1,024 1,280 × 1,024 Driver Intel 8.15.10.2827 (7/31/2012) Intel 10.18.14.4170 (3/16/2015) Intel 10.18.15.4274 (08/13/2015) Sound card/subsystem Vendor and model number Realtek High Definition Audio Realtek High Definition Audio Realtek High Definition Audio Driver Realtek 6.0.1.5876 (11/16/2009) Realtek 6.0.1.6053 (10/16/2014) Realtek 6.0.1.6075 (6/30/2015) Ethernet Vendor and model number Intel 82578DM Gigabit Network Connection Intel Ethernet Connection I217-LM Intel Ethernet Connection I219-LM Driver Intel 11.6.92.0 (12/3/2010) Intel 12.12.80.19 (09/29/2014) Intel 12.13.17.1 (05/19/2015) Optical drive(s) Vendor and model number TSSTcorp TS-L633C TSSTcorp SN-208FB TSSTcorp SU-108GB Type DVD-RW DVD-RW DVD-ROM USB ports Number 8 10 10 Type 8 × USB 2.0 4 × USB 3.0, 6 × USB 2.0 6 × USB 3.0, 4 × USB 2.0 Other eSATA, Display Port, Serial Port 2 × Display Port, Serial Port Media Card Reader, HDMI, 2 × Display Port, Serial Port Figure 17: Detailed information for the MT test systems.
- 17. A Principled Technologies report 17Get numerous benefits by upgrading to new Dell OptiPlex 7040 SFF and MT desktops APPENDIX B – HOW WE TESTED To show the advantages of the new Dell OptiPlex systems, we created scenarios to test the performance, energy efficiency, and acoustics of each system. For performance, we used SYSmark 2014, CINEBENCH R15 (single-threaded and multi-threaded), and 3DMark. To capture energy efficiency, we measured power consumption while idle and while running PassMark BurnInTest Professional to simulate a system under load. We reset all BIOS settings to default. All systems came preinstalled with Windows 7 x64 Professional. Installing the benchmarks SYSmark 2014 SYSmark 2014 installs the following applications, which its test scripts employ: Adobe® Acrobat® XI Pro Adobe Photoshop® CS6 Extended Adobe Premiere® Pro CS6 Google Chrome™ Microsoft Excel® 2013 Microsoft OneNote® 2013 Microsoft Outlook® 2013 Microsoft PowerPoint® 2013 Microsoft Word 2013 Trimble® SketchUp® Pro 2013 WinZip® Pro 17.5 If any of these applications are already on the system under test, they will cause problems with the benchmark due to software conflicts. To avoid any such issues, before we installed the benchmark, we uninstalled all conflicting pre- installed software applications, including different versions of any of the programs SYSmark 2014 uses. Setting up the test 1. Disable the User Account Control. a. Click Start and search for User Accounts. Click User Accounts. b. At the User Accounts screen, click Change User Account Control Settings. c. Click the user account that will be used for testing. d. Click Change User Account Control settings. e. Using the slider, change the setting to Never notify and click OK. f. Restart the computer. 2. Purchase and install SYSmark 2014 v1.0.1.21 with default settings from bapco.com/products/sysmark-2014. 3. Launch SYSmark 2014 by double-clicking the desktop icon, and select Configuration. 4. Select all options, and click Save. CINEBENCH R15 – Setting up the test 1. Download the CINEBENCH R15 zipped Windows package from www.maxon.net/products/cinebench/overview.html. 2. Unzip the CINEBENCH R15 Windows package to the desktop. 3. Launch CINEBENCH by double-clicking the CINEBENCH Windows 64 Bit icon inside the unzipped directory. 4. Click Agree to the EULA. 5. Select FileAdvanced benchmark. Verify that OpenGL®, CPU, and CPU (Single Core) are selected. 6. Exit CINEBENCH. 3DMark – Setting up the test 1. Download 3DMark from www.futuremark.com/benchmarks/3dmark/all.
- 18. A Principled Technologies report 18Get numerous benefits by upgrading to new Dell OptiPlex 7040 SFF and MT desktops 2. Install 3DMark with the default options by double-clicking the 3DMark installer.exe file. 3. Launch 3DMark by double-clicking on the 3DMark desktop icon. Enter the registration code, and click Register. 4. Exit 3DMark. Measuring performance SYSmark 2014 – Running the test 1. Launch SYSmark 2014 by double-clicking the desktop icon. 2. Make sure Office Productivity, Media Creation, and Data/Financial Analysis are selected. 3. Enter a Project name. 4. Select 3 Iterations, check the box beside Conditioning Run and beside Process Idle Tasks, and click Run Benchmark. 5. When the benchmark completes and the main SYSmark 2014 menu appears, click Save FDR to create a report. CINEBENCH R15 – Running the test 1. Boot the system and wait 5 minutes before running the test. 2. Double-click the CINEBENCH Windows 64 Bit icon inside the unzipped directory. 3. Select FileRun all selected tests. 4. When the benchmark run completes, record the results. 5. Shut down the system. 6. Complete steps 1 through 5 two more times, and report the average of the three runs. 3DMark v1.5.893 – Running the test 1. Boot the system and wait 5 minutes before running the test. 2. Double-click the 3DMark desktop icon to launch the benchmark. 3. On the Benchmarks screen, run the Fire Strike test. 4. Once complete, record the results. 5. On the Benchmarks screen, run the Sky Diver test. 6. Once complete, record the results. 7. On the Benchmarks screen, run the Cloud Gate test. 8. Once complete, record the results. 9. On the Benchmarks screen, run the Ice Storm Extreme test. 10. Once complete, record the results. 11. Perform steps 1 through 10 two more times, and report the average of the three runs. Measuring power efficiency To record each workstation’s power consumption during each test, we used an Extech Instruments® (www.extech.com) 380803 Power Analyzer/Datalogger. We connected the power cord from the server under test to the Power Analyzer’s output load power outlet. We then plugged the power cord from the Power Analyzer’s input voltage connection into a power outlet. We used the Power Analyzer’s Data Acquisition Software (version 2.11) to capture all recordings. We installed the software on a separate Intel processor-based PC, which we connected to the Power Analyzer via an RS-232 cable. We captured power consumption at one-second intervals. We then recorded the power usage (in watts) for each system during the testing at one-second intervals. To compute the average power usage, we averaged the power usage during the time the system was producing its peak performance results.
- 19. A Principled Technologies report 19Get numerous benefits by upgrading to new Dell OptiPlex 7040 SFF and MT desktops Measuring power while idle Setting up the test 1. Set the power plan to the manufacturer’s default setting. Set the display brightness to 100 percent: a. Click Start. b. In the Start menu’s quick search field, type Power Options c. Move the Screen brightness slider all the way to the right. 2. Set the remaining power plan settings as follows: Dim the display: Never Turn off the display: Never Put the computer to sleep: Never 3. Disable the screen saver. 4. Connect the power cord from the workstation to the Extech Instruments 380803 Power Analyzer’s DC output load power outlet. 5. Plug the power cord from the Power Analyzer’s DC input voltage connection into a power outlet. 6. Connect a separate host computer to the Power Analyzer using an RS-232 cable. This computer will monitor and collect the power measurement data. 7. Turn on the Extech Power Analyzer by pressing the green On/Off button. 8. Turn on the host computer. 9. Insert the Extech software installation CD into the host computer, and install the software. 10. After installation, launch the Extech Power Analyzer software, and configure the correct COM port. Running the test 1. Boot the system and bring up an elevated command prompt: a. Select the Windows Start orb. b. Type cmd and press Control-Shift-Enter. 2. Type Cmd.exe /c start /wait Rundll32.exe advapi32.dll,ProcessIdleTasks Do not interact with the system until the command completes. 3. After the command completes, wait 5 minutes before running the test. 4. Begin recording power with the Extech Power Analyzer. 5. Allow the workstation to sit idle for 1 hour. 6. After 1 hour, stop the Power Analyzer data logger. The Power Analyzer creates a CSV file as it collects that data. 7. Use the Power Analyzer CSV to calculate the average power draw in watts during the test. 8. Power the workstation off for 1 hour. 9. Complete steps 1 through 8 two more times. Measuring power while under load Setting up the test 1. Download PassMark BurnInTest Professional 7.0 from www.passmark.com/products/bit.htm. 2. Double-click bitpro_x64.exe to run setup. 3. At the Welcome screen, click Next. 4. Accept the license agreement, and click Next. 5. At the Choose Install Location screen, accept the default location of C:Program FilesBurnInTest, and click Next. 6. At the Select Start Menu Folder screen, click Next. 7. At the Ready to Install screen, click Install. 8. At the Completing the BurnInTest Setup Wizard screen, deselect View Readme.txt, and click Finish to launch BurnInTest. 9. At the Purchasing information screen, copy and paste the Username and key, and click Continue. 10. At the Key accepted screen, click OK. 11. Select Test selection and duty cycles from the Configuration menu item.
- 20. A Principled Technologies report 20Get numerous benefits by upgrading to new Dell OptiPlex 7040 SFF and MT desktops 12. Select CPU, RAM, Video, 2D Graphics, 3D Graphics, and Disk(s), and deselect all other subsystems. 13. Set load on all to 75, and click OK. 14. Select Test Preferences from the Configuration menu item, and set or verify the following by clicking on each tab: Disk: select C: drive Logging: select Turn automatic logging on 2D Graphics: select All available Video Memory 3D Graphics: use defaults CPU: use defaults Running the test 1. Boot the system, and launch PassMark BurnInTest by double-clicking the desktop icon. 2. Bring up an elevated command prompt: a. Select the Windows Start orb. b. Type cmd and press Control-Shift-Enter. 3. Type Cmd.exe /c start /wait Rundll32.exe advapi32.dll,ProcessIdleTasks Do not interact with the system until the command completes. 4. After the command completes, wait 10 minutes before running the test. 5. Click Start Selected Tests in the BurnInTest V7.0 Pro screen. 6. Begin recording power with the Extech Power Analyzer. 7. After 1 hour, stop the Power Analyzer data logger. The Power Analyzer creates a CSV file as it collects that data. 8. Use the Power Analyzer CSV to calculate the average power draw in watts during the test. 9. Power the workstation off for 1 hour. 10. Complete steps 1 through 9 two more times. Measuring acoustics Test requirements Extech SDL600 Sound Level Meter/Datalogger with SD™ card PassMark BurnInTest Professional Measuring acoustics of the workstation while idle Setting up the test 1. Place the workstation, mouse, keyboard, and display in a windowless, soundproofed professional sound booth. 2. Set the Extech SDL600 on a tripod so that it is 3 feet in front of and 2 feet above the workstation. Running the test 1. Boot the system and bring up an elevated command prompt: a. Select the Windows Start orb. b. Type cmd and press Control-Shift-Enter. 2. Type Cmd.exe /c start /wait Rundll32.exe advapi32.dll,ProcessIdleTasks Do not interact with the system until the command completes. 3. After the command completes, wait 5 minutes before running the test. 4. Start the Extech SDL600 Sound Level Meter/Datalogger and allow the workstation to sit idle for 1 hour. 5. After 1 hour, stop the Extech SDL600. 6. Power the workstation off for 10 minutes. 7. Copy the log file from the Extech SDL600 SD card. 8. Complete steps 1 through 7 two more times.
- 21. A Principled Technologies report 21Get numerous benefits by upgrading to new Dell OptiPlex 7040 SFF and MT desktops Measuring acoustics of the workstation while under load Setting up the test Ensure that PassMark BurnInTest Professional 7.0 is installed on your system, and configure it as described during the testing for power while under load. Running the test 1. Boot the system, and launch PassMark BurnInTest by double-clicking the desktop icon. 2. Bring up an elevated command prompt: Select the Windows Start orb. Type cmd and press Control-Shift-Enter. 3. Type Cmd.exe /c start /wait Rundll32.exe advapi32.dll,ProcessIdleTasks Do not interact with the system until the command completes. 4. After the command completes, wait 10 minutes before running the test. 5. Click Start Selected Tests in the BurnInTest V7.0 Pro screen and start the Extech SDL600 Sound Level Meter/Datalogger. 6. After 1 hour, stop the Extech SDL600. 7. Power the workstation off for 10 minutes. 8. Copy the log file from the Extech SDL600 SD card. 9. Complete steps 1 through 8 two more times.
- 22. A Principled Technologies report 22Get numerous benefits by upgrading to new Dell OptiPlex 7040 SFF and MT desktops APPENDIX C – BENCHMARK INFORMATION About MAXON CINEBENCH R15 CINEBENCH is a free, real-world, cross-platform test suite designed to evaluate and compare the CPU and graphics performance across various systems and platforms. Based on MAXON CINEMA 4D® software, which creates 3D content, the benchmark consists of two main components: the graphics-card performance test and the CPU performance test. CINEBENCH uses the processing power of a system to render 3D scenes that stress all available processor cores, and reports performance in points (pts). Higher scores are better, as they indicate a faster processor. To learn more, visit www.maxon.net. About BAPCo SYSmark 2014 According to BAPCo, “SYSmark 2014 is an application-based benchmark that reflects usage patterns of business users in the areas of office productivity, media creation, and data/financial analysis.” The benchmark features notable applications from these fields. SYSmark 2014 generates a score from the times the tested system takes to complete each individual operation in each scenario. For more information on this benchmark, see bapco.com/products/sysmark-2014. About Futuremark 3DMark v1.5.915 Futuremark 3DMark v1.5.915 is a collection of benchmarks designed to rate the graphics performance of smartphones, tablets, notebooks, laptops, desktops, or high-performance gaming PCs. 3DMark includes benchmarks designed for Windows, Apple®, and Android™ devices. The Ice Storm portion of 3DMark includes 720p graphics tests to measure GPU performance and a physics test to stress CPU performance. Ice Storm is available for Windows, iOS, and Android smart phones and tablets. It uses a DirectX 11 feature level 9 for Windows and OpenGL ES 2.0 for iOS and Android systems. Ice Storm Extreme increases the rendering resolution to 1080p and uses higher quality textures and post-processing effects in the Graphics tests. For more information on 3DMark, see www.futuremark.com/benchmarks/3dmark.
- 23. A Principled Technologies report 23Get numerous benefits by upgrading to new Dell OptiPlex 7040 SFF and MT desktops APPENDIX D – DETAILED BENCHMARK RESULTS We ran the three benchmarks on all three SFF models, repeating each test three times. For our calculations, we selected the median of the three results for each benchmark and system. We calculated the percentage wins for the Dell OptiPlex 7040 SFF versus the recent-generation Dell OptiPlex 9020 SFF and the legacy Dell OptiPlex 980 SFF on each benchmark. The Dell OptiPlex 7040 outperformed the Dell OptiPlex 9020 SFF and legacy 980 SFF on all three benchmarks. Figure 18 shows our median benchmark results. We then ran the three benchmarks on all three MT models, repeating each test three times. For our calculations, we selected the median of the three results for each benchmark and system. We calculated the percentage wins for the Dell OptiPlex 7040 MT versus the recent-generation Dell OptiPlex 9020 MT and the legacy Dell OptiPlex 980 MT on each benchmark. The Dell OptiPlex 7040 outperformed the Dell OptiPlex 9020 MT and legacy 980 MT on all three benchmarks. Figure 19 shows our median benchmark results. Dell OptiPlex 7040 SFF Recent-gen SFF Percent win for Dell OptiPlex 7040 SFF Legacy SFF Percent win for Dell OptiPlex 7040 SFF SYSmark (Overall Rating) 1,539 1,534 0.3% 902 70.6% CINEBENCH – Graphics (FPS) 44.4 30.5 45.8% 1.7 2,513.5% CINEBENCH – CPU (All cores) 545.3 534.3 2.1% 245.0 122.6% CINEBENCH – CPU (Single core) 151.7 146.8 3.3% 97.0 56.4% 3DMark Fire Strike (overall) 925 729 26.9% 3DMark Sky Diver (overall) 4,097 3,331 23.0% 3DMark Cloud Gate (overall) 7,669 6,686 14.7% 750 922.9% 3DMark Ice Storm Extreme (overall) 48,037 37,118 29.4% 10,992 337.0% Figure 18: System performance improvement based on our benchmark testing. Dell OptiPlex 7040 MT Recent-gen MT Percent win for Dell OptiPlex 7040 MT Legacy MT Percent win for Dell OptiPlex 7040 MT SYSmark (Overall Rating) 1,528 1,485 2.9% 902 69.4% CINEBENCH – Graphics (FPS) 44.7 30.4 47.1% 1.7 2,510.5% CINEBENCH – CPU (All cores) 545.7 534.3 2.1% 247.0 120.9% CINEBENCH – CPU (Single core) 152.0 146.3 3.9% 98.8 53.8% 3DMark Fire Strike (overall) 925 728 27.0% 3DMark Sky Diver (overall) 4,098 3,334 22.9% 3DMark Cloud Gate (overall) 7,664 6,714 14.1% 751 920.9% 3DMark Ice Storm Extreme (overall) 48,052 36,831 30.5% 10,885 341.5% Figure 19: System performance improvement based on our benchmark testing.
- 24. A Principled Technologies report 24Get numerous benefits by upgrading to new Dell OptiPlex 7040 SFF and MT desktops APPENDIX E – HOW WE CALCULATED Acoustics percentages We calculated the difference in perceived volume with the two workstations using the following formula for sound level change:3 ∆ 𝐿 = 10 ∙ 𝑙𝑜𝑔2𝑥 = 33.22 ∙ log(𝑥) The change in sound level (L) is related to the ratio for loudness (or volume) by using the calculated L as follows: 𝑥 = 10 ∆L 33.22 = 2 ∆𝐿 10 For example, if the level change (L) is 0.2dB, the ratio for loudness is 1.014x, or 1.4 percent louder. Converting watts to BTU/hr The power (P) in BTUs per hour (BTU/hr) is equal to 3.412141633 times the power (P) in watts (W):4 𝑃(𝐵𝑇𝑈/ℎ𝑟) = 3.412141633 × 𝑃(𝑊) So 1W is equal to 3.412141633 BTU/hr. 3 www.sengpielaudio.com/calculator-levelchange.htm 4 www.rapidtables.com/convert/power/Watt_to_BTU.htm
- 25. A Principled Technologies report 25Get numerous benefits by upgrading to new Dell OptiPlex 7040 SFF and MT desktops ABOUT PRINCIPLED TECHNOLOGIES Principled Technologies, Inc. 1007 Slater Road, Suite 300 Durham, NC, 27703 www.principledtechnologies.com We provide industry-leading technology assessment and fact-based marketing services. We bring to every assignment extensive experience with and expertise in all aspects of technology testing and analysis, from researching new technologies, to developing new methodologies, to testing with existing and new tools. When the assessment is complete, we know how to present the results to a broad range of target audiences. We provide our clients with the materials they need, from market-focused data to use in their own collateral to custom sales aids, such as test reports, performance assessments, and white papers. Every document reflects the results of our trusted independent analysis. We provide customized services that focus on our clients’ individual requirements. Whether the technology involves hardware, software, Web sites, or services, we offer the experience, expertise, and tools to help our clients assess how it will fare against its competition, its performance, its market readiness, and its quality and reliability. Our founders, Mark L. Van Name and Bill Catchings, have worked together in technology assessment for over 20 years. As journalists, they published over a thousand articles on a wide array of technology subjects. They created and led the Ziff-Davis Benchmark Operation, which developed such industry-standard benchmarks as Ziff Davis Media’s Winstone and WebBench. They founded and led eTesting Labs, and after the acquisition of that company by Lionbridge Technologies were the head and CTO of VeriTest. Principled Technologies is a registered trademark of Principled Technologies, Inc. All other product names are the trademarks of their respective owners. Disclaimer of Warranties; Limitation of Liability: PRINCIPLED TECHNOLOGIES, INC. HAS MADE REASONABLE EFFORTS TO ENSURE THE ACCURACY AND VALIDITY OF ITS TESTING, HOWEVER, PRINCIPLED TECHNOLOGIES, INC. SPECIFICALLY DISCLAIMS ANY WARRANTY, EXPRESSED OR IMPLIED, RELATING TO THE TEST RESULTS AND ANALYSIS, THEIR ACCURACY, COMPLETENESS OR QUALITY, INCLUDING ANY IMPLIED WARRANTY OF FITNESS FOR ANY PARTICULAR PURPOSE. ALL PERSONS OR ENTITIES RELYING ON THE RESULTS OF ANY TESTING DO SO AT THEIR OWN RISK, AND AGREE THAT PRINCIPLED TECHNOLOGIES, INC., ITS EMPLOYEES AND ITS SUBCONTRACTORS SHALL HAVE NO LIABILITY WHATSOEVER FROM ANY CLAIM OF LOSS OR DAMAGE ON ACCOUNT OF ANY ALLEGED ERROR OR DEFECT IN ANY TESTING PROCEDURE OR RESULT. IN NO EVENT SHALL PRINCIPLED TECHNOLOGIES, INC. BE LIABLE FOR INDIRECT, SPECIAL, INCIDENTAL, OR CONSEQUENTIAL DAMAGES IN CONNECTION WITH ITS TESTING, EVEN IF ADVISED OF THE POSSIBILITY OF SUCH DAMAGES. IN NO EVENT SHALL PRINCIPLED TECHNOLOGIES, INC.’S LIABILITY, INCLUDING FOR DIRECT DAMAGES, EXCEED THE AMOUNTS PAID IN CONNECTION WITH PRINCIPLED TECHNOLOGIES, INC.’S TESTING. CUSTOMER’S SOLE AND EXCLUSIVE REMEDIES ARE AS SET FORTH HEREIN.