call girls in Sant Nagar (DELHI) 🔝 >༒9953056974 🔝 genuine Escort Service 🔝✔️✔️
16 June Daily market report
1. Page 1 of 5
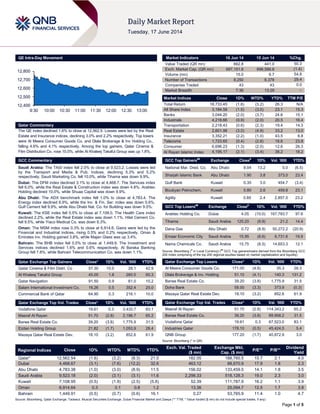
QE Intra-Day Movement
Qatar Commentary
The QE index declined 1.6% to close at 12,562.5. Losses were led by the Real
Estate and Insurance indices, declining 3.0% and 2.2% respectively. Top losers
were Al Meera Consumer Goods Co. and Dlala Brokerage & Inv Holding Co.,
falling 4.6% and 4.1% respectively. Among the top gainers, Qatar Cinema &
Film Distribution Co. rose 10.0%, while Al Khaleej Takaful Group was up 1.8%.
GCC Commentary
Saudi Arabia: The TASI index fell 2.0% to close at 9,523.2. Losses were led
by the Transport and Media & Pub. Indices, declining 5.3% and 5.2%
respectively. Saudi Marketing Co. fell 10.0%, while Tihama was down 9.9%.
Dubai: The DFM index declined 3.1% to close at 4,468.7. The Services index
fell 6.0%, while the Real Estate & Construction index was down 4.8%. Arabtec
Holding declined 10.0%, while Shuaa Capital was down 9.9%.
Abu Dhabi: The ADX benchmark index fell 1.0% to close at 4,783.4. The
Energy index declined 6.9%, while the Inv. & Fin. Ser. index was down 5.6%.
Gulf Cement fell 9.9%, while Abu Dhabi Nat. Co. for Building was down 9.5%.
Kuwait: The KSE index fell 0.5% to close at 7,109.0. The Health Care index
declined 2.2%, while the Real Estate index was down 1.1%. Hilal Cement Co.
fell 9.5%, while Yiaco Medical Co. was down 8.3%.
Oman: The MSM index rose 0.3% to close at 6,914.6. Gains were led by the
Financial and Industrial indices, rising 0.5% and 0.2% respectively. Oman &
Emirates Inv. Holding gained 3.8%, while Majan Glass was up 3.4%.
Bahrain: The BHB index fell 0.5% to close at 1,449.9. The Investment and
Services indices declined 1.6% and 0.6% respectively. Al Baraka Banking
Group fell 7.8%, while Bahrain Telecommunication Co. was down 1.1%.
Qatar Exchange Top Gainers Close* 1D% Vol. ‘000 YTD%
Qatar Cinema & Film Distri. Co 57.30 10.0 28.1 42.9
Al Khaleej Takaful Group 45.00 1.8 260.5 60.3
Qatar Navigation 91.50 0.9 61.0 10.2
Salam International Investment Co. 16.26 0.5 352.4 25.0
Commercial Bank of Qatar 64.90 0.3 216.1 10.0
Qatar Exchange Top Vol. Trades Close* 1D% Vol. ‘000 YTD%
Vodafone Qatar 19.61 0.3 3,433.7 83.1
Masraf Al Rayan 51.70 (2.8) 2,196.7 65.2
Barwa Real Estate Co. 39.20 (3.8) 1,775.9 31.5
Ezdan Holding Group 21.82 (1.7) 1,053.9 28.4
Mazaya Qatar Real Estate Dev. 18.10 (3.2) 852.6 61.9
Market Indicators 16 Jun 14 15 Jun 14 %Chg.
Value Traded (QR mn) 662.8 441.0 50.3
Exch. Market Cap. (QR mn) 687,151.6 696,586.8 (1.4)
Volume (mn) 15.0 9.7 54.8
Number of Transactions 8,250 6,378 29.4
Companies Traded 43 43 0.0
Market Breadth 7:36 13:29 –
Market Indices Close 1D% WTD% YTD% TTM P/E
Total Return 18,733.45 (1.6) (3.2) 26.3 N/A
All Share Index 3,184.59 (1.5) (3.0) 23.1 15.3
Banks 3,044.20 (2.0) (3.7) 24.6 15.1
Industrials 4,218.66 (0.9) (2.0) 20.5 16.4
Transportation 2,218.43 (0.6) (2.3) 19.4 14.3
Real Estate 2,601.98 (3.0) (4.9) 33.2 13.0
Insurance 3,352.21 (2.2) (1.0) 43.5 8.8
Telecoms 1,723.65 (0.4) (2.8) 18.6 23.8
Consumer 6,696.23 (1.3) (2.0) 12.6 26.3
Al Rayan Islamic Index 4,195.17 (2.1) (3.4) 38.2 18.2
GCC Top Gainers##
Exchange Close#
1D% Vol. ‘000 YTD%
National Mar. Dred. Co. Abu Dhabi 8.04 13.2 5.0 (6.5)
Sharjah Islamic Bank Abu Dhabi 1.90 3.8 373.0 23.4
Gulf Bank Kuwait 0.35 3.0 454.7 (3.4)
Boubyan Petrochem. Kuwait 0.80 2.6 459.8 23.1
Agility Kuwait 0.85 2.4 2,857.0 23.2
GCC Top Losers##
Exchange Close#
1D% Vol. ‘000 YTD%
Arabtec Holding Co. Dubai 4.05 (10.0) 167,783.7 97.6
Tihama Saudi Arabia 125.20 (9.9) 21.2 14.4
Dana Gas Abu Dhabi 0.72 (8.9) 50,272.2 (20.9)
Emaar Economic City Saudi Arabia 15.95 (8.6) 6,731.6 19.9
Nama Chemicals Co. Saudi Arabia 15.75 (8.5) 14,653.3 12.1
Source: Bloomberg (
#
in Local Currency) (
##
GCC Top gainers/losers derived from the Bloomberg GCC
200 Index comprising of the top 200 regional equities based on market capitalization and liquidity)
Qatar Exchange Top Losers Close* 1D% Vol. ‘000 YTD%
Al Meera Consumer Goods Co. 171.00 (4.6) 35.3 28.3
Dlala Brokerage & Inv. Holding 51.10 (4.1) 140.3 131.2
Barwa Real Estate Co. 39.20 (3.8) 1,775.9 31.5
Doha Bank 58.00 (3.3) 373.9 (0.3)
Mazaya Qatar Real Estate Dev. 18.10 (3.2) 852.6 61.9
Qatar Exchange Top Val. Trades Close* 1D% Val. ‘000 YTD%
Masraf Al Rayan 51.70 (2.8) 114,343.2 65.2
Barwa Real Estate Co. 39.20 (3.8) 69,958.2 31.5
Vodafone Qatar 19.61 0.3 67,523.0 83.1
Industries Qatar 178.10 (0.5) 45,424.5 5.4
QNB Group 177.20 (1.7) 40,872.9 3.0
Source: Bloomberg (* in QR)
Regional Indices Close 1D% WTD% MTD% YTD%
Exch. Val. Traded
($ mn)
Exchange Mkt.
Cap. ($ mn)
P/E** P/B**
Dividend
Yield
Qatar* 12,562.54 (1.6) (3.2) (8.3) 21.0 182.05 188,760.5 15.7 2.1 4.0
Dubai 4,468.67 (3.1) (7.6) (12.2) 32.6 463.12 88,670.9 17.9 1.8 2.3
Abu Dhabi 4,783.38 (1.0) (3.0) (8.9) 11.5 156.02 133,459.5 14.1 1.8 3.5
Saudi Arabia 9,523.18 (2.0) (3.1) (3.1) 11.6 2,298.33 518,128.3 19.0 2.3 3.0
Kuwait 7,108.95 (0.5) (1.9) (2.5) (5.8) 52.39 111,787.9 16.2 1.1 3.9
Oman 6,914.64 0.3 0.1 0.8 1.2 13.36 25,094.7 12.5 1.7 3.8
Bahrain 1,449.91 (0.5) (0.7) (0.6) 16.1 0.27 53,765.9 11.4 1.0 4.7
Source: Bloomberg, Qatar Exchange, Tadawul, Muscat Securities Exchange, Dubai Financial Market and Zawya (** TTM; * Value traded ($ mn) do not include special trades, if any)
12,400
12,500
12,600
12,700
12,800
9:30 10:00 10:30 11:00 11:30 12:00 12:30 13:00
2. Page 2 of 5
Qatar Market Commentary
The QE index declined 1.6% to close at 12,562.5. The Real
Estate and Insurance indices led the losses. The index fell on the
back of selling pressure from non-Qatari shareholders despite
buying support from Qatari shareholders.
Al Meera Consumer Goods and Dlala Brokerage & Inv. Holding
Co. were the top losers, falling 4.6% and 4.1% respectively.
Among the top gainers, Qatar Cinema & Film Distribution Co.
rose 10.0%, while Al Khaleej Takaful Group was up 1.8%.
Volume of shares traded on Monday rose by 54.8% to 15.0mn
from 9.7mn on Sunday. However, as compared to the 30-day
moving average of 26.1mn, volume for the day was 42.7% lower.
Vodafone Qatar and Masraf Al Rayan were the most active
stocks, contributing 23.0% and 14.7% to the total volume
respectively.
Source: Qatar Exchange (* as a % of traded value)
Earnings and Global Economic Data
Earnings Releases
Company Market Currency
Revenue
(mn)1Q2014
% Change
YoY
Operating Profit
(mn) 1Q2014
% Change
YoY
Net Profit (mn)
1Q2014
% Change
YoY
United Kaipara Dairies Co.
(UNIKAI)
Dubai AED 75.2 16.6% – – -13.8 NA
Source: Company data, DFM, ADX, MSM
Global Economic Data
Date Market Source Indicator Period Actual Consensus Previous
06/16 US Federal Reserve Industrial Production MoM May 0.60% 0.50% -0.30%
06/16 US Federal Reserve Manufacturing (SIC) Production May 0.60% 0.60% -0.10%
06/16 US NAHB NAHB Housing Market Index June 49.0 47.0 45.0
06/16 EU Eurostat CPI MoM May -0.10% -0.10% 0.20%
06/16 EU Eurostat CPI YoY May 0.50% 0.50% 0.50%
06/16 EU Eurostat CPI Core YoY May 0.70% 0.70% 0.70%
06/16 UK Rightmove Rightmove House Prices MoM June 0.10% – 3.60%
06/16 UK Rightmove Rightmove House Prices YoY June 7.70% – 8.90%
Source: Bloomberg (s.a. = seasonally adjusted; n.s.a. = non-seasonally adjusted; w.d.a. = working day adjusted)
News
Qatar
QIB-UK offers property investment opportunities in London
– Qatar Islamic Bank’s (QIBK) wholly owned subsidiary, QIB-
UK, is offering unique real estate investment opportunities for
premium clients, who seek to purchase properties in London.
QIB-UK has assembled a team of real estate specialists who will
help in ensuring clients are well placed to get the best real
estate opportunities in the market. The bank’s network gives
clients an early access to exclusive residential real estate
opportunities in the London real estate market. (QE)
Qatar Steel cuts energy use, improves safety record – Qatar
Steel, a subsidiary of Industries Qatar (IQCD) has cut its energy
consumption by 2.4% and its total greenhouse gas emissions by
3.3%, while increasing the overall productivity by 2.5%.
Moreover, the company has improved its safety performance
with a 31% reduction in the reportable injury rate for employees
and zero fatalities among its employees and contractors. Qatar
Steel enjoyed another year of low employee attrition of 3.6%,
and also introduced several waste management initiatives such
as recycling by-products generated during production. (Gulf-
Times.com)
QPMC appoints new CEO – Qatar Primary Materials Company
(QPMC) has announced the appointment of Eisa Al-Hammadi
as the firm’s new CEO with effect from June 9, 2014. Al-
Hammadi earned his civil engineering degree from the
University of Qatar and has more than 14 years of experience in
the engineering sector, where he held several management
positions, including Director of Engineering Projects at Qatar
Development Bank. (Gulf-Times)
QA’s A380 deliveries delayed again – Qatar Airways’ (QA)
CEO, Akbar Al Baker said that the delivery of the first three
Airbus A380 Superjumbos has been further delayed by several
weeks due to unresolved cabin issues. The delivery had
originally been expected around the end of May 2014, but was
pushed back after the airline apparently rejected the aircraft
during a routine pre-delivery inspection. (Reuters)
Kahramaa achieves safety milestone – The Qatar General
Electricity & Water Corporation (Kahramaa) has achieved a new
safety milestone in 2014. The mega utility corporation clocked
8.2mn work hours without any lost time injury (LTI) between
January and May 2014. The LTI figure includes Kahramaa and
its contractors. Kahramaa’s total work hours without LTI for the
period was 2.7mn work hours, while its contractors achieved
5.5mn work hours without LTI. (Gulf-Times.com)
International
IMF cuts US 2014 growth outlook to 2% – The International
Monetary Fund has cut its growth forecast for the US economy
for this year and stated that the Federal Reserve may have
scope to keep its interest rates at zero for longer than investors
expect. The IMF now sees the world’s largest economy growing
Overall Activity Buy %* Sell %* Net (QR)
Qatari 68.38% 58.03% 68,514,162.32
Non-Qatari 31.62% 41.96% (68,514,162.32)
3. Page 3 of 5
2% this year, down from an April estimate of 2.8%. The IMF left
its 2015 prediction unchanged at 3%, and said it does not
expect the US to see full employment until the end of 2017,
amid low inflation. The fund stated that the cut was largely linked
to the economy’s contraction in the first quarter, when the harsh
winter added to other factors such as a drawdown in inventories,
a sluggish housing market and slower demand. The IMF also
lowered its prediction for the economy’s potential growth in
future years to reflect the effects of an aging population and
slower productivity growth. It now sees average potential growth
of 2%, compared with 3% in the 50 years through 2007. Last
year its projections were 2.3% in 2015-2016 and 2.4% in 2017-
2018. (Bloomberg)
Sturdy manufacturing data bolster US growth outlook; new
Fed members sworn in – Manufacturing output in the US rose
in May 2014 and factory activity in the New York state
accelerated sharply this month, buoying hopes for a strong
rebound in economic growth this quarter. The brightening
growth outlook was further boosted by the rising confidence
among homebuilders this month, a good omen for the struggling
housing market. The US Federal Reserve said that factory
production increased 0.6% last month as output rose across a
swath of industries and also said output had slipped 0.1% in
April, not as deeply as it had previously thought. Meanwhile,
Stanley Fischer has been sworn in as the Vice Chair of the
Federal Reserve and Lael Brainard took the oath of office to join
the central bank's board of governors. Further, the current Fed
board member Jerome Powell was sworn in for a new 14-year
term. The three members were confirmed by the Senate last
week. (Reuters)
Eurozone price inflation hits trough in May – A further
slowdown in the Eurozone’s inflation in May was confirmed on
Monday, as the cost of telecommunication and food kept prices
low, confirming a problem that the European Central Bank had
recently sought to stem. Data from the EU's statistics office
Eurostat found that consumer prices across the 18 Eurozone
countries rose by 0.5% YoY in May, keeping them within the
'danger zone' of below 1%. Prices fell by 0.1% MoM in May, with
the cost of services down by 0.2% as compared to April. This
data confirms a problematic pricing trend that weighs down
debt-strapped countries, which recently prompted the ECB to
act. In June, the ECB became the first major central bank to
introduce negative deposit rates – charging banks to park funds
overnight. It also launched ultra-cheap four-year loans for banks
in order to boost lending to companies. (Reuters)
Russia cuts gas to Ukraine while maintaining flow to EU –
Ukraine said Russia has cut natural gas supplies after
demanding advance payments for the fuel, the first time its
shipments have been affected due to this year’s crisis in
relations between the two countries. Russia’s OAO Gazprom is
only providing enough gas to Ukraine’s pipeline system to meet
demand from European customers and not the country’s needs.
After a deadline passed without payment, Gazprom’s CEO
Alexey Miller said Ukraine must pay its debt first and then only it
will receive gas paid for up front. The European Union, which is
dependent on Russian gas piped through Ukraine for about 15%
of its demand, has been trying to broker a deal to maintain
shipments and the latest negotiations in Kiev ended without a
deal. A supply cutoff may have less impact during the European
summer, when consumption is lower and stockpiles higher.
(Bloomberg)
S&P: China Inc borrows $14 trillion, overtakes US as top
corporate borrower – The Chinese corporate bond market has
overtaken the US as the world's biggest borrower market and is
set to soak up a third of the global company debt needs over the
next five years. According to rating agency Standard & Poor's,
this underscores the growing risk posed by China's debt market
on the global financial system. Chinese corporate borrowers
owed $14.2tn at the end of 2013 versus $13.1tn owed by US
corporations with the switch in rankings taking place a year
earlier than it had expected, S&P said. The Asia-Pacific region,
led by China, is seen accounting for half of the global corporate
debt financing needs of $60tn over the 2013-2018 period, when
the region will account for more than half the projected total debt
outstanding of $72tn. S&P said China is currently financing a
quarter to a third of its corporate debt through its shadow
banking sector, which has global implications. (Reuters)
Regional
CBRE: Mideast investors to spend $180bn on global real
estate in 10 years – According to global property adviser
CBRE, Middle Eastern investors are expected to spend $180bn
in commercial real estate markets outside their own region over
the next decade. The major increase in outflows of the Middle
Eastern capital into global markets is emerging from the
extraordinary mismatch between the lack of institutional real
estate in domestic markets and the huge spending power
concentrated in the region. Europe is the preferred target with
80% of the $180bn targeted for the region over the next 10
years. Close to $85bn will flow into the UK, with $60bn directed
at continental European countries such as France, Germany,
Italy and Spain. During 2007-2013, the global real estate market
has seen significant investments worth $45bn of Middle Eastern
capital – seven times the reported activity in its home market.
(Gulf-Times.com)
IFC: MENA SMEs seek Shari’ah-compliant funding –
According to a study by the International Finance Corporation
(IFC), around 35% of SMEs in the MENA region are excluded
from the formal banking sector, since they are seeking Shari’ah-
compliant products that are not readily available in the market.
The study revealed a potential market gap of up to $13.2bn for
SME Islamic financing in the region. Despite the rising demand
for Islamic financing among SMEs, the study reported a gap in
Shari’ah- complaint offerings among regional lenders. Out of the
36% banks in the MENA region that offer SME products, only
17% offer Islamic financing options. The study also noted that
demand for Islamic banking is as high as 90% in Saudi Arabia.
Meanwhile, IFC is considering a return to the Islamic bond
market. (Reuters, GulfBase.com)
Shaker Group, KPMG sign deal – Al Hassan Ghazi Ibrahim
Shaker Company (Shaker Group) has signed an agreement with
KPMG for the business transformation project that starts with
business process improvement and selection of the most
suitable Enterprise Resource Planning system (ERP). Shaker
Group is the exclusive agent for various global brands such as
LG, Indesit, Ariston, Maytag and Midea. The company aims to
establish the finest and most innovative approach of investing in
its resources, through the formation of an integrated project
customized for the company under the naming of Project
Synergy. (GulfBase.com)
Tadawul deposits Al Hokair’s IPO shares – The Saudi Stock
Exchange (Tadawul) announced that the IPO shares of Abdul
Mohsen Al-Hokair Group for Tourism & Development Company
(Al Hokair) have been deposited into applicable investor’s
portfolios on June 16, 2014. (Tadawul)
KHC to invest $400mn in Rizvi Fund – Saudi-based Kingdom
Holding Company (KHC) is planning to invest about $400mn in
the Rizvi Opportunistic Equity Fund III. The fund is specialized in
pre-IPO opportunities in well-known companies in the US with a
focus on technology, commerce and social media. (Bloomberg)
4. Page 4 of 5
Etisalat partners with UAE Exchange to simplify bill
payments – Emirates Telecommunications Corporation
(Etisalat) has signed a partnership deal with the UAE Exchange
to offer seamless payment solutions to significantly enhance
customer convenience across the country. (GulfBase.com)
Samena Capital acquires 30.6% stake in RAK Ceramics –
Samena Capital has completed the acquisition of 250mn shares
or 30.6% stake in Ras Al Khaimah Ceramic Company (RAK
Ceramics), from the ruling family of Ras Al Khaimah. The family
will continue to maintain a significant holding in the business.
The acquisition was made through Samena Capital’s subsidiary,
Samena Limestone Holdings, and its consortium including two
sovereign Gulf wealth funds. (GulfBase.com)
AJG signs debt restructuring deal – Al Jaber Group (AJG)
has signed a debt restructuring deal with its bank creditors. The
size of debt renegotiated has not yet been revealed, but bankers
had expected it to be around $4.5bn. AJG's creditor committee
is chaired by the National Bank of Abu Dhabi and includes Abu
Dhabi Commercial Bank, HSBC, RBS and Union National Bank.
(Reuters)
Al Madina expects robust Takaful growth in Oman – Al
Madina Takaful Company’s CEO, Gautam Datta, said that the
company is expecting a robust growth in Takaful insurance
business in Oman. Al Madina is expecting the Omani market to
grow around OMR60-70mn in the worst case scenario and
OMR150-180mn in the best case scenario in the next three to
five years. (GulfBase.com)
OPWP plans 2,600MW new power capacity – The Oman
Power & Water Company (OPWP) has announced plans for the
procurement of 2,600 megawatts (MW) of new electricity
generation capacity in the single largest ramp-up of the
country’s power generation infrastructure. The new facility will
be developed within the main interconnected system, which
covers much of the northern half of the Sultanate. OPWP has
floated request for qualifications from international developers
ahead of the launch of a competitive tender for licenses in the
form of Independent Power Projects (IPPs). New IPPs will
together surpass the 2,000 MW project of Phoenix Power
Company, which is scheduled to come into operation at Sur in
South Sharqiyah Governorate. Built at a cost of around $1.65bn,
the Sur project presently ranks as the Sultanate’s biggest green-
field independent power scheme. (Bloomberg)
Oman MoTC floats tenders for roads – Oman’s Ministry of
Transport & Communications (MoTC) has floated four tenders
seeking bids from contracting companies to design and build
internal roads and roundabouts in three governorates.
(Bloomberg)
Batelco wins $211.1mn case against Siva Group – Bahrain
Telecommunications Company (Batelco) has won a legal battle
against its former Indian partner, Siva Group. A British court has
ruled in Batelco’s favor, ordering Siva Group to pay $211.1mn to
Batelco for failing to fulfill a previous agreement. Batelco through
its wholly-owned subsidiary, BMIC had sued Siva Group and its
Chairman Chinnakannan Sivasankaran for $174.5mn, which it
had paid for a 43% stake in Indian operator S Tel in 2009, plus
$10.3mn and a further $30,000 a day. Earlier in February 2012,
S Tel was ordered to be stripped of its licenses as part of a
corruption probe that pre-dated Batelco's investment. The
Bahraini firm then announced it was selling its stake in S Tel
back to Siva, but when Siva failed to pay within the deadline,
Batelco launched legal proceedings. (Bahrain Bourse, Reuters)
5. Contacts
Saugata Sarkar Abdullah Amin, CFA Shahan Keushgerian
Head of Research Senior Research Analyst Senior Research Analyst
Tel: (+974) 4476 6534 Tel: (+974) 4476 6569 Tel: (+974) 4476 6509
saugata.sarkar@qnbfs.com.qa abdullah.amin@qnbfs.com.qa sahbi.alkasraoui@qnbfs.com.qa
Sahbi Kasraoui Ahmed Al-Khoudary QNB Financial Services SPC
Manager – HNWI Head of Sales Trading – Institutional Contact Center: (+974) 4476 6666
Tel: (+974) 4476 6544 Tel: (+974) 4476 6548 PO Box 24025
sahbi.alkasraoui@qnbfs.com.qa ahmed.alkhoudary@qnbfs.com.qa Doha, Qatar
DISCLAIMER: This publication has been prepared by QNB Financial Services SPC (“QNBFS”) a wholly-owned subsidiary of Qatar National Bank (“QNB”). QNBFS is regulated by the Qatar
Financial Markets Authority and the Qatar Exchange; QNB is regulated by the Qatar Central Bank. This publication expresses the views and opinions of QNBFS at a given time only. It is not an
offer, promotion or recommendation to buy or sell securities or other investments, nor is it intended to constitute legal, tax, accounting, or financial advice. We therefore strongly advise potential
investors to seek independent professional advice before making any investment decision. Although the information in this report has been obtained from sources that QNBFS believes to be
reliable, we have not independently verified such information and it may not be accurate or complete. While this publication has been prepared with the utmost degree of care by our analysts,
QNBFS does not make any representations or warranties as to the accuracy and completeness of the information it may contain, and declines any liability in that respect. QNBFS reserves the
right to amend the views and opinions expressed in this publication at any time. It may also express viewpoints or make investment decisions that differ significantly from, or even contradict, the
views and opinions included in this report.
COPYRIGHT: No part of this document may be reproduced without the explicit written permission of QNBFS.
Page 5 of 5
Rebased Performance Daily Index Performance
Source: Bloomberg Source: Bloomberg
Source: Bloomberg Source: Bloomberg
80.0
90.0
100.0
110.0
120.0
130.0
140.0
150.0
160.0
170.0
180.0
190.0
200.0
210.0
Jul-10 Jan-11 Jul-11 Jan-12 Jul-12 Jan-13 Jul-13 Jan-14
QE Index S&P Pan Arab S&P GCC
(2.0%)
(1.6%)
(0.5%) (0.5%)
0.3%
(1.0%)
(3.1%)(3.6%)
(2.4%)
(1.2%)
0.0%
1.2%
SaudiArabia
Qatar
Kuwait
Bahrain
Oman
AbuDhabi
Dubai
Asset/Currency Performance Close ($) 1D% WTD% YTD% Global Indices Performance Close 1D% WTD% YTD%
Gold/Ounce 1,271.88 (0.4) (0.4) 5.5 DJ Industrial 16,781.01 0.0 0.0 1.2
Silver/Ounce 19.67 (0.1) (0.1) 1.0 S&P 500 1,937.78 0.1 0.1 4.8
Crude Oil (Brent)/Barrel (FM
Future)
112.94 (0.4) (0.4) 1.9 NASDAQ 100 4,321.11 0.2 0.2 3.5
Natural Gas (Henry
Hub)/MMBtu
4.70 0.7 0.7 8.2 STOXX 600 345.52 (0.4) (0.4) 5.3
LPG Propane (Arab Gulf)/Ton 104.00 0.4 0.4 (17.8) DAX 9,883.98 (0.3) (0.3) 3.5
LPG Butane (Arab Gulf)/Ton 122.75 (0.1) (0.1) (9.6) FTSE 100 6,754.64 (0.3) (0.3) 0.1
Euro 1.36 0.3 0.3 (1.2) CAC 40 4,510.05 (0.7) (0.7) 5.0
Yen 101.83 (0.2) (0.2) (3.3) Nikkei 14,933.29 (1.1) (1.1) (8.3)
GBP 1.70 0.1 0.1 2.6 MSCI EM 1,046.28 (0.3) (0.3) 4.3
CHF 1.11 0.3 0.3 (0.5) SHANGHAI SE Composite 2,085.98 0.7 0.7 (1.4)
AUD 0.94 (0.0) (0.0) 5.4 HANG SENG 23,300.67 (0.1) (0.1) (0.0)
USD Index 80.47 (0.1) (0.1) 0.5 BSE SENSEX 25,190.48 (0.1) (0.1) 19.0
RUB 34.65 0.7 0.7 5.4 Bovespa 54,629.55 (0.3) (0.3) 6.1
BRL 0.45 (0.5) (0.5) 5.7 RTS 1,357.80 (1.2) (1.2) (5.9)
180.5
149.3
129.2