Vip Call US 📞 7738631006 ✅Call Girls In Sakinaka ( Mumbai )
Qnb group June 2014 monthly monitor
1. Page 1 of 10
Monthly Monitor
QNB Economics
economics@qnb.com
July 14, 2014
Executive Summary
Qatar real GDP growth accelerated to 6.2% in the year to Q1 2014 driven by construction, financial services and trade,
restaurants and hotels
Headline inflation rose to 3.4% due to rising domestic inflation while international food prices continued to moderate
International reserves remained near record levels at end-May 2014; we forecast that they will continue to rise
gradually owing to large current-account surpluses for the remainder of 2014
Qatar growth momentum picks up further in Q1 2014
Qatar real GDP growth accelerated to 6.2% in the year to
Q1 2014. Rapid non-hydrocarbon growth was the main
driver as the sector expanded by 11.5% as the
implementation of major projects continued. The pickup
in growth came despite a 1.2% contraction in
hydrocarbon real GDP as a result of falling crude oil
production and flat production at LNG facilities.
Construction, financial services and trade, restaurants
and hotels were the main contributors to growth.
Construction grew by 19.6% in real terms in the year to
Q1 2014 and contributed 2.3% to overall growth thanks to
rising infrastructure investment activity.
Contribution to Qatar’s Real GDP Growth
(% in year to Q1 2014)
Sources: Ministry of Development Planning and Statistics (MDPS) and
QNB Group analysis
QNB Economics Weekly Commentary
Lessons in Economic Development from Singapore
World Exports Are Stalling on a Weak Global Recovery
Robust Global Demand to Keep LNG Prices High
ECB Monetary Stimulus May Avoid Eurozone Deflation
Could the Emerging Market Slowdown Jeopardize the
Global Recovery
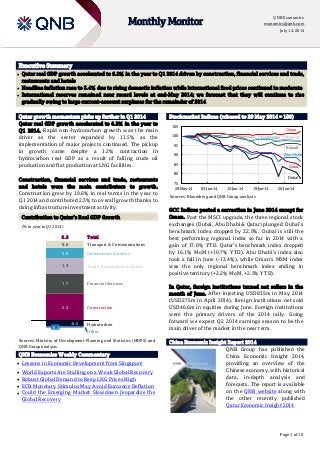
Stockmarket Indices (rebased to 29 May 2014 = 100)
Sources: Bloomberg and QNB Group analysis
GCC Indices posted a correction in June 2014 except for
Oman. Post the MSCI upgrade, the three regional stock
exchanges (Dubai, Abu Dhabi & Qatar) plunged. Dubai’s
benchmark index dropped by 22.5%. Dubai is still the
best performing regional index so far in 2014 with a
gain of 17.0% YTD. Qatar’s benchmark index dropped
by 16.1% MoM (+10.7% YTD). Abu Dhabi’s index also
took a fall in June (-13.4%), while Oman’s MSM index
was the only regional benchmark index ending in
positive territory (+2.2% MoM, +2.5% YTD).
In Qatar, foreign institutions turned net sellers in the
month of June. After injecting USD835m in May 2014
(USD275m in April 2014), foreign institutions net sold
USD46.6m in equities during June. Foreign institutions
were the primary drivers of the 2014 rally. Going
forward we expect Q2 2014 earnings season to be the
main driver of the market in the near term.
China Economic Insight Report 2014
.
QNB Group has published the
China Economic Insight 2014,
providing an overview of the
Chinese economy, with historical
data, in-depth analysis and
forecasts. The report is available
on the QNB website along with
the other recently published
Qatar Economic Insight 2014.
1.3
0.6 Transport & Communications
Government Services
Trade, Restaurants &Hotels
Financial Services
-0.1
-0.5
2.3
1.7
0.9
6.2
Construction
Hydrocarbon
Other
Total
75
80
85
90
95
100
105
29-May-14 05-Jun-14 12-Jun-14 19-Jun-14 26-Jun-14
Dubai
Qatar
AbuDhabi
Kuwait
Oman
BahrainSaudi Arabia
2. Page 2 of 10
Monthly Monitor
QNB Economics
economics@qnb.com
July 14, 2014
Overall headline inflation rose to 3.4% while international food prices continued their moderation
Qatar's Consumer Price Index (CPI) for May 2014
rose by 3.4% year-on-year. On a month-on-month
basis, it increased by 0.5% relative to April 2014.
Rents, fuel and energy were the main drivers of the
recent increase in inflation, rising by 7.0% on a year-
on-year basis. Meanwhile, the moderation in
international food prices was the key factor behind
the slowdown in foreign inflation which contributed
0.6% to year-on-year inflation in May 2014.
We expect further growth in population to drive
consumer demand, leading to a modest rise in
inflation. Indeed, there is a risk that large planned
investments in projects could lead to some supply
bottlenecks owing to limited domestic logistics
capacity, pushing up prices more than expected.
Headline inflation rose slightly to 3.4% in May 2014
Contribution to Inflation, % (Jan 2011 – Apr 2014)
Domestic inflation includes: Houses rent, Water Charges and House
Maintenance + Medical Care and Health Services + Entertainment, Recreation
and Culture + Miscellaneous Goods and Services
International inflation includes: Food, Beverages and Tobacco + Clothing and
Footwear + Furniture, Textiles and Home Appliances
Sources: QCB, MDPS and QNB Group analysis
-0.5
0.0
0.5
1.0
1.5
2.0
2.5
3.0
3.5
4.0
Jan-11 Jul-11 Jan-12 Jul-12 Jan-13 Jul-13 Jan-14
Domestic
International
Foreign merchandise trade balance registered a surplus of QAR33.3bn in May 2014
Qatar’s foreign merchandise trade balance
registered a surplus of QAR33.3bn in May 2014. The
surplus increased by 7.8% year-on-year, primarily
on higher LNG exports. Merchandise imports grew
by 5.7%, reflecting the strong growth in the
economy.
Total exports in May stood at QAR42.1bn and
imports at QAR8.8bn. Japan topped the export
destinations in May accounting for 22% of Qatar’s
exports, followed by South Korea (17%) and India
(14%). China was the largest exporter to Qatar in
May (10%), closely followed by the US (10%) and
the UAE (9%).
The trade balance registered a growing surplus
(bn QAR, % year-on-year)
Sources: MDPS and QNB Group analysis
-20
-10
0
10
20
30
40
50
May-13 May-14
TradeBalance Total Exports Total Imports
+7.8%
+7.3%
+5.7%
3. Page 3 of 10
Monthly Monitor
QNB Economics
economics@qnb.com
July 14, 2014
Economic News
QCB looks to be flexible with government bond
issuance - Qatar Central Bank (QCB) will be more
flexible in planning its future auctions of government
bonds, adjusting the timing and characteristics of these
issues based on market conditions and its policy stance.
Since March 2013, the QCB has usually issued QR3bn of
conventional bonds and QR1bn of Sukuk every quarter
with maturities of three and five years. In the last two
auctions, however, the central bank varied the pattern,
selling QR4bn of solely conventional bonds after
offering the same amount of purely Islamic bonds in
April. Further, in its last bond auction, the QCB
included a new seven-year tranche, which is a step
toward building a longer yield curve in the riyal-
denominated bond market. (Gulf-Times.com)
MDPS: Qatari economy expected to grow 6.3% in 2014,
7.8% in 2015 – Qatar is expected to report solid
economic growth in 2014 and 2015, driven by the non-
hydrocarbon sector owing to accelerated investment
spending and population growth. Meanwhile, domestic
inflationary pressures are expected to heighten over
the remainder of 2014 and in 2015 on strong domestic
demand. Inflation is expected to average 3% in 2014
and increase modestly to 3.4% in 2015, according to the
Ministry of Development Planning and Statistics
(MDPS). (Gulf-Times.com)
Private Sector News
Qatar’s Cabinet issues draft law on investment by non-
Qataris – Qatar’s Cabinet has issued a draft law
amending some provisions of Law No. (13) of 2000 on
regulation of non-Qatari capital investment in
economic activities. As per this amendment, non-
Qatari investors may have a ratio of not more than 49%
of the capital of sharing companies listed on the Qatar
Exchange (QE), after the approval of the Ministry of
Economy and Commerce on the ratio proposed in the
memorandum of association and articles of association.
The citizens of the GCC will be treated like Qatari
nationals in owning shares of companies listed on the
QE. The Cabinet issued draft laws based on the
recommendations of the Advisory (Shura) Council. The
Cabinet also issued a draft law on organizing Charitable
Works. (Gulf-Times.com)
International reserves remain near record levels at end-May 2014
Qatar’s international reserves rose by USD0.8bn to
stand at USD41.5bn at end-May 2014, from
USD40.7bn in the same period last year as the
strong current account surplus was mostly offset by
capital outflows. The latest available information
suggests that the import cover stands at 7.8 months,
well above the IMF-recommended level of 3 months
for pegged exchange rates.
Qatar’s international reserves have been steadily
rising over the years on large current account
surpluses. Going forward, QNB Group expects
international reserves to continue rising.
International reserves remained robust in May 2014
(USD billions, left axis; Months of import cover, right axis)
Sources: Qatar Central Bank (QCB) and QNB Group analysis
0
2
4
6
8
10
12
14
0
5
10
15
20
25
30
35
40
45
2009 2010 2011 2012 2013 2014
Months of Import Cover (Right Axis)
International Reserves (Left Axis)
4. Page 4 of 10
Monthly Monitor
QNB Economics
economics@qnb.com
July 14, 2014
Shura Council for taxing foreign stock investors – The
Advisory Council is recommending taxing foreign stock
investors on capital gains and income earned from cash
dividends and interest on bonds, treasury bills and
debentures. The Council rejected a proposal by the
government to exempt foreign investors in the local
equity market from paying the above tax. The State
Cabinet had, on February 19, 2014, approved a draft law
that sought to allow foreign stock investors, including
individuals, corporates and institutions, the above
exemption. The Cabinet had argued that the exemption
would help increase the inflow of foreign funds into the
Qatari equity market from individuals and institutions
such as hedge, pension, investment and mutual funds.
After it received the draft law from the State Cabinet,
the Council referred it to its internal Financial and
Economic Affairs Committee for review. The
Committee approved the draft and sent it back to the
Council, which took it up for a debate at its session
recently. The Council objected to the Committee’s
approval of the draft and asked it to take a fresh look at
it and amend three articles. (Peninsula Qatar)
CBQK completes $750mn bond issue – The Commercial
Bank of Qatar (CBQK) has announced the successful
pricing and closing of an issuance of $750mn five-year
senior unsecured notes under it its subsidiary, CBQ
Finance Limited’s $5bn Euro Medium Term Note
Program (EMTN). The Notes were issued at a spread of
117 basis points over mid-swaps and will carry a
coupon of 2.875% per annum. Bank of America-Merrill
Lynch, HSBC and Morgan Stanley acted as joint lead
managers for the bond sale. Investor orders worth more
than $3bn have been placed for the issue. CBQK intends
to use the proceeds for general funding purposes to
support its growth plans.
QIBK in talks to acquire stake in ASYAB – Qatar
Islamic Bank (QIBK) is in talks to acquire a stake in
Turkey-based Asya Katilim Bankasi (ASYAB).
Goldman Sachs Group is acting as the exclusive
financial adviser to ASYAB on the transaction. In
March 2014, ASYAB had announced that it had
commenced talks with QIBK for a strategic partnership,
while QIBK was interested in acquiring a stake in
ASYAB. (Bloomberg)
ERES: Qatar’s real estate deals up 85% – According to
an Ezdan weekly report, Qatar’s real estate market
remained firm as transactions jumped 85% to
QAR1,409mn. An exceptional QAR180mn deal for a
residential building in Umm Ghuwelina also took place.
Doha Municipality witnessed the largest number of
transactions implemented, with 47 deals garnering
23.9% of total transactions. Al Daayan Municipality
saw 39 transactions representing 67.2% of total deals
as compared to 32.8% of other real estate across all
areas. The report predicted that property transactions
will experience a rise in the coming weeks, especially in
the land sector, noting that investors and real estate
developers are seeking new real estate projects.
(Peninsula Qatar)
Woqod in process of finalizing its five year plan 2014-
2018 – Woqod’s (QFLS) revealed the main features of
its upcoming five years plan (2014 - 2018). The plan
which is in its final stages of preparations is in line with
the Qatar’s National Vision 2030 and the huge
modernization and development efforts at the various
levels in Qatar, and in preparation for the upcoming
global event, World Cup 2022, to be hosted by Qatar.
The plan emphasizes expanding the current stations,
addition of new technical centers, developing and
modernizing infrastructure for Q-JET, expanding the
operational capacity of WOQOD Marine Services' fleet
by increasing the number of new vessels (expected to
reach 8-10 vessels by the end of 2018 from the current
five vessels), and investing QR70mn to expand the
storage facilities at Mesaieed area and increase its
operational capacity to exceed 20,000 metric tons of
Bitumen to deal with the new demand during the
coming five years.
Nakilat takes over first LNG vessel as ‘owner operator’
– Nakilat has taken over the operations of the first of
the four liquefied natural gas (LNG) vessels as part of
its strategic move to be the owner and operator of the
fleet. Its fully-owned subsidiary, Nakilat Shipping
(Qatar) took over the operations of a Q-Flex vessel ‘Al
Hamla’ from OSG Ship Management, UK. Al Hamla,
owned 50.1% by Nakilat and 49.9% by OSG, has a cargo
capacity of 216,000 cubic meters. Built in South Korea
by Samsung Heavy Industries, Al Hamla is in active
service for charterer Qatargas II and has delivered 45
cargoes across the world. (Gulf-Times.com)
QNBK wins two Euromoney awards – QNB Group
(QNBK) has been awarded "The Best Bank in the
Middle East" and "The Best Bank in Qatar" Awards by
eminent international finance magazine Euromoney.
The awards reflect the continuing progress being made
by QNBK across the MENA region and the domestic
market. This also marks the 11th occasion that QNBK
has won this accolade from the international magazine.
(Peninsula Qatar)
5. Page 5 of 10
Monthly Monitor
QNB Economics
economics@qnb.com
July 14, 2014
National Accounts
Nominal GDP (QAR bn) 2010 2011 2012 2013 Q1 14 YoY% QoQ%
Total 455.4 624.2 691.4 736.9 192.4 2.6% 2.1%
Oil & Gas 239.7 370.2 392.7 401.2 102.6 -4.5% 2.9%
Non-Oil 215.7 254.0 298.7 335.7 89.8 12.3% 1.1%
Agriculture and Fishing 0.5 0.6 0.6 0.7 0.2 9.3% 6.8%
Industry 40.8 56.7 70.2 72.1 30.2 8.3% 5.4%
Manufacturing 40.8 56.7 70.2 72.1 18.2 1.0% 0.2%
Electricity, Gas and Water 2.1 2.4 3.4 3.8 0.8 15.9% -22.2%
Construction 27.5 28.3 31.2 35.9 11.0 22.4% 18.7%
Services 140.9 162.1 188.6 218.4 58.4 14.5% -0.8%
Trade, Restaurants and Hotels 31.5 35.6 39.1 45.5 11.6 21.8% -11.7%
Transport and Communications 18.1 21.0 23.5 25.9 7.0 10.2% 4.0%
Financial and Business Services 60.3 65.6 74.7 88.3 23.8 18.1% -1.3%
Social Services 4.5 5.0 5.8 6.4 1.8 12.3% 10.2%
Government Services 37.4 46.2 60.1 69.8 18.5 8.5% 3.4%
Household Services 1.9 2.0 2.3 2.7 0.8 18.0% 5.6%
Imputed Bank Service Charges -12.7 -13.4 -16.8 -20.2 -5.1 17.3% -5.5%
Import Duties 3.8 3.9 4.6 4.8 1.2 10.0% -5.4%
Source: MDPS
Real GDP (% change, YoY) 2009 2010 2011 2012 2013 Q1 14 QoQ%
Total 12.0 16.7 13.0 6.2 6.5 6.2 2.3
Oil & Gas 4.5 28.9 15.7 1.2 0.1 -1.2 1.8
Non-Oil 17.6 8.6 10.8 10.3 11.4 11.5 2.5
Agriculture and Fishing -17.0 19.7 5.4 4.5 6.9 7.9 5.4
Industry 6.1 23.4 14.0 4.1 3.3 11.1 7.3
Manufacturing 13.7 17.6 10.4 10.7 5.6 0.6 1.6
Electricity, Gas and Water -0.4 13.5 7.9 10.6 6.4 5.9 -14.7
Construction 6.9 9.5 10.5 10.6 13.6 19.6 12.9
Services 21.9 6.9 10.3 10.8 13.1 11.8 0.0
Trade, Restaurants and Hotels 15.7 2.5 12.9 6.7 12.8 19.0 -11.3
Transport and Communications 22.7 10.2 12.4 12.4 9.7 9.0 3.0
Financial and Business Services 25.8 7.4 6.3 11.4 14.3 14.6 -0.3
Social Services 21.5 1.9 3.0 9.2 6.7 11.6 10.1
Government Services 23.6 8.7 13.1 12.8 15.1 7.5 3.4
Household Services 4.3 2.2 0.8 6.0 10.3 9.2 1.8
Imputed Bank Service Charges 1.0 3.3 16.4 21.2 18.2 15.3 -8.4
Import Duties -11.3 17.8 -1.1 20.5 1.7 11.3 -5.6
Source: MDPS
N.B. Data which is new or revised this month is shown in red.
6. Page 6 of 10
Monthly Monitor
QNB Economics
economics@qnb.com
July 14, 2014
Balance of Payments
Balance of Payments (USD bn) 2010 2011 2012 2013 Q1 14
Current Account Balance 24.0 52.0 62.0 62.6 17.6
Trade Balance (Goods) 54.0 87.4 102.2 105.5 28.8
Exports 75.0 114.3 133.0 136.9 36.8
Imports -20.9 -26.9 -30.8 -31.5 -7.9
Invisibles -30.1 -35.4 -40.2 -42.9 -11.3
Services -5.8 -9.5 -14.0 -16.3 -4.1
Income -12.9 -13.3 -12.1 -11.3 -3.3
Transfers -11.4 -12.7 -14.1 -15.2 -3.9
Capital & Financial Account Balance -10.7 -62.6 -44.4 -54.5 -18.2
Capital Account -2.1 -3.6 -6.1 -4.8 -1.3
Financial Account -8.6 -59.0 -38.3 -49.7 -10.8
Direct Investment (outwards) -1.9 -6.0 -1.8 -8.0 -2.0
Direct Investment (into Qatar) 4.7 -0.1 0.3 -0.8 -0.4
Portfolio investment (net) - - - -14.3 -1.7
Sources: QCB, MDPS, UNCTAD; Note: Not all Balance of Payment lines are shown in the table
Top 5 Export Destinations (USD bn) 2009 2010 2011 2012 Q4 13
Japan 14.5 19.7 27.4 32.6 8.0
Korea 7.6 10.8 18.9 23.2 6.3
India 3.7 5.6 10.3 14.7 3.4
European Union 4.0 9.1 17.0 12.0 2.5
China 1.2 2.2 4.3 7.0 2.0
Top 5 Import Sources (USD bn) 2009 2010 2011 2012 Q4 13
European Union 8.1 7.2 6.6 7.5 2.1
United States 3.1 3.5 3.1 3.9 1.3
United Arab Emirates 1.8 2.3 3.0 3.2 0.8
Saudi Arabia 1.3 1.7 2.2 2.4 0.6
United Kingdom 1.1 1.4 1.5 1.8 0.6
Source: IMF Direction of Trade Statisics - sometimes differ from MDPS
Crude oil (USD / barrel) 2010 2011 2012 2013 May-14 MoM% YoY%
Oil production ('000 bpd) 733.0 734.0 733.7 724.0 701.0 0.0% -3.0%
Qatar average price 77.7 108.4 111.2 108.2 107.0 -1.4% -1.4%
Dukhan 78.4 109.7 111.8 108.8 108.1 -1.6% -1.3%
Marine 77.2 107.5 110.6 107.6 106.5 -1.4% -1.4%
Source: OPEC (Direct communications), Reuters
8. Page 8 of 10
Monthly Monitor
QNB Economics
economics@qnb.com
July 14, 2014
Banking Sector Snapshot : May 2014
Review and Outlook Banking Sector Index vs. QE All Share Index
Loan growth outpaced deposit growth in the month of May
2014. After posting a growth of 0.6% MoM in April 2014, loans
grew by 0.4% MoM in May 2014 primarily due to a pick-up in
credit off-take from the international segment. Moreover,
deposits continued its gradual growth (+0.2% MoM) and are up
6.8% year-to-date (YTD) relative to a 4.2% growth in the loan
book. Hence, the banking sector’s loans-to-deposits ratio (LDR)
rested at 103% at the end of May 2014 compared with105% at
the end of 2013. Going forward, we expect the public sector, in
addition to large corporate loan growth to be the primary drivers
of the overall loan book in 2014 followed by the SMEs and
consumer lending. Our view is based on the expected uptick in
project mobilizations in the coming months.
The private sector led deposit growth for the month of May
2014. Public sector deposits declined by 0.9% MoM (+2.4% YTD
2014). Delving into segment details, the government
institutions’ segment (representing ~54% of public sector
deposits) grew by 0.1% MoM (+2.7% YTD 2014). Furthermore,
the semi-government institutions’ segment posted a growth of
3.9% MoM (down 25.6% YTD 2014). On the other hand, the
government segment decreased by 4.1% MoM (+17.1% YTD).
Private sector deposits gained by another 0.3% MoM (+10.8%
YTD 2014). On the private sector front, the companies &
institutions’ segment grew by 1.5% MoM (+12.1% YTD 2014)
while the consumer segment dipped by 0.8% MoM (+9.7% YTD
2014).
The overall loan book’s performance improved by 0.4% MoM in
May 2014. International credit was the primary driver of the
MoM growth, increasing by 12.2% MoM (+22.1% YTD 2014).
Total domestic public sector loans declined by 2.1% MoM and are
down 0.8% YTD. The government segment’s loan book declined
by 7.8% MoM (+9.4% YTD 2014). Furthermore, semi-
government institutions’ segment declined by 3.6% MoM and is
now down 8.4% YTD. However, the government institutions’
segment (representing ~62% of public sector loans) grew by
0.7% MoM but it is still down 3.0% YTD.
Private sector loans gained by 0.6% MoM and is up 5.6% YTD.
The Contractors segment posted a 0.8% growth MoM and is the
best performing segment in the private sector, posting a growth
of 13.5% in the first five months of 2014. The General Trade
segment (contributes ~12% to private sector loans) loan book
declined by 5.4% MoM (+5.2% YTD). However, the two other
segments, real estate and consumption & others have posted
modest growth in the first five months of 2014. Consumption &
Others (contributes ~29% to private sector loans) increased by
1.1% MoM (+4.7 YTD). Real Estate (contributes ~28% to private
sector loans) climbed up by 1.8% MoM (+2.2% YTD).
Source: Bloomberg
Banking Sector - Loan to Deposit (LDR)
Source: QCB
Shahan Keushgerian Abdullah Amin, CFA
shahan.keushgerian@qnbfs.com.qa abdullah.amin@qnbfs.com.qa
Saugata Sarkar
saugata.sarkar@qnbfs.com.qa
-
200,000
400,000
600,000
800,000
50%
70%
90%
110%
130%
May-12
Aug-12
Nov-12
Feb-13
May-13
Aug-13
Nov-13
Feb-14
May-14
QRmn
LoantoDepositRatio
Loans Deposits Loan to Deposit Ratio
10. This report is produced by QNB Group’s Economics Team in collaboration with QNB Financial Services. Past issues are available online at http://tinyurl.com/QatarMonitor. For questions, or to receive it
by email each month, please contact:
QNB Economics
QNB Group
Tel: (+974) 4453 4642
economics@qnb.com.qa
Saugata Sarkar
Head of Research, QNBFS
Tel: (+974) 4476 6534
saugata.sarkar@qnbfs.com.qa
Ahmed M. Shehada
Head of Trading, QNBFS
Tel: (+974) 4476 6535
ahmed.shehada@qnbfs.com.qa
Keith Whitney
Head of Sales, QNBFS
Tel: (+974) 4476 6533
keith.whitney@qnbfs.com.qa
DISCLAIMER: This publication has been prepared by Qatar National Bank (“QNB”) and QNB Financial Services SPC (“QNBFS”), a wholly-owned subsidiary. QNB is regulated by the Qatar Central Bank,
QNBFS is regulated by the Qatar Financial Markets Authority and the Qatar Exchange. This publication expresses the views and opinions of QNB Group and QNBFS at a given time only. It is not an offer,
promotion or recommendation to buy or sell securities or other investments, nor is it intended to constitute legal, tax, accounting, or financial advice. We therefore strongly advise potential investors to
seek independent professional advice before making any investment decision. Although the information in this report has been obtained from sources that are believed to be reliable, we have not
independently verified all such information and it may not be accurate or complete. While this publication has been prepared with the utmost degree of care by our analysts, no warranties are provided as
to the accuracy and completeness of the information it may contain, and any liability in that respect is declined. QNB/QNBFS reserve the right to amend the views and opinions expressed in this
publication at any time. They may also express viewpoints or make investment decisions that differ significantly from, or even contradict, the views and opinions included in this report.
COPYRIGHT: This report is distributed on a complimentary basis to valued business partners of QNB. It may not be reproduced in whole or in part without permission.
Monthly Monitor
QNB Economics
economics@qnb.com
July 14, 2014
Source: Bloomberg, * Trailing Twelve Months
Company Name
Price
(June 26)
% Change
5-Day
% Change
YTD
Market Cap.
QR Million TTM P/E P/B Div. Yield
Qatar National Bank 162.00 (7.95) (5.81) 113,356 11.6 2.2 4.3
Qatar Islamic Bank 85.10 (7.10) 23.33 20,109 14.7 1.8 4.7
Commercial Bank of Qatar 63.30 (3.36) 7.29 18,796 11.5 1.2 2.6
Doha Bank 55.00 (5.98) (5.50) 14,210 10.0 1.3 8.2
Al Ahli Bank 50.10 0.20 18.42 8,276 15.3 2.2 N/A
Qatar International Islamic Bank 76.00 (5.00) 23.18 11,504 15.0 2.3 4.9
Masraf Al Rayan 48.00 (6.25) 53.35 36,000 20.8 3.7 3.1
Al Khaliji Bank 20.50 (5.09) 2.55 7,380 14.0 1.4 4.9
National Leasing 30.55 (4.38) 1.33 1,512 24.1 1.2 4.9
Dlala Holding 52.50 0.96 137.56 1,166 201.9 4.6 N/A
Qatar & Oman Investment 14.15 (5.67) 13.02 446 20.4 1.4 4.2
Islamic Holding Group 67.00 (6.69) 45.65 268 27.1 4.9 2.5
Banking and Financial Services 233,022
Zad Holding 78.00 (1.64) 12.23 1,020 9.5 0.7 4.5
Qatar German Co. for Medical Devices 14.20 (3.14) 2.53 164 N/M 0.9 N/A
Salam International Investment 17.30 0.29 32.97 1,978 15.4 1.2 5.8
Medicare Group 77.50 (7.52) 47.62 2,181 22.0 2.9 2.3
Qatar Cinema & Film Distribution 41.50 (27.95) 3.49 237 20.6 1.7 N/A
Qatar Fuel 210.50 (2.00) (3.68) 17,779 14.8 3.0 3.7
Qatar Meat and Livestock 55.60 (5.76) 7.54 1,001 18.7 3.7 3.8
Al Meera Consumer Goods 170.00 0.65 27.53 3,400 15.5 2.7 4.7
Consumer Goods and Services 27,760
Qatar Industrial Manufacturing 44.50 (3.05) 5.53 2,115 10.2 1.4 N/A
Qatar National Cement 130.00 (1.89) 9.24 6,383 14.3 2.6 4.6
Industries Qatar 170.00 (4.06) 0.65 102,850 14.6 3.6 6.5
Qatari Investors Group 52.50 (13.93) 20.14 6,527 28.9 3.1 1.4
Qatar Electricity and Water 178.00 (3.00) 7.64 19,580 13.2 3.4 3.8
Mannai Corp. 111.00 (5.13) 23.47 5,064 10.0 2.8 5.0
Aamal 16.00 (4.19) 6.67 9,600 18.2 1.4 N/A
Gulf International Services 93.50 (0.64) 91.60 17,376 23.9 5.8 1.7
Mesaieed Petrochemical Holding 31.20 (3.85) N/M 39,197 N/A 2.9 1.1
Industrials 208,692
Qatar Insurance 79.00 (1.25) 48.50 12,683 15.8 2.4 2.5
Doha Insurance 25.25 1.00 1.00 1,263 9.4 1.2 7.9
Qatar General Insurance & Reinsurance 46.90 5.04 17.49 3,244 1.5 0.7 2.7
Al Khaleej Takaful Insurance 41.70 (8.05) 48.52 926 12.5 1.4 N/A
Qatar Islamic Insurance 76.90 2.26 32.82 1,154 15.1 4.4 4.9
Insurance 19,269
United Development 23.24 (6.25) 7.93 8,229 17.7 0.8 4.1
Barw a Real Estate 37.20 (3.88) 24.83 14,475 9.8 1.0 5.4
Ezdan Real Estate 19.12 (11.97) 12.47 50,716 40.7 1.7 1.6
Mazaya Qatar Real Estate Development 16.33 (6.85) 46.06 1,633 10.6 1.3 4.6
Real Estate 75,053
Qatar Telecom 125.30 (3.62) (8.67) 40,136 15.4 1.6 3.2
Vodafone Qatar 17.95 (8.42) 67.60 15,175 N/M 2.6 0.9
Telecoms 55,311
Qatar Navigation (Milaha) 88.40 (2.96) 6.51 10,124 10.5 0.8 5.7
Gulf Warehousing 47.80 (5.72) 15.18 2,273 20.7 3.0 3.1
Qatar Gas Transport (Nakilat) 21.95 (4.57) 8.40 12,292 16.0 3.4 5.0
Transportation 24,689
Qatar Exchange 643,796