Weekly Market Report
•
1 like•372 views

The QE Index gained 0.57% over the week to close at 9,298.75 points, while market capitalization rose 0.61% to QR512.2 billion. Trading value decreased 29.22% to QR1,290.7 million as volume fell 41.77% to 28.3 million shares. Islamic Holding Group was the best performer, up 12.83%, while Qatar Cinema & Film Distribution declined the most at 8.80%. Regional markets were mixed, with Qatar outperforming declines in Dubai and Abu Dhabi. Foreign investors remained net sellers of QR100 million for the week.

Recommended
More Related Content
What's hot
What's hot (20)
Viewers also liked
Similar to Weekly Market Report
Similar to Weekly Market Report (20)
More from QNB Group
More from QNB Group (20)
Recently uploaded
Recently uploaded (20)
Weekly Market Report
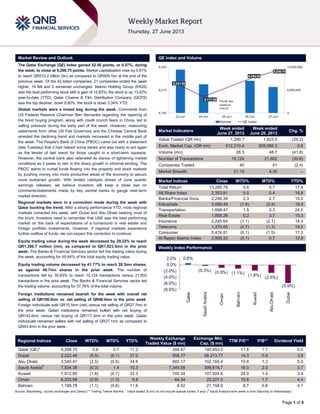
- 1. Page 1 of 5 Market Review and Outlook QE Index and Volume The Qatar Exchange (QE) Index gained 52.56 points, or 0.57%, during the week, to close at 9,298.75 points. Market capitalization rose by 0.61% to reach QR512.2 billion (bn) as compared to QR509.1bn at the end of the previous week. Of the 42 listed companies, 21 companies ended the week higher, 19 fell and 2 remained unchanged. Islamic Holding Group (IHGS) was the best performing stock with a gain of 12.83%; the stock is up 13.42% year-to-date (YTD). Qatar Cinema & Film Distribution Company (QCFS) was the top decliner, down 8.80%; the stock is down 3.34% YTD. Global markets were a mixed bag during the week. Comments from US Federal Reserve Chairman Ben Bernanke regarding the tapering of the bond buying program, along with credit crunch fears in China, led to selling pressure during the early part of the week. However, reassuring statements from other US Fed Governors and the Chinese Central Bank arrested the declining trend and markets recovered in the middle part of the week. The People's Bank of China (PBOC) came out with a statement (late Tuesday) that it had helped some banks and was ready to act again as the lender of last resort for those caught in a short-term squeeze. However, the central bank also reiterated its stance of tightening market conditions as it seeks to rein in the sharp growth in informal lending. The PBOC wants to curtail funds flowing into the property and stock markets by pushing money into more productive areas of the economy to secure more sustained growth. With limited catalysts ahead of June quarter earnings releases, we believe investors will keep a close eye on comments/statements made by key central banks to gauge near-term market direction. Regional markets were in a correction mode during the week with Qatar bucking the trend. After a strong performance YTD, most regional markets corrected this week, with Dubai and Abu Dhabi bearing most of the brunt. Investors need to remember that UAE was the best performing market on the back of expectations of a turnaround in real estate and foreign portfolio investments. However, if regional markets experience further outflow of funds, we can expect this correction to continue. Equity trading value during the week decreased by 29.22% to reach QR1,290.7 million (mn), as compared to QR1,823.5mn in the prior week. The Banks & Financial Services sector led the trading value during the week, accounting for 45.44% of the total equity trading value. Equity trading volume decreased by 41.77% to reach 28.3mn shares, as against 48.7mn shares in the prior week. The number of transactions fell by 30.63% to reach 15,124 transactions versus 21,802 transactions in the prior week. The Banks & Financial Services sector led the trading volume, accounting for 37.76% of the total volume. Foreign institutions remained bearish for the week with overall net selling of QR100.0mn vs. net selling of QR46.0mn in the prior week. Foreign individuals sold QR15.5mn (net) versus net selling of QR27.7mn in the prior week. Qatari institutions remained bullish with net buying of QR142.6mn versus net buying of QR117.3mn in the prior week. Qatari individuals remained sellers with net selling of QR27.1mn as compared to QR43.4mn in the prior week. Market Indicators Week ended June 27, 2013 Week ended June 20, 2013 Chg. % Value Traded (QR mn) 1,290.7 1,823.5 (29.2) Exch. Market Cap. (QR mn) 512,210.4 509,085.3 0.6 Volume (mn) 28.3 48.7 (41.8) Number of Transactions 15,124 21,802 (30.6) Companies Traded 40 41 (2.4) Market Breadth 21:19 4:35 – Market Indices Close WTD% MTD% YTD% Total Return 13,285.78 0.6 0.7 17.4 All Share Index 2,353.81 0.5 0.4 16.8 Banks/Financial Svcs. 2,246.34 2.3 2.7 15.2 Industrials 3,099.49 (1.6) (2.4) 18.0 Transportation 1,668.47 1.5 0.3 24.5 Real Estate 1,858.26 0.2 3.7 15.3 Insurance 2,245.64 (1.1) (2.1) 14.4 Telecoms 1,270.00 (0.7) (1.3) 19.2 Consumer 5,474.81 (0.1) (1.5) 17.2 Al Rayan Islamic Index 2,808.33 (0.1) 0.7 12.9 Market Indices Weekly Index Performance Regional Indices Close WTD% MTD% YTD% Weekly Exchange Traded Value ($ mn) Exchange Mkt. Cap. ($ mn) TTM P/E** P/B** Dividend Yield Qatar (QE)* 9,298.75 0.6 0.7 11.2 354.47 140,653.0 11.8 1.7 5.0 Dubai 2,222.46 (5.9) (6.1) 37.0 558.77 58,213.77 14.3 0.9 3.8 Abu Dhabi 3,540.47 (2.5) (0.6) 34.6 682.17 102,165.4 10.8 1.3 5.0 Saudi Arabia# 7,504.38 (0.3) 1.4 10.3 7,349.58 399,618.7 16.0 2.0 3.7 Kuwait 7,912.85 (1.8) (4.7) 33.3 745.34 107,924.6 24.9 1.4 3.4 Oman 6,333.98 (0.9) (1.3) 9.9 64.34 22,227.0 10.8 1.7 4.4 Bahrain 1,188.78 (1.1) (0.6) 11.6 8.52 21,158.9 8.7 0.8 4.1 Source: Bloomberg, country exchanges and Zawya (** Trailing Twelve Months; * Value traded ($ mn) do not include special trades, if any) ( # Saudi Arabia's work week is from Saturday to Wednesday) 9,231.56 9,177.98 9,264.55 9,298.75 0 5,000,000 10,000,000 9,100 9,210 9,320 23-Jun 24-Jun 25-Jun 26-Jun 27-Jun Volume QE Index TheQE was closed on June25 0.6% (0.3%) (0.9%) (1.1%) (1.8%) (2.5%) (5.9%) (8.0%) (6.0%) (4.0%) (2.0%) 0.0% 2.0% Qatar SaudiArabia Oman Bahrain Kuwait AbuDhabi Dubai
- 2. Page 2 of 5 News Economic News Qatar’s real GDP to grow 5.3% - According to the latest estimates from Qatar‟s General Secretariat for Development Planning, Qatar‟s real GDP is expected to grow by 5.3%, up from 4.8% projected in December 2012. Consumer prices are expected to increase by 3.6% in 2013 with a record fiscal surplus of 8.1% of nominal GDP in 2013. S&P: Qatar ratings to remain amid transfer of power – S&P said the transfer of power in Qatar has no immediate effect on the sovereign credit ratings of the country. The ratings agency said it expects to gain a clearer understanding of the extent to which a change in Emir will lead to a reshuffle of ministerial positions and affect the elections to the advisory council, which are expected later in 2013. (Gulf-Times.com) Fitch affirms RasGas II & 3 bonds at A+; outlook Stable – Fitch Ratings has affirmed Ras Laffan Liquefied Natural Gas Company Limited (II)‟s (RasGas (II)) and Ras Laffan Liquefied Natural Gas Company Limited (3)‟s (RasGas (3)) senior secured bonds at “A+” with “Stable” outlook. (Reuters) BofAML: Qatar GDP growth rate seen at 5% in 2013, 4.9% in 2014 – Bank of America Merrill Lynch (BofAML) has maintained its GDP growth forecast for Qatar at 5% in 2013 and 4.9% in 2014, even as it projected a rise in CPI inflation to 2% in 2013 and 2.5% in 2014. Meanwhile, the QNB Group has said Qatar‟s real GDP growth is expected to reach 6.5% in 2013 and 6.8% in 2014, on the back of continued economic diversification and non-oil sector‟s performance. (Gulf- Times.com) QCB to issue QR4bn T-bills on July 02 – Qatar Central Bank (QCB) will issue treasury bills for a period of 91 days, 184 days, 273 days on July 02, 2013. The total amount of issuance is QR4bn. (QCB) Qatar’s petrochemical production reaches 16.8mn tons in 2012 – Petrochemicals production in Qatar touched 16.8mn tons in 2012, making the country the second largest producer in the GCC downstream sector, after Saudi Arabia. One of the key projects that came on-stream last year was Qatar Petrochemical Company‟s (Qapco) new low density polyethylene (LDPE-3) plant, which increased its polyolefin production capacity to 1.15mn tons per annum. This plant has the highest polyolefin production capacity in a single location anywhere in the world. Qapco also plans to expand the production capacity of its ethylene plant, which will enable Qapco to produce up to 1mn ton of ethylene every year. (Peninsula Qatar) Qatar real estate transactions drop by 15% – The value of real estate transactions in Qatar dropped by 15% YoY during the first five months of 2013. The value of total transactions during January-May 2013 stood at QR17.5bn compared to QR20.6bn during the same period in 2012. The total transaction value in January 2013 dropped by a huge 46.5% compared to January 2012. February also saw a drop in the transaction value compared to February 2012. However, the transactions picked up in all the remaining months – though marginally, but failed to cross the total value posted during the corresponding period in 2012. (Peninsula Qatar) Market & Corporate News QNB Group signs MoU with Attijariwafa Bank of Morocco – QNB Group has signed a MoU with Attijariwafa Bank of Morocco to focus on mutual business in various areas such as capital markets, trade finance and investment flows between Qatar and Morocco. (QNB Group Press Release) QNB Group to disclose 2Q2013 financial results on July 10 – QNB Group announced its intent to disclose 2Q2013 reviewed financial statements on July 10, 2013. (QE) QDVC bags two contracts; Ashghal gives road contract to Egis – Qatar Rail earlier awarded Qatari Diar Filiale Vinci (QDVC) a tender of QR7.4bn. Moreover, QDVC was awarded two projects; to build the car park and Sheraton project valued at around QR2bn. Meanwhile, another contract was signed between Ashghal and French construction company Egis, wherein the latter obtained two contracts of road works and infrastructure worth QR780mn. (Gulf-Times.com) UDCD announces formation of a new executive committee – The Board of Directors of United Development Company has formed a new executive committee. The main function of the committee is to assist the Chief Executive Officer in fulfilling his duties. The powers of the Committee shall be defined via a charter approved by the Board of Directors.(QE) Turk Telekom signs $100mn loan with CBQK – The Turkish telecommunications company, Turk Telekom has signed a $100mn loan deal with the Commercial Bank of Qatar (CBQK). Turk Telekom said the annual rate on the three-year bond will be LIBOR plus 2.75%. (Reuters) GISS’ subsidiary signs deal with Weststar Aviation – Gulf Helicopters, a subsidiary of the Gulf International Services (GISS) has entered into a contract with Weststar Aviation Services to use two AW 139 helicopters to support its petroleum operations in Malaysia. The duration of this contract is one year with optional extension of another year. The contract is scheduled to commence from July 1, 2013. (QE) QIIK to disclose its 2Q2013 results on July 15 – Qatar International Islamic Bank (QIIK) will announce its 2Q2013 financial results on July 15, 2013. (QE) IHGS to disclose its 2Q2013 results on July 15 – The Islamic Holding Group (IHGS) will announce its 2Q2013 financial results on July 15, 2013. (QE) Samsung C&T gets $693mn Doha Metro order – South Korean builder Samsung C&T Corp said it has obtained an order worth $693mn to build part of the underground rail line of the Qatar Doha Metro Project from the Qatar Railways Company. Samsung C&T said that the contract is slated to be completed in June 2018. (GulfBase.com) Balfour wins £56mn Qatar highway deal – Balfour Beatty has garnered a £56mn highways contract in Qatar. The Qatar government has asked Balfour Beatty‟s professional services division, Parsons Brinckerhoff, to design 16 miles of expressways, including bridges and interchanges. (Bloomberg) Qatar Coral makes substantial progress on iconic project – The Qatar Coral for Real Estate Development Company stated that 100% of the building structures, 97% of mechanical, electrical & plumbing works, and 97% of interior finishing have been completed on its twin luxury properties – VB22 & VB23 in Viva Bahriya on The Pearl. Qatar Coral‟s customers are all set to move into their homes by August 2013. (AME Info)
- 3. Page 3 of 5 Qatar Exchange Top 5 Gainers Top 5 Decliners Source: Qatar Exchange (QE) Source: Qatar Exchange (QE) Most Active Shares by Value (QR Million) Most Active Shares by Volume (Million) Source: Qatar Exchange (QE) Source: Qatar Exchange (QE) Investor Trading Percentage to Total Value Traded Net Traded Value by Nationality (QR Million) Source: Qatar Exchange (QE) Source: Qatar Exchange (QE) 12.8% 5.3% 3.0% 2.7% 2.1% 0.0% 5.0% 10.0% 15.0% Islamic Holding Group QNB Group Al Khaleej Takaful Insurance Qatar Gas Transport (Nakilat) Qatar Islamic Insurance -3.5% -3.4% -3.1% -2.7% -2.0% -4.5% -3.0% -1.5% 0.0% Qatar Cinema & Film Distribution Qatar Industrial Manufacturing Dlala Holding Industries Qatar Gulf International Services 274.5 173.8 125.7 90.6 72.5 0.0 100.0 200.0 300.0 QNB Group Industries Qatar Masraf Al Rayan United Development Barwa Real Estate 4.6 3.9 3.2 2.7 1.8 0.0 2.0 4.0 6.0 Masraf Al Rayan United Development Qatar Gas Transport (Nakilat) Barwa Real Estate QNB Group 0% 20% 40% 60% 80% 100% Buy Sell 34.57% 36.67% 28.38% 17.33% 10.78% 11.98% 26.27% 34.02% Qatari Individuals Qatari Institutions Non-Qatari Individuals Non-Qatari Institutions 812 478 697 594 116 (116) (200) - 200 400 600 800 1,000 Qatari Non-Qatari Net Investment Total Sold Total Bought
- 4. Page 4 of 5 TECHNICAL ANALYSIS OF THE QE INDEX Source: Bloomberg The QE Index experienced a volatile week and was able to halt its recent declines and closed above its January 2011 high of 9,290.18. The index rebounded on Wednesday and Thursday recouping all the losses it witnessed earlier in the week. The bulls were finally able to halt the selling pressure that lasted since it breached the channel support around 9,400.0. We believe if the index can hold off the selling pressure this week and attempt a rebound, which may lead to a test of the 9,400.0 level. This continues to be the next level of interest for the bulls, because it will be the next level of resistance, which if breached, may attract further buying interest to test 9,500.0. On the flip side, if the index breaches below its 9,200.0 psychological level, it may test its next support at the 9,100.0 level. Both technical indicators remain mixed with the RSI rejecting the midline at 50 and heading back toward the bullish territory, while the MACD is below the signal line. Traders may remain bullish at the current level, but may exercise caution. DEFINITIONS OF KEY TERMS USED IN TECHNICAL ANALYSIS RSI (Relative Strength Index) indicator – RSI is a momentum oscillator that measures the speed and change of price movements. The RSI oscillates between 0 to 100. The index is deemed to be overbought once the RSI approaches the 70 level, indicating that a correction is likely. On the other hand, if the RSI approaches 30, it is an indication that the index may be getting oversold and therefore likely to bounce back. MACD (Moving Average Convergence Divergence) indicator – The indicator consists of the MACD line and a signal line. The divergence or the convergence of the MACD line with the signal line indicates the strength in the momentum during the uptrend or downtrend, as the case may be. When the MACD crosses the signal line from below and trades above it, it gives a positive indication. The reverse is the situation for a bearish trend. Candlestick chart – A candlestick chart is a price chart that displays the high, low, open, and close for a security. The „body‟ of the chart is portion between the open and close price, while the high and low intraday movements form the „shadow‟. The candlestick may represent any time frame. We use a one-day candlestick chart (every candlestick represents one trading day) in our analysis. Doji candlestick pattern – A Doji candlestick is formed when a security's open and close are practically equal. The pattern indicates indecisiveness, and based on preceding price actions and future confirmation, may indicate a bullish or bearish trend reversal. Shooting Star/Inverted Hammer candlestick patterns – These candlestick patterns have a small real body (open price and close price are near to each other), and a long upper shadow (large intraday movement on the upside). The Shooting Star is a bearish reversal pattern that forms after a rally. The Inverted Hammer looks exactly like a Shooting Star, but forms after a downtrend. Inverted Hammers represent a potential bullish trend reversal.
- 5. Contacts Ahmed M. Shehada Keith Whitney Saugata Sarkar Sahbi Kasraoui Head of Trading Head of Sales Head of Research Manager - HNWI Tel: (+974) 4476 6535 Tel: (+974) 4476 6533 Tel: (+974) 4476 6534 Tel: (+974) 4476 6544 ahmed.shehada@qnbfs.com.qa keith.whitney@qnbfs.com.qa saugata.sarkar@qnbfs.com.qa sahbi.alkasraoui@qnbfs.com.qa QNB Financial Services SPC Contact Center: (+974) 4476 6666 PO Box 24025, Doha, Qatar DISCLAIMER: This publication has been prepared by QNB Financial Services SPC (“QNBFS”) a wholly-owned subsidiary of Qatar National Bank (“QNB”). QNBFS is regulated by the Qatar Financial Markets Authority and the Qatar Exchange; QNB is regulated by the Qatar Central Bank. This publication expresses the views and opinions of QNBFS at a given time only. It is not an offer, promotion or recommendation to buy or sell securities or other investments, nor is it intended to constitute legal, tax, accounting, or financial advice. We therefore strongly advise potential investors to seek independent professional advice before making any investment decision. Although the information in this report has been obtained from sources that QNBFS believes to be reliable, we have not independently verified such information and it may not be accurate or complete. While this publication has been prepared with the utmost degree of care by our analysts, QNBFS does not make any representations warranties as to the accuracy and completeness of the information it may contain, and declines any liability in that respect. QNBFS reserves the right to amend the views and opinions expressed in this publication at any time. It may also express viewpoints or make investment decisions that differ significantly from, or even contradict, the views and opinions included in this report. COPYRIGHT: No part of this document may be reproduced without the explicit written permission of QNBFS. Page 5 of 5 Source: Bloomberg Company Name Price (June 27) % Change 5- Day % Change Monthly Market Cap. QR Million TTM P/E P/B Div. Yield Qatar National Bank 159.00 5.30 6.43 111,257 13.1 2.5 3.8 Qatar Islamic Bank 68.40 (1.30) (0.73) 16,162 14.2 1.5 5.5 Commercial Bank of Qatar 69.50 (0.14) (0.57) 17,198 8.4 1.2 8.6 Doha Bank 47.15 0.43 (0.74) 12,182 8.0 1.2 8.8 Al Ahli Bank 57.00 1.79 1.97 7,243 13.9 2.3 5.3 Qatar International Islamic Bank 53.30 (0.56) (0.93) 8,068 11.7 1.7 6.6 Masraf Al Rayan 27.70 1.47 1.65 20,775 13.4 2.2 3.6 Al Khaliji Bank 16.65 (0.60) (2.06) 5,994 11.5 1.1 6.0 National Leasing 37.35 (0.27) 2.33 1,848 9.0 1.5 5.4 Dlala Holding 26.95 (3.06) 1.32 598 23.3 2.5 N/A Qatar & Oman Investment 13.51 0.82 5.55 426 21.6 1.4 3.7 Islamic Holding Group 43.10 12.83 5.12 172 27.7 4.1 2.6 Banking and Financial Services 201,924 Zad Holding 59.60 (0.83) 0.00 780 7.4 0.6 6.7 Qatar German Co. for Medical Devices 15.89 0.57 8.10 184 N/M 1.0 N/A Salam International Investment 13.00 0.00 0.00 1,486 21.8 0.9 5.4 Medicare Group 42.30 1.93 3.05 1,190 25.8 1.5 4.3 Qatar Cinema & Film Distribution 55.00 (3.51) (5.98) 314 27.5 2.4 3.6 Qatar Fuel 252.00 (0.16) (1.95) 16,372 14.2 3.1 4.0 Qatar Meat and Livestock 63.50 0.95 0.47 1,143 15.2 4.0 6.3 Al Meera Consumer Goods 135.40 (0.73) (3.29) 2,708 17.6 2.3 5.9 Consumer Goods and Services 24,177 Qatar Industrial Manufacturing 51.00 (3.41) (0.58) 2,020 10.3 1.6 5.8 Qatar National Cement 99.00 (1.98) (1.98) 4,861 11.4 2.2 6.1 Industries Qatar 158.50 (2.70) (4.92) 95,893 10.6 3.4 4.9 Qatari Investors Group 27.00 1.50 7.57 3,357 19.6 1.7 2.8 Qatar Electricity and Water 157.10 0.71 8.34 15,710 11.7 3.2 4.6 Mannai Corp. 88.00 0.00 3.53 4,014 8.5 1.9 5.4 Aamal 14.42 0.77 (0.55) 8,652 14.1 1.3 N/A Gulf International Services 41.65 (2.00) (11.38) 6,192 12.2 2.4 3.6 Industrials 140,699 Qatar Insurance 61.00 (1.77) (4.69) 7,834 9.0 1.2 3.3 Doha Insurance 26.00 (0.76) 1.76 669 11.1 1.4 3.5 Qatar General Insurance & Reinsurance 47.70 (1.14) (0.63) 2,750 15.1 1.1 1.8 Al Khaleej Takaful Insurance 44.50 3.01 9.88 760 10.2 1.4 1.9 Qatar Islamic Insurance 62.20 2.13 7.24 933 15.8 3.9 5.6 Insurance 12,946 United Development 23.10 (1.07) 7.44 7,790 9.7 0.8 4.3 Barwa Real Estate 26.80 1.13 1.13 10,429 12.7 0.8 5.6 Ezdan Real Estate 17.49 0.52 0.75 46,392 N/M 1.7 0.7 Mazaya Qatar Real Estate Development 11.34 1.16 2.53 1,134 20.7 1.0 5.3 Real Estate 65,745 Qatar Telecom 120.50 (0.90) (0.99) 38,599 12.2 1.5 4.1 Vodafone Qatar 9.06 0.55 (3.31) 7,659 N/M 1.2 N/A Telecoms 46,258 Qatar Navigation (Milaha) 71.90 0.14 (1.51) 8,234 9.2 0.8 5.2 Gulf Warehousing 41.75 0.60 (0.24) 1,986 22.8 2.7 N/A Qatar Gas Transport (Nakilat) 18.29 2.70 1.89 10,242 13.2 6.0 5.5 Transportation 20,462 Qatar Exchange 512,210