(ANIKA) Budhwar Peth Call Girls Just Call 7001035870 [ Cash on Delivery ] Pun...
Weekly market report
1. Market Review and Outlook
QE Index and Volume
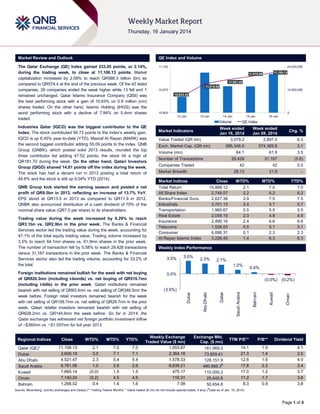
The Qatar Exchange (QE) Index gained 233.05 points, or 2.14%,
during the trading week, to close at 11,106.13 points. Market
capitalization increased by 2.09% to reach QR586.3 billion (bn) as
compared to QR574.4 at the end of the previous week. Of the 42 listed
companies, 28 companies ended the week higher while 13 fell and 1
remained unchanged. Qatar Islamic Insurance Company (QISI) was
the best performing stock with a gain of 10.63% on 0.9 million (mn)
shares traded. On the other hand, Islamic Holding (IHGS) was the
worst performing stock with a decline of 7.84% on 0.4mn shares
traded.
11,150
Regional Indices
Qatar (QE)*
Dubai
Abu Dhabi
Saudi Arabia
Kuwait
Oman
Bahrain
Close
11,106.13
3,609.18
4,521.47
8,761.06
7,665.14
7,140.24
1,268.52
WTD%
MTD%
YTD%
2.1
3.0
2.3
1.0
(0.0)
(0.2)
0.4
7.0
7.1
5.4
2.6
1.5
4.5
1.6
7.0
7.1
5.4
2.6
1.5
4.5
1.6
10,800
0
12-Jan
13-Jan
14-Jan
15-Jan
Volume
Week ended
Jan 16, 2014
3,079.2
586,346.0
574,369.8
61.9
3.5
29,428
31,167
(5.6)
42
42
0.0
28:13
Value Traded (QR mn)
Week ended
Jan 09, 2014
2,897.0
64.1
Market Indicators
31:9
–
Exch. Market Cap. (QR mn)
Volume (mn)
Number of Transactions
Companies Traded
Market Breadth
Market Indices
Close
Total Return
15,868.12
All Share Index
2,748.07
Banks/Financial Svcs.
2,627.36
Industrials
3,701.13
Transportation
1,960.67
Real Estate
2,049.15
Insurance
2,490.16
Telecoms
1,528.00
Consumer
6,086.31
Al Rayan Islamic Index
3,226.45
Market Indices
Weekly Index Performance
3.5%
16-Jan
QE Index
3.0%
2.3%
WTD%
2.1
2.2
2.9
2.4
0.5
2.0
2.4
0.5
0.1
1.4
Chg. %
6.3
2.1
MTD%
7.0
6.2
7.5
5.7
5.5
4.9
6.6
5.1
2.3
6.3
YTD%
7.0
6.2
7.5
5.7
5.5
4.9
6.6
5.1
2.3
6.3
2.1%
1.0%
0.4%
0.0%
Weekly Exchange
Traded Value ($ mn)
1,053.87
2,364.18
1,578.33
8,639.21
475.17
116.31
7.08
Kuwait
Bahrain
(3.5%)
Oman
(0.0%) (0.2%)
Saudi Arabia
Foreign institutions remained bullish for the week with net buying
of QR820.3mn (including t-bonds) vs. net buying of QR519.7mn
(including t-bills) in the prior week. Qatari institutions remained
bearish with net selling of QR83.4mn vs. net selling of QR346.5mn the
week before. Foreign retail investors remained bearish for the week
with net selling of QR108.7mn vs. net selling of QR28.7mn in the prior
week. Qatari retailer investors remained bearish with net selling of
QR628.2mn vs. QR144.6mn the week before. So far in 2014, the
Qatar exchange has witnessed net foreign portfolio investment inflow
of ~$380mn vs. ~$1,057mn for full year 2013.
10,000,000
10,922.36
Qatar
Trading value during the week increased by 6.29% to reach
QR3.1bn vs. QR2.9bn in the prior week. The Banks & Financial
Services sector led the trading value during the week, accounting for
47.1% of the total equity trading value. Trading volume increased by
3.5% to reach 64.1mn shares vs. 61.9mn shares in the prior week.
The number of transaction fell by 5.58% to reach 29,428 transactions
versus 31,167 transactions in the prior week. The Banks & Financial
Services sector also led the trading volume, accounting for 33.2% of
the total.
10,975
Abu Dhabi
QNB Group kick started the earning season and posted a net
profit of QR9.5bn in 2013, reflecting an increase of 13.7% YoY.
EPS stood at QR13.5 in 2013 as compared to QR11.9 in 2012.
QNBK also announced distribution of a cash dividend of 70% of the
nominal share value (QR7.0 per share) to its shareholders
11,051.48
11,019.86
Dubai
Industries Qatar (IQCD) was the biggest contributor to the QE
Index. The stock contributed 56.73 points to the index‟s weekly gain.
IQCD is up 6.45% year-to-date (YTD). Masraf Al Rayan (MARK) was
the second biggest contributor adding 55.09 points to the index. QNB
Group (QNBK), which posted solid 2013 results, rounded the top
three contributor list adding 47.52 points; the stock hit a high of
QR181.70 during the week. On the other hand, Qatari Investors
Group (QIGD) shaved 14.81 points off the index during the week.
The stock has had a decent run in 2013 posting a total return of
44.8% and the stock is still up 9.04% YTD (2014).
20,000,000
11,106.13
11,075.98
Exchange Mkt.
Cap. ($ mn)
TTM P/E**
P/B**
Dividend Yield
161,069.2
73,859.41
128,151.9
480,888.3#
110,000.2
25,445.8
50,654.8
14.1
21.3
12.6
17.8
17.0
11.2
8.3
1.9
1.4
1.6
2.2
1.2
1.7
0.9
4.1
2.5
4.0
3.4
3.7
3.6
3.8
#
Source: Bloomberg, country exchanges and Zawya (** Trailing Twelve Months; * Value traded ($ mn) do not include special trades, if any) ( Data as of Jan. 15, 2014)
Page 1 of 5
2. News
Economic News
QNB Group: $30bn Qatar spend, mega GCC region
projects to drive Gulf growth in 2014 – According to a report
by QNB Group, Qatar‟s project spending estimated at $30bn
this year and large-scale projects across the GCC will drive the
region‟s growth in 2014. In the short term, the GCC region will
drive the MENA region‟s growth, mainly through heavy
spending on infrastructure. In the GCC region, many countries
including Saudi Arabia and Kuwait have huge project spending
outlay this year. Dubai‟s successful bid for the World Expo 2020
and a number of new real estate developments will boost
project spending in the UAE. The Saudi government alone is
spending in excess of $50bn on infrastructure projects through
its budget, which excludes significant project spending by the
private sector and state-owned companies. The report also said
greater integration into the global economy of the MENA region
(ex-GCC region) through increased trade openness and
enhanced competitiveness could raise long-term growth
prospects. QNB Group estimates that real GDP growth in the
GCC region stood at 3.7% in 2013, compared with 1.2% in the
rest of MENA. This is relatively sluggish compared with the
historical average MENA growth of around 5% or higher. (GulfTimes.com)
Qatar CPI inflation fell to 2.7% YoY in December (rental
inflation at lowest level since February 2013) – Qatar‟s cost
of living, based on consumer price index (CPI), fell to 2.7% YoY
in December from 2.8% YoY in November, according to the
Ministry of Development Planning & Statistics. On a monthly
basis, inflation was unchanged for the second consecutive
month in December. The housing and rent component (32.3%
of the overall CPI weight) slowed to 4.8% YoY (up 0.2% MoM)
which is the slowest pace of increase since February 2013.
Food, beverages & tobacco saw a 3.1% acceleration YoY in
December 2013 (up 0.2% MoM). However, the entertainment,
recreation & culture group rose to 5.2% YoY (0.1% MoM).
Furniture, textiles & home appliances surged 4% YoY in
December 2013, while it was down 0.1% MoM. The garments
and footwear group saw its price rise 0.9% YoY (0.2% MoM).
The medical care and medical services group reported a 2.1%
increase YoY, but the group remained unchanged MoM.
However, miscellaneous goods & services became cheaper by
5.4% YoY in December 2013 (0.8% MoM). (Gulf-Times.com)
Market & Corporate News
QE best performer among Arab stock markets since 2009 –
The Qatar Exchange (QE) has posted the strongest recovery
among all the Arab stock markets since March 2009, recording
a surge of 139.39% in its index during 2009-2013. QE is
followed by the Dubai Financial Market with an increase of
117.59%, the Saudi stock exchange (93.35%), the Egyptian
Exchange (85.96%), the Abu Dhabi Securities Market
(75.25%), and the Kuwait Stock Exchange (18.12%). During the
2009-2013 period, the QE Total Return index increased by
206.94% and QE Al Rayyan Islamic Index rose by 267.97%
(both including dividends). Furthermore, QE‟s main benchmark
QE Index rose by 24.17% in 2013, while the QE Al Rayyan
Islamic Index rose by 22%. The market capitalization of all
shares traded in QE reached QR555.6bn at the end of 2013 as
against QR459.9bn at the end of 2012, while the total value of
shares traded during 2013 rose 6% to reach QR74.9bn versus
QR70.7bn during 2012. (QE)
QNB Group’s net profit rises 13.7% YoY in 2013 – QNB
Group has reported a net profit of QR9.5bn in 2013, reflecting
an increase of 13.7% YoY. EPS was QR13.5 in 2013 as
compared to QR11.9 in 2012.Net interest income increased by
26.3% YoY to reach QR11.6bn. Total assets stood at QR443bn
at the end of December 2013, up by 20.9% from December
2012. Net loans & advances rose by 24.3% from 2012 to reach
QR311bn, while total customer deposits were up by 24.3% from
2012 to reach QR336bn. QNB Group has been able to maintain
the ratio of non-performing loans to gross loans at 1.6%, a level
considered one of the lowest among banks in the Middle East
and Africa. Meanwhile, the group‟s board has recommended
the distribution of a cash dividend of 70% of the nominal share
value (QR7.0 per share) to its shareholders. (QE, QNB Group
press release)
ABQK posted a net profit of QR112.1mn in 4Q2013 – Al Ahli
Bank (ABQK) reported a decline of 21.5% QoQ to QR112.1mn
in its net profit in 4Q2013. Net profit for 2013 rose by 13% YoY
to QR525.7mn. Net interest income was up by 2.6% QoQ to
QR183.7mn in 4Q2013, while it increased by 27.8% YoY to
QR685.4mn in 2013. EPS amounted to QR4.14 in 2013 as
compared to QR3.88 in 2012. Total assets stood at QR26.2bn
as at December 31, 2013, reflecting an increase of 27.0% YoY.
Loans & advances rose by 23.5% YoY to QR17.3bn, while
customer deposits were up by 35.4% YoY to QR18.9bn.
Meanwhile, the bank‟s board of directors has approved the
budget and recommended the distribution of bonus shares 30%
from its capital shares on December 31, 2013 subject to the
approval of QCB and the general assembly meeting.
Furthermore, the board has decided to open a nomination to
the Qatari Shareholders to elect six members to the board of
directors for a period of three years (2014-2016). The AGM of
Ahlibank is determined on February 25, 2014. In case no
quorum, the second meeting will be on March 4, 2014. (QE)
IHGS’ net profit declines 22.6% QoQ – The Islamic Holding
Group (IHGS) has reported a net profit of QR2.0mn in 4Q2013,
reflecting a fall of 22.6% QoQ. However, net profit for the entire
2013 amounted to QR9.0mn, rising 49.4% YoY. Net brokerage
& commission income rose by 30.5% QoQ to reach QR4.5mn
in 4Q2013, while it was up by 6% YoY to QR13.6mn in 2013.
EPS amounted to QR2.26 in 2013 as compared to QR1.51 in
2012. Meanwhile, IHGS‟ board has recommended distributing
cash dividends of 17% of the paid-up capital of shares (by
QR1.7 per share) to its shareholders. (QE)
CBQK raises QR2bn in Tier 1 perpetual capital notes – The
Commercial Bank of Qatar (CBQK) has raised QR2bn in
additional Tier 1 perpetual capital notes to enhance its capital
adequacy ratios and to support future growth across the group.
The transaction was completed on December 31, 2013. (QE)
MERS signs deal with Shannon Engineering to build 2
stores – Al Meera Consumer Goods Company (MERS) has
signed an agreement with Shannon Engineering for the
construction of two new stores in Al Muraikh and Jeryan
Nejaima areas. Shannon Engineering will build the two stores –
at Al Muraikh on an area of 5,526 square meters and at Jeryan
Nejaima on 5,526 square meters. They are expected to be
completed in nine months. MERS is planning to open about 10
new branches by the end of 2014. (Gulf-Times.com)
Nakilat, Qatargas and RasGas opt for cleaner marine fuel –
Qatari shipping company and LNG producers have announced
that they would choose to use cleaner marine fuel and reduce
emissions of their ships. Qatari shipping company Nakilat and
LNG producers Qatargas and RasGas Company have agreed
with the engine manufacturer MAN Diesel & Turbo to convert a
Q-Max vessel to use LNG as an alternative to heavy fuel oil in
the main engines. (Peninsula Qatar)
Page 2 of 5
3. Qatar Exchange
Top 5 Gainers
Top 5 Decliners
0.0%
12.0%
10.6%
10.5%
9.1%
-3.0%
8.0%
-2.9%
-3.6%
5.9%
-3.5%
Doha
Insurance
Dlala Holding
5.5%
4.0%
-6.0%
-5.6%
-7.8%
0.0%
Qatar Islamic
Insurance
Al Ahli Bank
Mazaya Qatar Qatar German
Gulf
Co. for Medical International
Devices
Services
Source: Qatar Exchange (QE)
-9.0%
Islamic
Holding Group
Qatari
Investors
Group
Medicare
Group
Source: Qatar Exchange (QE)
Most Active Shares by Value (QR Million)
Most Active Shares by Volume (Million)
750.0
15.0
581.9
10.5
500.0
10.0
7.0
272.1
250.0
241.7
5.1
5.0
229.4
4.5
4.3
Qatari
Investors
Group
Barwa Real
Estate
178.0
0.0
0.0
Mazaya Qatar
QNB Group
Industries
Qatar
Masraf Al
Rayan
Qatari
Investors
Group
Commercial
Bank of Qatar
Source: Qatar Exchange (QE)
Masraf Al
Rayan
Vodafone
Qatar
Source: Qatar Exchange (QE)
Investor Trading Percentage to Total Value Traded
Net Traded Value by Nationality (QR Million)
712
10.27%
100%
36.91%
Non-Qatari
14.03%
748
80%
60%
10.50%
1,460
27.36%
24.65%
40%
48.34%
20%
(712)
27.94%
Qatari
2,331
1,619
0%
Buy
Sell
Qatari Individuals
Qatari Institutions
Non-Qatari Individuals
Non-Qatari Institutions
Source: Qatar Exchange (QE)
(1,000)
(500)
-
Net Investment
500
1,000
Total Sold
1,500
2,000
2,500
Total Bought
Source: Qatar Exchange (QE)
Page 3 of 5
4. TECHNICAL ANALYSIS OF THE QE INDEX
Source: Bloomberg
The QE Index extended its relentless rally last week, tagging a series of new 52-week highs and registered gains on every single day for the second
consecutive week. Moreover the index moved above the 11,000.0 and 11,100.0 psychological levels for the first time since 2008, as high demand pushed
prices higher. The index is now witnessing a firm bull grip and may continue to scale higher, targeting the 11,200.0 and 11,300.0 psychological levels. If the
demand persists above these levels the bulls may continue their domination over the bears and push the index higher. We believe the uptrend in the index
may remain intact and may continue to advance until it trades above the support of the ascending trendline. Meanwhile, both momentum indicators are in
uptrend mode and are showing no immediate trend reversal signs indicating that this rally has enough steam to accelerate further. On the flip side, traders
may need to keep a close eye on the support of the ascending trendline near 11,000.0 for any reversal signs. Thus, traders may adopt a bullish approach,
but are advised to exercise cautious if the index dips below the support of the ascending trendline.
DEFINITIONS OF KEY TERMS USED IN TECHNICAL ANALYSIS
RSI (Relative Strength Index) indicator – RSI is a momentum oscillator that measures the speed and change of price movements. The RSI oscillates
between 0 to 100. The index is deemed to be overbought once the RSI approaches the 70 level, indicating that a correction is likely. On the other hand, if
the RSI approaches 30, it is an indication that the index may be getting oversold and therefore likely to bounce back.
MACD (Moving Average Convergence Divergence) indicator – The indicator consists of the MACD line and a signal line. The divergence or the
convergence of the MACD line with the signal line indicates the strength in the momentum during the uptrend or downtrend, as the case may be. When the
MACD crosses the signal line from below and trades above it, it gives a positive indication. The reverse is the situation for a bearish trend.
Candlestick chart – A candlestick chart is a price chart that displays the high, low, open, and close for a security. The „body‟ of the chart is portion between
the open and close price, while the high and low intraday movements form the „shadow‟. The candlestick may represent any time frame. We use a one-day
candlestick chart (every candlestick represents one trading day) in our analysis.
Doji candlestick pattern – A Doji candlestick is formed when a security's open and close are practically equal. The pattern indicates indecisiveness, and
based on preceding price actions and future confirmation, may indicate a bullish or bearish trend reversal.
Shooting Star/Inverted Hammer candlestick patterns – These candlestick patterns have a small real body (open price and close price are near to each
other), and a long upper shadow (large intraday movement on the upside). The Shooting Star is a bearish reversal pattern that forms after a rally. The
Inverted Hammer looks exactly like a Shooting Star, but forms after a downtrend. Inverted Hammers represent a potential bullish trend reversal.
Page 4 of 5
5. Price % Change 5(Jan 16)
Day
Company Name
180.00
Qatar National Bank
% Change
YTD
Market Cap.
QR Million
TTM P/E
P/B
Div. Yield
3.15
4.65
125,951
13.3
2.4
3.3
Qatar Islamic Bank
73.80
(1.47)
6.96
17,438
16.1
1.5
5.1
Commercial Bank of Qatar
75.00
1.76
5.93
18,558
10.6
1.3
8.0
Doha Bank
64.10
1.75
10.14
16,562
11.2
1.8
6.5
Al Ahli Bank
63.40
10.45
15.27
8,057
15.3
2.3
4.7
Qatar International Islamic Bank
70.80
4.12
14.75
10,717
15.0
2.1
4.9
Masraf Al Rayan
35.15
5.24
12.30
26,363
15.8
2.6
2.8
Al Khaliji Bank
21.00
0.96
5.05
7,560
14.2
1.4
4.8
National Leasing
30.50
(1.29)
1.16
1,509
12.9
1.2
6.6
Dlala Holding
22.87
(3.50)
3.48
508
N/M
2.3
N/A
Qatar & Oman Investment
12.87
(1.08)
2.80
405
27.0
1.2
3.9
Islamic Holding Group
47.00
(7.84)
2.17
188
20.8
3.2
2.4
233,816
Banking and Financial Services
Zad Holding
69.70
0.58
0.29
912
9.2
0.7
5.7
Qatar German Co. for Medical Devices
14.51
5.91
4.77
168
N/M
0.9
N/A
Salam International Investment
13.25
1.69
1.84
1,515
11.7
0.9
5.3
Medicare Group
53.10
(2.93)
1.14
1,494
24.3
1.9
3.4
Qatar Cinema & Film Distribution
42.70
4.15
6.48
244
32.6
1.8
4.7
289.90
0.31
2.04
18,834
15.7
3.1
3.4
52.10
(2.07)
0.77
938
15.6
3.9
7.7
142.00
(0.14)
6.53
2,840
19.5
2.3
5.6
Qatar Fuel
Qatar Meat and Livestock
Al Meera Consumer Goods
26,945
Consumer Goods and Services
52.80
1.93
4.35
2,091
9.9
1.5
5.7
Qatar National Cement
119.40
0.34
0.34
5,863
13.8
2.4
5.0
Industries Qatar
179.80
3.39
6.45
108,779
13.4
3.4
4.3
(5.64)
9.04
5,924
25.4
2.8
1.6
183.00
2.92
0.60
18,300
12.1
3.2
4.0
Mannai Corp.
91.00
2.25
1.22
4,151
9.0
1.8
5.2
Aamal
14.98
(0.13)
(0.13)
8,988
14.3
1.4
N/A
Gulf International Services
71.40
5.47
10,615
17.5
3.7
2.1
Qatar Industrial Manufacturing
47.65
Qatari Investors Group
Qatar Electricity and Water
17.05
164,711
Industrials
Qatar Insurance
72.80
1.96
9.47
9,350
11.5
1.9
2.8
Doha Insurance
26.95
(3.58)
7.80
694
12.3
1.4
3.4
Qatar General Insurance & Reinsurance
45.45
2.13
(5.11)
2,620
3.0
0.8
1.9
Al Khaleej Takaful Insurance
39.30
5.08
7.67
671
14.0
1.1
2.1
Qatar Islamic Insurance
64.50
10.63
11.40
968
15.2
3.5
5.4
14,302
Insurance
United Development
23.23
1.22
2.74
7,834
9.6
0.7
4.3
Barwa Real Estate
31.50
1.78
5.70
12,257
18.0
0.9
4.8
Ezdan Real Estate
17.12
(0.75)
0.71
45,411
53.5
1.6
0.8
Mazaya Qatar Real Estate Development
12.48
9.09
11.63
1,248
18.9
1.1
4.8
66,750
Real Estate
144.00
0.00
4.96
46,126
17.5
1.9
3.5
11.35
3.18
5.98
9,595
N/M
1.6
N/A
Qatar Navigation (Milaha)
90.50
(0.55)
9.04
10,365
10.6
0.9
4.1
Gulf Warehousing
41.55
1.34
0.12
1,976
19.8
2.5
N/A
Qatar Gas Transport (Nakilat)
Transportation
21.00
1.20
3.70
11,760
15.4
3.3
4.8
Qatar Telecom
Vodafone Qatar
55,721
Telecoms
24,101
Qatar Exchange
586,346
Source: Bloomberg
Contacts
Saugata Sarkar
Ahmed M. Shehada
Keith Whitney
Sahbi Kasraoui
Head of Research
Head of Trading
Head of Sales
Manager - HNWI
Tel: (+974) 4476 6534
Tel: (+974) 4476 6535
Tel: (+974) 4476 6533
Tel: (+974) 4476 6544
saugata.sarkar@qnbfs.com.qa
ahmed.shehada@qnbfs.com.qa
keith.whitney@qnbfs.com.qa
sahbi.alkasraoui@qnbfs.com.qa
QNB Financial Services SPC
Contact Center: (+974) 4476 6666
PO Box 24025, Doha, Qatar
DISCLAIMER: This publication has been prepared by QNB Financial Services SPC (“QNBFS”) a wholly-owned subsidiary of Qatar National Bank (“QNB”). QNBFS is regulated by the Qatar
Financial Markets Authority and the Qatar Exchange; QNB is regulated by the Qatar Central Bank. This publication expresses the views and opinions of QNBFS at a given time only. It is not an
offer, promotion or recommendation to buy or sell securities or other investments, nor is it intended to constitute legal, tax, accounting, or financial advice. We therefore strongly advise potential
investors to seek independent professional advice before making any investment decision. Although the information in this report has been obtained from sources that QNBFS believes to be
reliable, we have not independently verified such information and it may not be accurate or complete. While this publication has been prepared with the utmost degree of care by our analysts,
QNBFS does not make any representations warranties as to the accuracy and completeness of the information it may contain, and declines any liability in that respect. QNBFS reserves the right
to amend the views and opinions expressed in this publication at any time. It may also express viewpoints or make investment decisions that differ significantly from, or even contradict, the views
and opinions included in this report.
COPYRIGHT: No part of this document may be reproduced without the explicit written permission of QNBFS.
Page 5 of 5