1. Market Review and Outlook
QE Index and Volume
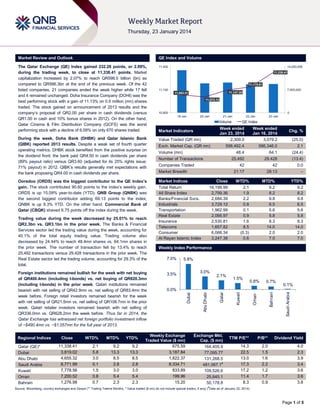
The Qatar Exchange (QE) Index gained 232.28 points, or 2.09%,
during the trading week, to close at 11,338.41 points. Market
capitalization increased by 2.07% to reach QR598.5 billion (bn) as
compared to QR586.3bn at the end of the previous week. Of the 42
listed companies, 21 companies ended the week higher while 17 fell
and 4 remained unchanged. Doha Insurance Company (DOHI) was the
best performing stock with a gain of 11.13% on 0.5 million (mn) shares
traded. The stock gained on announcement of 2013 results and the
company‟s proposal of QR2.00 per share in cash dividends (versus
QR1.00 in cash and 10% bonus shares in 2012). On the other hand,
Qatar Cinema & Film Distribution Company (QCFS) was the worst
performing stock with a decline of 6.09% on only 670 shares traded.
11,400
14,000,000
11,338.41
11,179.61
11,150
11,072.13
10,900
0
19-Jan
20-Jan
21-Jan
598,492.4
586,346.0
2.1
48.4
64.1
(24.4)
25,492
29,428
(13.4)
42
42
0.0
21:17
28:13
–
Ooredoo (ORDS) was the biggest contributor to the QE Index’s
gain. The stock contributed 90.60 points to the index‟s weekly gain.
ORDS is up 15.09% year-to-date (YTD). QNB Group (QNBK) was
the second biggest contributor adding 69.13 points to the index;
QNBK is up 9.3% YTD. On the other hand, Commercial Bank of
Qatar (CBQK) shaved 6.75 points off the index during the week.
Market Indices
Close
Total Return
16,199.99
All Share Index
2,799.36
Banks/Financial Svcs.
2,684.39
Industrials
3,729.12
Transportation
1,962.99
Real Estate
2,066.97
Insurance
2,530.81
Telecoms
1,657.82
Consumer
6,066.34
Al Rayan Islamic Index
3,247.38
Market Indices
Weekly Index Performance
Regional Indices
Qatar (QE)*
Dubai
Abu Dhabi
Saudi Arabia
Kuwait
Oman
Bahrain
Close
11,338.41
3,819.02
4,655.32
8,771.99
7,778.56
7,200.52
1,276.98
WTD%
MTD%
YTD%
2.1
5.8
3.0
0.1
1.5
0.8
0.7
9.2
13.3
8.5
2.8
3.0
5.4
2.3
9.2
13.3
8.5
2.8
3.0
5.4
2.3
QE Index
Week ended
Jan 16, 2014
3,079.2
Exch. Market Cap. (QR mn)
Volume (mn)
Number of Transactions
Companies Traded
Market Breadth
WTD%
2.1
1.9
2.2
0.8
0.1
0.9
1.6
8.5
(0.3)
0.6
Chg. %
(25.0)
MTD%
9.2
8.2
9.8
6.5
5.6
5.8
8.3
14.0
2.0
7.0
YTD%
9.2
8.2
9.8
6.5
5.6
5.8
8.3
14.0
2.0
7.0
3.0%
3.5%
2.1%
1.5%
0.8%
0.7%
Bahrain
5.8%
Oman
7.0%
23-Jan
Week ended
Jan 23, 2014
2,309.0
Market Indicators
Value Traded (QR mn)
0.1%
Weekly Exchange
Traded Value ($ mn)
675.59
3,187.84
1,822.37
8,334.71
833.89
199.96
15.20
Exchange Mkt.
Cap. ($ mn)
164,405.9
77,095.77
131,268.5
481,067.1#
109,526.6
25,645.1
50,178.8
Saudi Arabia
Kuwait
Abu Dhabi
Qatar
0.0%
Dubai
Foreign institutions remained bullish for the week with net buying
of QR400.4mn (including t-bonds) vs. net buying of QR820.3mn
(including t-bonds) in the prior week. Qatari institutions remained
bearish with net selling of QR42.9mn vs. net selling of QR83.4mn the
week before. Foreign retail investors remained bearish for the week
with net selling of QR21.5mn vs. net selling of QR108.7mn in the prior
week. Qatari retailer investors remained bearish with net selling of
QR336.0mn vs. QR628.2mn the week before. Thus far in 2014, the
Qatar Exchange has witnessed net foreign portfolio investment inflow
of ~$490.4mn vs. ~$1,057mn for the full year of 2013.
22-Jan
Volume
During the week, Doha Bank (DHBK) and Qatar Islamic Bank
(QIBK) reported 2013 results. Despite a weak set of fourth quarter
operating metrics, DHBK stock benefited from the positive surprise on
the dividend front; the bank paid QR4.50 in cash dividends per share
(89% payout ratio) versus QR3.60 (adjusted for its 25% rights issue;
71% payout) in 2012. QIBK‟s results generally met expectations with
the bank proposing QR4.00 in cash dividends per share.
Trading value during the week decreased by 25.01% to reach
QR2.3bn vs. QR3.1bn in the prior week. The Banks & Financial
Services sector led the trading value during the week, accounting for
40.1% of the total equity trading value. Trading volume also
decreased by 24.44% to reach 48.4mn shares vs. 64.1mn shares in
the prior week. The number of transaction fell by 13.4% to reach
25,492 transactions versus 29,428 transactions in the prior week. The
Real Estate sector led the trading volume, accounting for 29.3% of the
total.
7,000,000
11,147.39
11,093.01
TTM P/E**
P/B**
Dividend Yield
14.3
22.5
13.0
17.3
17.2
11.4
8.3
2.0
1.5
1.6
2.2
1.2
1.7
0.9
4.0
2.3
3.9
3.4
3.6
3.6
3.8
#
Source: Bloomberg, country exchanges and Zawya (** Trailing Twelve Months; * Value traded ($ mn) do not include special trades, if any) ( Data as of January 22, 2014)
Page 1 of 5
2. News
Economic News
Qatar PPI falls 0.3% in October 2013 on lower crude, LNG
prices – According to data released by the Ministry of
Development Planning & Statistics (MDPS), lower prices for
crude, natural gas, basic metals and refined petroleum goods
resulted in Qatar‟s producer price index (PPI) to fall 0.3% in
October from the previous month. The PPI for mining, which
carries the maximum weight of 77% in the basket, was down
0.4% in October, mainly due to a 0.4% fall in the price of crude
petroleum and gas. However, the manufacturing sector, with a
weight of 21% in the PPI basket, reported 0.3% gain in October
over September 2013 due to a 2.5% rise in the price of basic
chemicals. However, basic metals prices were lower by 1%;
refined petroleum products, beverages, dairy products and
grain mill products by 0.3% each, and glass and glass products
by 0.1%. The electricity and water group, which has a 2%
weight in the PPI basket, saw its index fall 0.4% in October
against September 2013. Electricity prices decreased 1.6%,
while water prices rose 1.7%. (Gulf-Times.com)
Qatar plans to complete New Doha Port soon – Qatar is
planning to advance the completion of its mammoth QR27bn
New Doha Port coming up near Mesaieed by 2020 rather than
the original deadline of 2030, as the country prepares to host
the FIFA World Cup in 2022. HE the Transport Minister Jassim
Seif Ahmed al-Sulaiti stated that attempt is being made to
merge the first and second phases of the project with an aim to
complete the third phase of a total container capacity of 6mn
twenty-foot equivalent units (TEUs) containers by 2020 itself.
As per the original plan, the first phase was slated to become
operational by 1Q2016 with a capacity of 2mn TEUs, 2mn
TEUs expected to be operational by 2022 and another 2mn
TEUs by 2030. (Gulf-Times.com)
Market & Corporate News
MPHC raises QR3.2bn in Qatar’s first IPO since 2010 –
Qatar Petroleum‟s (QP) unit Mesaieed Petrochemical Holding
Company (MPHC) has raised QR3.2bn in the first IPO in Qatar
since 2010. All the 323.19mn shares offered, representing
25.7%, have been successfully sold. QP said the stock would
start trading on the market next month. (Reuters)
DHBK reports net profit of QR236.0mn vs. QR327.2mn
(BBG consensus estimate) in 4Q2013 – Doha Bank (DHBK)
reported a net profit of QR236.0mn in 4Q2013, dropping by
28.2% QoQ. Earnings per share for 2013 stood at QR5.29.
Total assets rose to QR67bn in 2013, representing a 21.3%
YoY growth. Loans & advances rose by 21.8% from QR33.8bn
in 2012 to QR41.1bn in 2013, while customer deposits
expanded 23.6% to QR42.5bn in 2013. Meanwhile, the bank
has declared a 45% (QR4.5/share) cash dividend (dividend
yield of 6.9%), which will have to be approved by the Qatar
Central Bank and its shareholders. DHBK‟s Chairman Sheikh
Fahad bin Mohamad bin Jabor al-Thani said the bank is aiming
for 15-20% asset growth over the next four to five years.
(QNBFS Research, Gulf-Times.com, Qatar Tribune)
QIBK 4Q2013 net profit broadly in line with our
expectations – QIBK posted a net profit (to equity) of
QR360.3mn in 4Q2013 vs. our estimate of QR365.3mn (BBG
consensus, ex-QNBFS: QR340mn). Net income increased by
4.4% QoQ. Profitability was driven by net financing income
(+6.4% QoQ). However, income from investing activities
(QR180.6mn) declined by 20.3% QoQ. Cash dividend
increased to QR4/share. QIBK upped its DPS to QR4.00 from
QR3.75 in 2012. For 2014, we expect a DPS of QR4.25. 2013
analysis: QIBK‟s loan book expanded by 9.3% YoY to
QR47.1bn in 2013. Equity of unrestricted investment account
holders (URIA) also increased by 11.2% YoY to QR37.9bn.
Furthermore, customers deposits in current accounts increased
by 37.3% YoY to QR12.5bn. Hence, the loan-to-deposit ratio
declined to 93.6% vs. 100.0% at the end of 2012. In terms of
the investment book, total investments increased by 11.2%
YoY. Growth was driven by fixed income securities while equity
investments declined YoY. (QNBFS Research, QE)
GWCS’ 4Q2013 bottom-line up by 18.2% QoQ – Gulf
Warehousing reported a net profit of QR26.83mn vs.
QR22.71mn in 3Q2013. The firm booked other income of
QR1mn in 4Q2013 vs. QR0.08mn in 2012, which was the
primary difference vs. our bottom-line estimate of QR25.3mn.
For the full year (2013), profit to equity holders stood at
QR101.6mn vs. QR84.9mn in 2012, up 19.7% YoY. The
company announced a cash DPS of QR1.50 vs. a 20% stock
dividend in 2012. For FY2013, overall revenue increased to
QR527.3mn in 2013 vs. QR479.7mn in 2012, a growth of 9.9%
YoY. In our view, the growth primarily came from LVQ Phase 3
coming online in 2013. Direct costs increased 4.0% YoY.
Furthermore, G&A expenses increased by 3.7% YoY. On the
Imdad front, GWCS booked a provision of QR6.3mn (51%
share leads to a hit of QR3.2mn). (QNBFS Research, QE)
IQCD announces shutdown schedule of its production
facilities in 1Q2014 – Industries Qatar (IQCD) has confirmed
its planned shutdown timetable for 1Q2014 for all its Qatarbased production facilities. The planned shutdown schedule,
with prior year comparatives, is as follows: Ethylene: 35 days
(1Q2013: 0 days); LDPE: 34 days (1Q2013: 11 days); LLDPE:
11days (1Q2013: 0 days); Methanol: 10 days (1Q2013: 0 days);
MTBE: 8 days (1Q2013: 0 days); Ammonia: 40 days (1Q2013:
1 day); Urea: 40 days (1Q2013: 7 days); and Steel ( DR, EF/CC
& RM): 22 days (1Q2013: 40 days). This shut-down schedule is
indicative of current plans only, and actual down-time may vary
from the latest plan. The announced shutdowns are somewhat
different from previously detailed maintenance-related
shutdowns stated in IQCD‟s 5-year business plan. We do not
expect material changes to our estimates as a result of these
announced shutdowns. (QNBFS Research, QE)
BRES selling its Barwa Bank stake for QR2.4bn – Barwa
Real Estate Group (BRES) is selling its 37.34% stake in Barwa
Bank for QR2.4bn. This deal is part of an existing agreement
between Qatari Diar and BRES, according to which Barwa sells
some of its assets to Qatari Diar and uses the profit of those
transactions to pay off some credit facilities. The deal is
expected to reflect on the company‟s financial results in
4Q2013. BRES has sold all its shares in Barwa Bank after
using its rights to buy back 40.746.660 million shares, about
14% of the bank‟s shares in December 2013. The group is
currently obtaining the necessary regulatory approvals to
complete the transaction. (QE)
DOHI reports net profit of QR28mn in 4Q2013 – Doha
Insurance Company (DOHI) reported a net profit of QR28mn in
4Q2013, reflecting an increase of 854.8% QoQ. Net profit for
2013 amounted to QR67mn, rising 11.2% YoY. Net premiums
rose by 14.6% QoQ to QR21.9mn in 4Q2013, while it was up
marginally YoY to QR106.3mn in 2013. EPS amounted to
QR2.60 in 2013 as compared to QR2.34 in 2012. Meanwhile,
DOHI‟s board of directors has proposed dividend distribution of
20% from the share par value i.e. QR2.00 for each share to its
shareholders. (QE)
Page 2 of 5
3. Qatar Exchange
Top 5 Gainers
Top 5 Decliners
0.0%
12.0%
11.1%
9.7%
-1.9%
-2.1%
-2.6%
-3.0%
8.0%
-3.2%
4.4%
4.0%
3.5%
3.4%
Al Ahli Bank
-6.0%
Gulf
International
Services
0.0%
-6.1%
-9.0%
Doha
Insurance
Ooredoo
QNB Group
Source: Qatar Exchange (QE)
Qatar Cinema Qatar German Mazaya Qatar Qatar General Qatar Islamic
& Film
Co. for
Insurance &
Insurance
Distribution
Medical
Reinsurance
Devices
Source: Qatar Exchange (QE)
Most Active Shares by Value (QR Million)
Most Active Shares by Volume (Million)
600.0
9.0
6.5
400.0
6.3
6.0
340.4
4.6
221.5
3.5
209.0
200.0
3.0
3.0
166.8
117.5
0.0
0.0
QNB Group
Industries
Qatar
Barwa Real
Estate
Qatari
Investors
Group
Source: Qatar Exchange (QE)
Vodafone Qatar Mazaya Qatar
United
Development
Net Traded Value by Nationality (QR Million)
379
18.08%
100%
Qatari
Investors
Group
Source: Qatar Exchange (QE)
Investor Trading Percentage to Total Value Traded
35.42%
Non-Qatari
714
12.84%
80%
60%
Barwa Real
Estate
Qatar Islamic
Bank
1,093
11.91%
20.51%
18.65%
40%
48.57%
20%
(379)
34.02%
Qatari
1,595
1,216
0%
Buy
Sell
Qatari Individuals
Qatari Institutions
Non-Qatari Individuals
Non-Qatari Institutions
Source: Qatar Exchange (QE)
(500)
Net Investment
500
1,000
Total Sold
1,500
2,000
Total Bought
Source: Qatar Exchange (QE)
Page 3 of 5
4. TECHNICAL ANALYSIS OF THE QE INDEX
Source: Bloomberg
The QE Index extended its remarkable rally for the third consecutive session, tagging a new 52-week high. The index after consolidating on Sunday &
Monday gained momentum on Tuesday and continued its uptrend registering strong gains on Thursday. Bulls once again dominated the bears as rising
buying demand pushed the index to its weekly high, clearing the 11,200.0 and 11,300.0 psychological levels for the first time since 2008. We believe the
index is currently in bull run mode and may continue to advance higher targeting the 11,400.0-11,500.0 levels. Moreover, the bullishness in the RSI is intact,
while the MACD is diverging away from the signal line on the upside suggesting this rally may continue for a longer period of time. On the flip side, traders
may need to keep a close watch on the ascending trendline support near the 11,170.0 levels for any reversal signs. Any pullback toward these levels may
provide buying opportunities for traders. However, a dip below these levels may drag the index toward 11,100.0. Thus, we expect a bullish week ahead.
Investors may continue to remain positive, but must closely follow the support levels
DEFINITIONS OF KEY TERMS USED IN TECHNICAL ANALYSIS
RSI (Relative Strength Index) indicator – RSI is a momentum oscillator that measures the speed and change of price movements. The RSI oscillates
between 0 to 100. The index is deemed to be overbought once the RSI approaches the 70 level, indicating that a correction is likely. On the other hand, if
the RSI approaches 30, it is an indication that the index may be getting oversold and therefore likely to bounce back.
MACD (Moving Average Convergence Divergence) indicator – The indicator consists of the MACD line and a signal line. The divergence or the
convergence of the MACD line with the signal line indicates the strength in the momentum during the uptrend or downtrend, as the case may be. When the
MACD crosses the signal line from below and trades above it, it gives a positive indication. The reverse is the situation for a bearish trend.
Candlestick chart – A candlestick chart is a price chart that displays the high, low, open, and close for a security. The „body‟ of the chart is portion between
the open and close price, while the high and low intraday movements form the „shadow‟. The candlestick may represent any time frame. We use a one-day
candlestick chart (every candlestick represents one trading day) in our analysis.
Doji candlestick pattern – A Doji candlestick is formed when a security's open and close are practically equal. The pattern indicates indecisiveness, and
based on preceding price actions and future confirmation, may indicate a bullish or bearish trend reversal.
Shooting Star/Inverted Hammer candlestick patterns – These candlestick patterns have a small real body (open price and close price are near to each
other), and a long upper shadow (large intraday movement on the upside). The Shooting Star is a bearish reversal pattern that forms after a rally. The
Inverted Hammer looks exactly like a Shooting Star, but forms after a downtrend. Inverted Hammers represent a potential bullish trend reversal.
Page 4 of 5
5. Price
(Jan 23)
Com pany Nam e
% Change
5-Day
% Change
YTD
Mark e t Cap.
QR Million
TTM P/E
P/B Div. Yie ld
188.00
4.44
9.30
131,549
13.9
2.5
3.2
Qatar Islamic Bank
75.60
2.44
9.57
17,864
13.4
1.5
5.0
Commercial Bank of Qatar
74.20
(1.07)
4.80
18,361
10.5
1.3
8.1
Doha Bank
65.20
1.72
12.03
16,846
9.9
1.5
6.4
Al Ahli Bank
65.60
3.47
19.27
8,336
15.9
2.3
4.6
Qatar International Islamic Bank
70.80
0.00
14.75
10,717
15.0
2.1
4.9
Masraf Al Rayan
35.05
(0.28)
11.98
26,288
15.7
2.6
2.9
Al Khaliji Bank
21.15
0.71
5.80
7,614
14.3
1.4
4.7
National Leasing
30.40
(0.33)
0.83
1,504
17.3
1.2
6.6
Dlala Holding
22.86
(0.04)
3.44
507
N/M
2.3
N/A
Qatar & Oman Investment
12.80
(0.54)
2.24
403
26.8
1.2
3.9
Islamic Holding Group
46.30
(1.49)
0.65
185
20.5
3.1
2.4
Qatar National Bank
240,174
Bank ing and Financial Se rvice s
Zad Holding
70.10
0.57
0.86
917
9.3
0.7
5.7
Qatar German Co. f or Medical Devices
14.05
(3.17)
1.44
162
N/M
0.9
N/A
Salam International Investment
13.15
(0.75)
1.08
1,503
11.6
0.9
5.3
Medicare Group
53.10
0.00
1.14
1,494
24.3
1.9
3.4
Qatar Cinema & Film Distribution
40.10
(6.09)
0.00
229
30.6
1.7
5.0
287.90
(0.69)
1.34
18,705
15.6
3.1
3.5
53.30
2.30
3.09
959
15.9
3.9
7.5
144.50
1.76
8.40
2,890
19.8
2.3
5.5
Qatar Fuel
Qatar Meat and Livestock
Al Meera Consumer Goods
26,860
Cons um e r Goods and Se rvice s
0.57
4.94
2,103
10.0
1.6
5.6
Qatar National Cement
119.00
53.10
(0.34)
0.00
5,843
13.7
2.4
5.0
Industries Qatar
181.40
0.89
7.40
109,747
13.5
3.4
4.3
48.45
1.68
10.87
6,024
25.8
2.9
1.5
183.00
0.00
0.60
18,300
12.1
3.2
4.0
Mannai Corp.
91.00
0.00
1.22
4,151
9.0
1.8
5.2
Aamal
14.72
(1.74)
(1.87)
8,832
14.0
1.3
N/A
Gulf International Services
73.80
3.36
10,972
18.1
3.8
2.0
Qatar Industrial Manuf acturing
Qatari Investors Group
Qatar Electricity and Water
20.98
165,972
Indus trials
Qatar Insurance
74.50
2.34
12.03
9,568
11.7
1.8
2.7
Doha Insurance
29.95
11.13
19.80
771
11.5
1.5
3.0
Qatar General Insurance & Reinsurance
44.50
(2.09)
(7.10)
2,565
3.0
0.8
2.0
Al Khaleej Takaf ul Insurance
39.50
0.51
8.22
674
14.1
1.1
2.1
Qatar Islamic Insurance
63.30
(1.86)
9.33
950
14.9
3.4
5.5
14,528
Ins urance
United Development
23.24
0.04
2.79
7,837
9.6
0.7
4.3
Barw a Real Estate
32.05
1.75
7.55
12,471
18.3
1.0
4.7
Ezdan Real Estate
16.95
(0.99)
(0.29)
44,960
N/M
1.6
0.8
Mazaya Qatar Real Estate Development
12.16
(2.56)
8.77
1,216
18.4
1.1
4.9
66,484
Re al Es tate
157.90
9.65
15.09
50,579
19.2
2.1
3.2
11.55
1.76
7.84
9,764
N/M
1.6
N/A
Qatar Navigation (Milaha)
90.80
0.33
9.40
10,399
10.7
0.9
4.1
Gulf Warehousing
41.00
(1.32)
(1.20)
1,950
19.2
2.4
N/A
Qatar Gas Transport (Nakilat)
Trans portation
21.04
0.19
3.90
11,782
15.4
3.3
4.8
Qatar Telecom
Vodaf one Qatar
60,343
Te le com s
24,131
Qatar Exchange
598,492
Source: Bloomberg
Contacts
Saugata Sarkar
Ahmed M. Shehada
Keith Whitney
Sahbi Kasraoui
Head of Research
Head of Trading
Head of Sales
Manager - HNWI
Tel: (+974) 4476 6534
Tel: (+974) 4476 6535
Tel: (+974) 4476 6533
Tel: (+974) 4476 6544
saugata.sarkar@qnbfs.com.qa
ahmed.shehada@qnbfs.com.qa
keith.whitney@qnbfs.com.qa
sahbi.alkasraoui@qnbfs.com.qa
QNB Financial Services SPC
Contact Center: (+974) 4476 6666
PO Box 24025, Doha, Qatar
DISCLAIMER: This publication has been prepared by QNB Financial Services SPC (“QNBFS”) a wholly-owned subsidiary of Qatar National Bank (“QNB”). QNBFS is regulated by the Qatar
Financial Markets Authority and the Qatar Exchange; QNB is regulated by the Qatar Central Bank. This publication expresses the views and opinions of QNBFS at a given time only. It is not an
offer, promotion or recommendation to buy or sell securities or other investments, nor is it intended to constitute legal, tax, accounting, or financial advice. We therefore strongly advise potential
investors to seek independent professional advice before making any investment decision. Although the information in this report has been obtained from sources that QNBFS believes to be
reliable, we have not independently verified such information and it may not be accurate or complete. While this publication has been prepared with the utmost degree of care by our analysts,
QNBFS does not make any representations warranties as to the accuracy and completeness of the information it may contain, and declines any liability in that respect. QNBFS reserves the right
to amend the views and opinions expressed in this publication at any time. It may also express viewpoints or make investment decisions that differ significantly from, or even contradict, the views
and opinions included in this report.
COPYRIGHT: No part of this document may be reproduced without the explicit written permission of QNBFS.
Page 5 of 5