call girls in Sant Nagar (DELHI) 🔝 >༒9953056974 🔝 genuine Escort Service 🔝✔️✔️
Weekly market report
1. Page 1 of 5
Market Review and Outlook QE Index and Volume
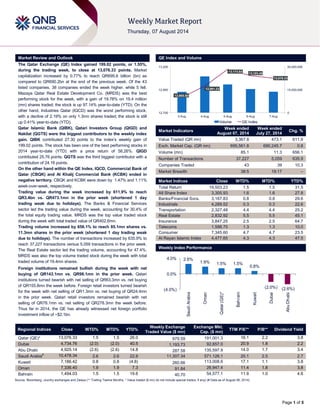
The Qatar Exchange (QE) Index gained 199.02 points, or 1.55%,
during the trading week, to close at 13,076.33 points. Market
capitalization increased by 0.77% to reach QR695.6 billion (bn) as
compared to QR690.2bn at the end of the previous week. Of the 43
listed companies, 38 companies ended the week higher, while 5 fell.
Mazaya Qatar Real Estate Development Co. (MRDS) was the best
performing stock for the week, with a gain of 19.78% on 19.4 million
(mn) shares traded; the stock is up 97.14% year-to-date (YTD). On the
other hand, Industries Qatar (IQCD) was the worst performing stock,
with a decline of 2.19% on only 1.3mn shares traded; the stock is still
up 0.41% year-to-date (YTD).
Qatar Islamic Bank (QIBK), Qatari Investors Group (QIGD) and
Nakilat (QGTS) were the biggest contributors to the weekly index
gain. QIBK contributed 27.30 points to the index’s weekly gain of
199.02 points. The stock has been one of the best performing stocks in
2014 year-to-date (YTD) with a price return of 58.26%. QIGD
contributed 25.76 points. QGTS was the third biggest contributor with a
contribution of 24.16 points.
On the other hand within the QE Index, IQCD, Commercial Bank of
Qatar (CBQK) and Al Khalij Commercial Bank (KCBK) ended in
negative territory. CBQK and KCBK were down by 1.47% and 1.11%
week-over-week, respectively.
Trading value during the week increased by 611.9% to reach
QR3.4bn vs. QR473.1mn in the prior week (shortened 1 day
trading weak due to holidays). The Banks & Financial Services
sector led the trading value during the week, accounting for 30.4% of
the total equity trading value. MRDS was the top value traded stock
during the week with total traded value of QR402.6mn.
Trading volume increased by 656.1% to reach 85.1mn shares vs.
11.3mn shares in the prior week (shortened 1 day trading weak
due to holidays). The number of transactions increased by 635.9% to
reach 37,227 transactions versus 5,059 transactions in the prior week.
The Real Estate sector led the trading volume, accounting for 47.4%.
MRDS was also the top volume traded stock during the week with total
traded volume of 19.4mn shares.
Foreign institutions remained bullish during the week with net
buying of QR143.1mn vs. QR98.1mn in the prior week. Qatari
institutions turned bearish with net selling of QR63.3mn vs. net buying
of QR155.8mn the week before. Foreign retail investors turned bearish
for the week with net selling of QR1.3mn vs. net buying of QR24.4mn
in the prior week. Qatari retail investors remained bearish with net
selling of QR78.1mn vs. net selling of QR278.3mn the week before.
Thus far in 2014, the QE has already witnessed net foreign portfolio
investment inflow of ~$2.1bn.
Market Indicators
Week ended
August 07, 2014
Week ended
July 27, 2014
Chg. %
Value Traded (QR mn) 3,367.8 473.1 611.9
Exch. Market Cap. (QR mn) 695,561.8 690,245.7 0.8
Volume (mn) 85.1 11.3 656.1
Number of Transactions 37,227 5,059 635.9
Companies Traded 43 39 10.3
Market Breadth 38:5 19:17 –
Market Indices Close WTD% MTD% YTD%
Total Return 19,503.23 1.5 1.5 31.5
All Share Index 3,305.93 1.6 1.6 27.8
Banks/Financial Svcs. 3,167.83 0.8 0.8 29.6
Industrials 4,289.52 0.3 0.3 22.6
Transportation 2,327.48 4.4 4.4 25.2
Real Estate 2,832.92 5.5 5.5 45.1
Insurance 3,847.25 2.5 2.5 64.7
Telecoms 1,598.70 1.3 1.3 10.0
Consumer 7,345.60 4.7 4.7 23.5
Al Rayan Islamic Index 4,477.65 4.3 4.3 47.5
Market Indices
Weekly Index Performance
Regional Indices Close WTD% MTD% YTD%
Weekly Exchange
Traded Value ($ mn)
Exchange Mkt.
Cap. ($ mn)
TTM P/E** P/B** Dividend Yield
Qatar (QE)* 13,076.33 1.5 1.5 26.0 979.59 191,001.3 16.1 2.2 3.8
Dubai 4,734.76 (2.0) (2.0) 40.5 1,193.73 92,657.0 20.9 1.8 2.2
Abu Dhabi 4,925.14 (2.6) (2.6) 14.8 287.58 135,597.9 14.0 1.7 3.4
Saudi Arabia#
10,478.34 2.6 2.6 22.8 11,307.34 571,126.1 20.1 2.5 2.7
Kuwait 7,186.42 0.8 0.8 (4.8) 260.66 113,008.6 17.1 1.1 3.8
Oman 7,336.40 1.9 1.9 7.3 91.84 26,947.4 11.4 1.8 3.8
Bahrain 1,494.03 1.5 1.5 19.6 40.70 54,577.1 11.9 1.0 4.6
Source: Bloomberg, country exchanges and Zawya (** Trailing Twelve Months; * Value traded ($ mn) do not include special trades, if any) (# Data as of August 06, 2014)
12,865.50
12,991.23
13,173.64
13,103.45
13,076.33
0
15,000,000
30,000,000
12,700
12,950
13,200
3-Aug 4-Aug 5-Aug 6-Aug 7-Aug
Volume QE Index
2.6%
1.9% 1.5% 1.5%
0.8%
(2.0%) (2.6%)(4.0%)
0.0%
4.0%
SaudiArabia
Oman
Qatar(QE)*
Bahrain
Kuwait
Dubai
AbuDhabi
2. Page 2 of 5
News
Economic News
QCB auctions T-bills worth QR4bn – The Qatar Central Bank
(QCB) has auctioned treasury bills worth QR4bn on August 5,
2014, for which it received bids totaling QR5.305bn. T-bills
worth QR2bn with a three-month maturity period were
auctioned at a yield of 0.73%. T-bills with a six-month maturity
period worth QR1bn were sold at a yield of 0.96%, while T-bills
with nine-month maturity period worth QR1bn were auctioned
at a yield of 1.10%. (QCB)
Qatar state spending up 13% in 2013/14, slowest in 11
years – According to the preliminary finance ministry data
released by the central bank, Qatar’s public spending increased
12.7% last fiscal year, the lowest rate in 11 years, as slow
growth in current expenditure offset a sharp rise in funds spent
on infrastructure. Expenditure rose to a record high of
QR231.7bn ($63.6bn) in the year that ended in March, from
QR205.6bn in 2012/13. Last year’s spending was 10% more
than initially planned. However, the margin by which actual
spending overshot the plan was the lowest in five years,
suggesting the government has begun to rein in excesses of
the previous four years. Project spending soared 32.7% to
QR68.4bn in 2013/14, as compared to just 1.9% growth in
2012/13. Current expenditure rose 6.0% to QR163.2bn in
2013/14, a sharp slowdown from a 24.4% jump in each of the
previous two years, because of a drop in interest payments and
spending on supplies and services. State revenue grew 21.9%
to a record QR346.6bn last fiscal year, slower than the 27.8%
rise in the previous year. Further, the 2013/14 budget surplus
surged to a record QR115.0bn (15.6% of GDP), from QR78.8bn
(11.4% of GDP) in the previous year. (Gulf-Times.com)
Market & Corporate News
Qatar stock market set to be flooded with more liquidity –
Qatar issued a law formally raising the limit of foreign
ownership in the listed companies to 49%. The move paves the
way for more liquidity flow into the country’s stock market that
has a capitalization of $192.21bn. The foreign ownership limit in
most listed companies was 25% earlier. Non-Qatari GCC
nationals, who were previously treated as foreigners for the
purpose of trading in Qatari stocks, are to be now treated as
Qatari citizens. This means their ownership of Qatari stocks will
not be counted in as being part of foreign ownership.
Meanwhile, QNA said the Emir HH Sheikh Tamim bin Hamad
Al Thani had issued Law No. 9 of 2014, which amends some
provisions of Law No. 13 of 2000 regulating investment of non-
Qatari capital in economic activity. The law says that listed
companies should seek approval from the Ministry of Economy
and Commerce to amend their Articles of Association to raise
the foreign ownership limit to 49%. QNA said the legislation
also provides for raising this percentage (49) for foreigners
further with approval from the State Cabinet. The law is to be
effective from the date of issue and is to be published in the
official gazette. (Peninsula Qatar)
Qatar set to award projects worth $26.2bn – Qatar will award
projects worth $26.2bn in 2014 as compared to $9.4bn in 2013.
According to latest figures released by construction intelligence
firm Ventures Onsite, the infrastructure project awards across
the GCC are forecasted to exceed $86bn in 2014, indicating an
increase of 77.8% over 2013. In the UAE, projects worth
$15.18bn will be awarded, almost five times more than what
was awarded in 2013, while in Oman infrastructure awards are
expected to reach $7.4bn. Bahrain, which awarded projects
worth $382mn in 2013, is expected to award $3.4bn. Kuwait is
expected to award projects worth $3.45bn. Saudi Arabia’s
forecasted award of $29.34bn — the highest in the region —
represents a YoY decrease. The infrastructure projects make
up 16% of the total construction value of GCC projects, and rail
projects like the Riyadh Metro are the main beneficiary.
According to Ventures, it is estimated that the rail sector is
worth $200bn as the six countries aim for an integrated GCC-
wide network by 2018. (Reuters)
MERS reports QR112.8mn net profit in 1H2014 – Al-Meera
Consumer Goods Company (MERS) reported a net profit of
QR112.8mn in 1H2014 as compared to QR57.6mn in 1H2013.
The Company’s EPS amounted to QR5.64 in 1H2014 versus
QR3.16 in 1H2013. (QE)
QNCD net profit drops QoQ and YoY – Qatar National
Cement Company (QNCD) posted a net profit of QR107.9mn in
2Q2014 vs. QR129.9mn in 1Q2014; dropping by 16.9% and
7.7% QoQ and YoY, respectively. EPS stood at QR4.84 as of
1H2014 vs. QR4.80 as of 2H2013. (QE)
ZHCD reports QR100.87mn net profit in 1H2014 – Zad
Holding Company (ZHCD) reported a net profit of QR100.87mn
in 1H2014 as compared to QR90.39mn in 1H2013. The
Company’s EPS amounted to QR4.68 in 1H2014 versus
QR4.20 in 1H2013. (QE)
ORDS launches Myanmar telecom network – Ooredoo
(ORDS) has launched its telecommunications services in
Myanmar. The company will take on two rivals who are also
rolling out networks in a country that has only 10% mobile
penetration. More than 90 companies and consortia submitted
expressions of interest after the government issued a tender for
the two licenses in 2013. ORDS’ voice & 3G internet services
will initially be available in Myanmar's three main cities of
Yangon, Mandalay and the capital, Naypyitaw. The network will
cover 25mn of Myanmar's approximately 60mn people by the
end of 2014 and 97% of the population within five years.
(Reuters)
ORDS’ Myanmar coverage to reach 68 cities by August 15
– Ooredoo’s (ORDS) coverage in Myanmar will rapidly extend
beyond the three main cities of Mandalay, Nay Pyi Taw and
Yangon to include some 68 cities and towns by August 15.
ORDS has announced the availability of its “crystal clear” voice
calls and fast internet services in three of Myanmar’s major
cities, Mandalay, Nay Pyi Taw and Yangon, as part of the final
preparations for the commercial launch later this month.
Initially, ORDS will provide free of charge in a kick-off
promotion. In another first, not only for Myanmar but globally,
Ooredoo is rolling out a next generation, purely UMTS900
network with some of the most advanced 3G technology in the
world. The benefits of this technology include a stronger signal,
crystal clear sound and fast Internet. (Gulf-Times.com)
CBQK appoints new executive general manager –
Commercial Bank of Qatar (CBQK) has appointed Mr. Colin
Macdonald as Executive General Manager, Business
Enablement. Mr. Colin will play a leading role in driving
business performance and strategic initiatives, supporting and
advising the CEO and the CBQK leadership team. Mr. Colin
has wide banking experience, including extensive experience in
the Middle East, built over 26 years. (Zawya)
3. Page 3 of 5
Qatar Exchange
Top 5 Gainers Top 5 Decliners
Source: Qatar Exchange (QE) Source: Qatar Exchange (QE)
Most Active Shares by Value (QR Million) Most Active Shares by Volume (Million)
Source: Qatar Exchange (QE) Source: Qatar Exchange (QE)
Investor Trading Percentage to Total Value Traded Net Traded Value by Nationality (QR Million)
Source: Qatar Exchange (QE) Source: Qatar Exchange (QE)
19.8%
14.2% 14.1%
10.2% 9.7%
0.0%
7.0%
14.0%
21.0%
Mazaya Qatar Islamic
Holding Group
Medicare
Group
Qatari
Investors
Group
Qatar Cinema
& Film
Distribution
-2.2%
-1.8%
-1.5%
-1.1%
-0.8%
-3.0%
-2.0%
-1.0%
0.0%
Industries Qatar Ezdan Real
Estate
Commercial
Bank of Qatar
Al Khaliji Mesaieed
Petrochemical
Holding
Company
402.6
294.6
224.2 214.8
164.6
0.0
150.0
300.0
450.0
Mazaya Qatar United
Development
Industries
Qatar
Masraf Al
Rayan
Qatar Islamic
Bank
19.4
10.1
7.3
6.3
5.1
0.0
7.0
14.0
21.0
Mazaya Qatar United
Development
Ezdan Real
Estate
Salam
International
Investment
Qatar & Oman
Investment
0%
20%
40%
60%
80%
100%
Buy Sell
45.07% 47.39%
17.23% 19.11%
13.98%
14.02%
23.73% 19.48%
Qatari Individuals Qatari Institutions
Non-Qatari Individuals Non-Qatari Institutions
2,098
1,270
2,240
1,128
(141)
142
(500) - 500 1,000 1,500 2,000 2,500
Qatari
Non-Qatari
Net Investment Total Sold Total Bought
4. Page 4 of 5
TECHNICAL ANALYSIS OF THE QE INDEX
Source: Bloomberg
The QE Index ended the volatile week on a bullish note. The index started the week on a bearish note, but witnessed a strong comeback registering gains
on Monday and Tuesday, which helped it to reclaim the 13,000.0 psychological level. However, the rally was short-lived as the index shed majority of its
gains on Wednesday and Thursday on the back of profit-booking. Meanwhile, the index faces its stiff resistance near the 13,200.0 level. Traders should
watch out for a move above this level as it may cover all the short positions and push the index higher toward the 13,350.0-13,400.0 levels. However, any
failure to move above 13,200.0 may result in a range-bound movement. On the downside, the index has immediate support near the 13,000.0 psychological
level. Any sustained weakness below this level may drag the index to test 12,900.0. Bulls should worry only if this level is taken off, as it may result in a sell-
off and pull the index down toward the 12,770.0-12,800.0 levels. As of now, both the momentum indicators are stalling, indicating lack of clarity in the
direction of the index. Thus, traders are advised to exercise caution and build their positions only when the index is able to breach the key mentioned levels.
DEFINITIONS OF KEY TERMS USED IN TECHNICAL ANALYSIS
RSI (Relative Strength Index) indicator – RSI is a momentum oscillator that measures the speed and change of price movements. The RSI oscillates
between 0 to 100. The index is deemed to be overbought once the RSI approaches the 70 level, indicating that a correction is likely. On the other hand, if
the RSI approaches 30, it is an indication that the index may be getting oversold and therefore likely to bounce back.
MACD (Moving Average Convergence Divergence) indicator – The indicator consists of the MACD line and a signal line. The divergence or the
convergence of the MACD line with the signal line indicates the strength in the momentum during the uptrend or downtrend, as the case may be. When the
MACD crosses the signal line from below and trades above it, it gives a positive indication. The reverse is the situation for a bearish trend.
Candlestick chart – A candlestick chart is a price chart that displays the high, low, open, and close for a security. The ‘body’ of the chart is portion between
the open and close price, while the high and low intraday movements form the ‘shadow’. The candlestick may represent any time frame. We use a one-day
candlestick chart (every candlestick represents one trading day) in our analysis.
Doji candlestick pattern – A Doji candlestick is formed when a security's open and close are practically equal. The pattern indicates indecisiveness, and
based on preceding price actions and future confirmation, may indicate a bullish or bearish trend reversal.
Shooting Star/Inverted Hammer candlestick patterns – These candlestick patterns have a small real body (open price and close price are near to each
other), and a long upper shadow (large intraday movement on the upside). The Shooting Star is a bearish reversal pattern that forms after a rally. The
Inverted Hammer looks exactly like a Shooting Star, but forms after a downtrend. Inverted Hammers represent a potential bullish trend reversal.
5. Contacts
Saugata Sarkar Abdullah Amin, CFA Shahan Keushgerian
Head of Research Senior Research Analyst Senior Research Analyst
Tel: (+974) 4476 6534 Tel: (+974) 4476 6569 Tel: (+974) 4476 6509
saugata.sarkar@qnbfs.com.qa abdullah.amin@qnbfs.com.qa shahan.keushgerian@qnbfs.com.qa
Sahbi Kasraoui Ahmed Al-Khoudary QNB Financial Services SPC
Manager – HNWI Head of Sales Trading – Institutional Contact Center: (+974) 4476 6666
Tel: (+974) 4476 6544 Tel: (+974) 4476 6548 PO Box 24025
sahbi.alkasraoui@qnbfs.com.qa ahmed.alkhoudary@qnbfs.com.qa Doha, Qatar
DISCLAIMER: This publication has been prepared by QNB Financial Services SPC (“QNBFS”) a wholly-owned subsidiary of Qatar National Bank (“QNB”). QNBFS is regulated by the Qatar
Financial Markets Authority and the Qatar Exchange; QNB is regulated by the Qatar Central Bank. This publication expresses the views and opinions of QNBFS at a given time only. It is not an
offer, promotion or recommendation to buy or sell securities or other investments, nor is it intended to constitute legal, tax, accounting, or financial advice. We therefore strongly advise potential
investors to seek independent professional advice before making any investment decision. Although the information in this report has been obtained from sources that QNBFS believes to be
reliable, we have not independently verified such information and it may not be accurate or complete. While this publication has been prepared with the utmost degree of care by our analysts,
QNBFS does not make any representations warranties as to the accuracy and completeness of the information it may contain, and declines any liability in that respect. QNBFS reserves the right
to amend the views and opinions expressed in this publication at any time. It may also express viewpoints or make investment decisions that differ significantly from, or even contradict, the views
and opinions included in this report.
COPYRIGHT: No part of this document may be reproduced without the explicit written permission of QNBFS.
Page 5 of 5
Source: Bloomberg
Com pany Nam e
Price
(August 07)
% Change
5-Day
% Change
YTD
Market Cap.
QR Million TTM P/E P/B Div. Yield
Qatar National Bank 181.40 0.22 5.47 126,931 12.9 2.4 3.9
Qatar Islamic Bank 109.20 3.31 58.26 25,803 18.2 2.2 3.7
Commercial Bank of Qatar 67.00 (1.47) 13.56 19,895 12.4 1.2 2.5
Doha Bank 57.00 1.24 (2.06) 14,727 10.3 1.3 7.9
Al Ahli Bank 52.80 1.34 24.80 8,722 15.6 2.2 N/A
Qatar International Islamic Bank 84.40 1.20 36.79 12,776 16.2 2.5 4.4
Masraf Al Rayan 53.80 1.13 71.88 40,350 22.6 3.9 2.8
Al Khaliji Bank 22.25 (1.11) 11.31 8,010 15.4 1.4 4.5
National Leasing 28.80 1.77 (4.48) 1,425 22.7 1.1 5.2
Dlala Holding 58.50 8.33 164.71 1,299 16.5 4.8 N/A
Qatar & Oman Investment 15.78 4.57 26.04 497 20.2 1.5 3.8
Islamic Holding Group 79.00 14.16 71.74 316 26.0 5.3 2.2
Banking and Financial Services 260,751
Zad Holding 87.00 6.88 25.18 1,138 10.6 0.8 4.0
Qatar German Co. for Medical Devices 14.10 3.30 1.81 163 N/M 0.9 N/A
Salam International Investment 20.10 6.86 54.50 2,298 16.0 1.4 5.0
Medicare Group 118.70 14.13 126.10 3,341 26.7 4.1 1.5
Qatar Cinema & Film Distribution 51.00 9.68 27.18 291 25.3 2.1 N/A
Qatar Fuel 219.80 2.09 0.58 18,564 15.6 3.0 3.5
Qatar Meat and Livestock 57.70 6.85 11.61 1,039 19.4 3.9 3.6
Al Meera Consumer Goods 192.00 5.67 44.04 3,840 14.9 3.0 4.2
Consum er Goods and Services 30,673
Qatar Industrial Manufacturing 46.20 0.43 9.57 2,195 10.9 1.5 N/A
Qatar National Cement 136.40 1.87 14.62 6,697 15.3 2.8 4.4
Industries Qatar 169.60 (2.19) 0.41 102,608 14.6 3.6 6.5
Qatari Investors Group 56.40 10.16 29.06 7,012 30.7 3.2 1.3
Qatar Electricity and Water 184.50 0.99 11.57 20,295 13.9 3.4 3.7
Mannai Corp. 114.30 3.91 27.14 5,214 10.3 2.9 4.8
Aamal 16.23 0.25 8.20 9,738 18.3 1.4 N/A
Gulf International Services 117.30 2.89 140.37 21,799 25.7 6.7 1.4
Mesaieed Petrochemical Holding 32.65 (0.76) N/A 41,019 N/A 3.0 1.1
Industrials 216,578
Qatar Insurance 92.00 2.22 72.93 14,770 15.1 2.8 2.2
Doha Insurance 29.50 9.26 18.00 1,475 10.2 1.5 6.8
Qatar General Insurance & Reinsurance 46.00 2.22 15.24 3,182 2.2 0.7 2.7
Al Khaleej Takaful Insurance 45.35 0.11 61.52 1,007 11.8 1.5 N/A
Qatar Islamic Insurance 84.30 0.36 45.60 1,265 15.1 4.9 4.4
Insurance 21,698
United Development 30.00 5.63 39.32 10,623 21.4 1.0 3.2
Barw a Real Estate 39.05 3.58 31.04 15,195 11.7 1.1 5.1
Ezdan Real Estate 19.90 (1.78) 17.06 52,785 40.9 1.8 1.6
Mazaya Qatar Real Estate Development 22.04 19.78 97.14 2,204 14.3 1.8 3.4
Real Estate 80,807
Qatar Telecom 128.80 0.63 (6.12) 41,257 16.5 1.6 3.1
Vodafone Qatar 19.78 3.56 84.69 16,722 N/M 2.9 0.9
Telecom s 57,979
Qatar Navigation (Milaha) 93.90 4.68 13.13 10,754 11.9 0.9 5.3
Gulf Warehousing 50.00 2.04 20.48 2,378 20.3 3.0 3.0
Qatar Gas Transport (Nakilat) 24.90 4.62 22.96 13,944 16.9 3.8 4.4
Transportation 27,076
Qatar Exchange 695,562