AnyConv.com__FSS Advance Retail & Distribution - 15.06.17.ppt
citigroupFinancial Supplement
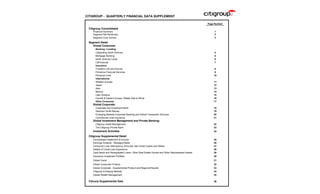
1. CITIGROUP - QUARTERLY FINANCIAL DATA SUPPLEMENT
Page Number
Citigroup Consolidated
Financial Summary 1
Segment Net Revenues 2
Segment Core Income 3
Segment Detail
Global Consumer:
Banking / Lending
Citibanking North America 4
Mortgage Banking 5
North America Cards 6
CitiFinancial 7
Insurance
Travelers Life and Annuity 8
Primerica Financial Services 9
Personal Lines 10
International
Western Europe 11
Japan 12
Asia 13
Mexico 14
Latin America 15
Central & Eastern Europe, Middle East & Africa 16
Other Consumer 17
Global Corporate:
Corporate and Investment Bank 18
Salomon Smith Barney 19
Emerging Markets Corporate Banking and Global Transaction Services 20
Commercial Lines Insurance 21
Global Investment Management and Private Banking:
Citigroup Asset Management 22
The Citigroup Private Bank 23
Investment Activities 24
Citigroup Supplemental Detail
Consolidated Statement of Income 25
Earnings Analysis - Managed Basis 26
Consumer Loan Delinquency Amounts, Net Credit Losses and Ratios 27
Details of Credit Loss Experience 28
Cash Basis and Renegotiated Loans, Other Real Estate Owned and Other Repossessed Assets 29
Insurance Investment Portfolio 30
Global Cards 31
Global Consumer Finance 32
Global Corporate - Supplemental Product and Regional Results 33
Citigroup Emerging Markets 34
Global Wealth Management 35
Citicorp Supplemental Data 36
2. CITIGROUP -- FINANCIAL SUMMARY
(In millions of dollars, except per share amounts)
Citigroup, the preeminent global financial services company with 190 million customer accounts in more than 100 countries, provides consumers, corporations, governments and institutions a complete range of financial products and services.
3Q 2001 vs. YTD YTD YTD 3Q 2001 vs.
1Q 2Q 3Q 4Q 1Q 2Q 3Q 3Q 2000 Increase/ 3Q 3Q YTD 3Q 2000 Increase/
2000 2000 2000 2000 2001 2001 2001 (Decrease) 2000 2001 (Decrease)
Core Income $3,939 $3,341### $3,529 $3,331 $3,660 $3,785 $3,262 (8%) $10,809 $10,707 (1%)
Restructuring and Merger-Related Items (83) (2) (45) (491) (80) (133) (85) (130) (298)
Cumulative Effect of Accounting Changes - ### - ### - ### - (42)
### (116)
### - ### - (158)
Net Income $3,856 $3,339 $3,484 $2,840 $3,538 $3,536 $3,177 (9%) $10,679 $10,251 (4%)
###
Basic Earnings Per Share:
Core Income $0.79 $0.67 $0.70 $0.66 $0.73 $0.75 $0.64 (9%) $2.15 $2.12 (1%)
Net Income $0.77 $0.67 $0.69 $0.57 $0.70 $0.70 $0.62 (10%) $2.13 $2.03 (5%)
Weighted average common shares
applicable to Basic EPS 4,975.5 4,977.1 4,978.7 4,976.5 4,984.7 4,979.6 5,060.8 4,977.1 5,008.4
Preferred Dividends - Basic $30 $29 $29 $28 $28 $28 $28 $88 $84
Diluted Earnings Per Share:
Core Income $0.76 $0.65 $0.68 $0.65 $0.71 $0.74 $0.63 (7%) $2.09 $2.07 (1%)
Net Income $0.75 $0.65 $0.67 $0.55 $0.69 $0.69 $0.61 (9%) $2.07 $1.98 (4%)
Core diluted earnings per share excluding
goodwill amortization $0.78 $0.67 $0.70 $0.67 $0.73 $0.76 $0.65 (7%) $2.15 $2.13 (1%)
Adjusted weighted average common shares
applicable to Diluted EPS 5,115.4 5,121.6 5,134.8 5,116.8 5,110.0 5,100.0 5,169.0 5,123.9 5,126.3
Preferred Dividends - Diluted $30 $29 $29 $28 $28 $28 $28 $88 $84
Common Shares Outstanding, at period end 5,028.4 5,027.2 5,026.2 5,022.2 5,033.7 5,026.1 5,144.2 5,026.2 5,144.2
Tier 1 Capital Ratio 9.00% 8.03% 7.76% 8.38% 8.56% 8.82% 8.1% * 7.76% 8.1% *
Total Capital Ratio 11.47% 10.34% 9.96% 11.23% 11.31% 11.49% 10.7% * 9.96% 10.7% *
Leverage Ratio 6.60% 5.99% 5.91% 5.97% 6.10% 6.17% 5.7% * 5.91% 5.7% *
Total Assets, at period end (in billions) $821.0 $877.2 $896.6 $902.2 $944.3 $953.4 $1,068 * $896.6 $1,068 *
Stockholders' Equity, at period end (in billions) $59.9 $61.4 $63.7 $66.2 $68.7 $70.5 $78.4 * $63.7 $78.4 *
Stockholders' Equity and Trust Securities, at period end (in billions) $64.8 $66.3 $68.6 $71.1 $73.6 $75.1 $85.5 * $68.6 $85.5 *
Book Value Per Share, at period end $11.57 $11.86 $12.33 $12.84 $13.29 $13.68 $14.90 * $12.33 $14.90 *
Return on Common Equity (Net Income) 26.7% 22.9% 22.7% 17.9% 21.7% 20.9% 17.1% * 24.1% 19.8% *
Return on Common Equity (Core Income) 27.3% 22.9% 22.9% 21.0% 22.5% 22.4% 17.5% * 24.4% 20.7% *
* Preliminary
Page 1
3. CITIGROUP -- SEGMENT NET REVENUES
(In millions of dollars)
3Q 2001 vs. YTD YTD YTD 3Q 2001 vs.
1Q 2Q 3Q 4Q 1Q 2Q 3Q 3Q 2000 Increase/ 3Q 3Q YTD 3Q 2000 Increase/
2000 2000 2000 2000 2001 2001 2001 (Decrease) 2000 2001 (Decrease)
Global Consumer:
Banking / Lending
Citibanking North America $579 $566 $566 $562 $612 $663 $714 26% $1,711 $1,989 16%
Mortgage Banking 223 226 225 238 242 268 260 16% 674 770 14%
North America Cards 2,551 2,557 2,737 2,911 3,004 3,099 3,352 22% 7,845 9,455 21%
CitiFinancial 1,222 1,269 1,262 1,318 1,339 1,390 1,436 14% 3,753 4,165 11%
Total Banking / Lending 4,575 4,618 4,790 5,029 5,197 5,420 5,762 20% 13,983 16,379 17%
Insurance
Travelers Life and Annuity 1,010 983 899 999 1,130 975 875 (3%) 2,892 2,980 3%
Primerica Financial Services 472 479 474 490 490 497 493 4% 1,425 1,480 4%
Personal Lines 1,034 1,050 1,058 1,088 1,080 1,106 1,132 7% 3,142 3,318 6%
Total Insurance 2,516 2,512 2,431 2,577 2,700 2,578 2,500 3% 7,459 7,778 4%
International
Western Europe 618
### 600
### 579
### 591 622
### 602
### 651
### 12% 1,797 1,875 4%
Japan 591
### 662
### 713
### 815 825
### 818
### 859
### 20% 1,966 2,502 27%
Asia 539
### 519
### 521
### 517 540
### 536
### 554
### 6% 1,579 1,630 3%
Mexico (1) 197 136 119 151 151 161 683 NM 452 995 NM
Latin America 420 417 401 418 409 406 396 (1%) 1,238 1,211 (2%)
Central & Eastern Europe, Middle East and Africa 100 106 112 120 130 135 140 25% 318 405 27%
Total Emerging Markets Consumer Banking 1,256 1,178 1,153 1,206 1,230 1,238 1,773 54% 3,587 4,241 18%
Total International 2,465 2,440 2,445 2,612 2,677 2,658 3,283 34% 7,350 8,618 17%
e-Consumer 31 28 76 35 47 35 54 (29%) 135 136 1%
Other 34 (18) 95 58 9 56 62 (35%) 111 127 14%
Total Global Consumer 9,621 9,580 9,837 10,311 10,630 10,747 11,661 19% 29,038 33,038 14%
Global Corporate:
Corporate Finance 3,381 3,123 3,249 3,077 4,130 3,180 2,887 (11%) 9,753 10,197 5%
Private Client 1,917 1,690 1,681 1,628 1,553 1,512 1,451 (14%) 5,288 4,516 (15%)
Corporate and Investment Bank 5,298 4,813 4,930 4,705 5,683 4,692 4,338 (12%) 15,041 14,713 (2%)
Emerging Markets Corporate Banking and Global Transaction Services 1,462 1,546 1,578 1,650 1,801 1,773 1,699 8% 4,586 5,273 15%
Commercial Lines 1,719 1,788 1,928 2,062 1,970 2,018 1,977 3% 5,435 5,965 10%
Total Global Corporate 8,479 8,147 8,436 8,417 9,454 8,483 8,014 (5%) 25,062 25,951 4%
Global Investment Management & Private Banking:
Citigroup Asset Management 423 461 471 490 505 477 523 11% 1,355 1,505 11%
The Citigroup Private Bank 363 339 337 370 390 375 365 8% 1,039 1,130 9%
Total Global Investment Management & Private Banking 786 800 808 860 895 852 888 10% 2,394 2,635 10%
Corporate / Other (89) (159) (169) (280) (165) (127) (105) 38% (417) (397) 5%
Investment Activities 1,042 426 496 345 233 360 (164) NM 1,964 429 (78%)
Total Adjusted Net Revenues $19,839 $18,794 $19,408 $19,653 $21,047 $20,315 $20,294 $58,041 $61,656
5% 6%
SUPPLEMENTAL INFORMATION:
Citigroup Emerging Markets - Excl. Investment Activities $2,814 $2,776 $2,767 $2,898 $3,105 $3,071 $3,580 29% $8,357 $9,756 17%
Global Wealth Management $4,386 $4,124 $4,041 $4,126 $4,228 $3,981 $3,922 (3%) $12,551 $12,131 (3%)
Global Cards $3,112 $3,156 $3,322 $3,515 $3,595 $3,690 $4,040 22% $9,590 $11,325 18%
Global Consumer Finance $1,842 $1,936 $1,965 $2,136 $2,197 $2,251 $2,350 20% $5,743 $6,798 18%
(1) Comprises both Consumer and Corporate operations in Mexico, including the results of Banamex (excluding Investment Activities) from August 2001 forward.
NM Not meaningful
Reclassified to conform to the current period's presentation.
Page 2
4. CITIGROUP -- SEGMENT CORE INCOME
(In millions of dollars)
3Q 2001 vs. YTD YTD YTD 3Q 2001 vs.
1Q 2Q 3Q 4Q 1Q 2Q 3Q 3Q 2000 Increase/ 3Q 3Q YTD 3Q 2000 Increase/
2000 2000 2000 2000 2001 2001 2001 (Decrease) 2000 2001 (Decrease)
Global Consumer:
Banking / Lending
Citibanking North America $122 $125 $121 $128 $145 $144 $151 25% $368 $440 20%
Mortgage Banking 66 71 77 83 77 88 92 19% 214 257 20%
North America Cards 380 388 492 527 467 455 573 16% 1,260 1,495 19%
CitiFinancial 179 205 213 213 212 286 308 45% 597 806 35%
Total Banking / Lending 747 789 903 951 901 973 1,124 24% 2,439 2,998 23%
Insurance
Travelers Life and Annuity 187 202 179 209 210 231 178 (1%) 568 619 9%
Primerica Financial Services 119 125 124 124 125 128 125 1% 368 378 3%
Personal Lines 74 82 68 83 87 39 29 (57%) 224 155 (31%)
Total Insurance 380 409 371 416 422 398 332 (11%) 1,160 1,152 (1%)
International
Western Europe 96
### 91
### 94
### 103 110
### 106
### 124
### 32% 281 340 21%
Japan 150
### 173
### 204
### 202 198
### 229
### 244
### 20% 527 671 27%
Asia 141
### 139
### 139
### 131 147
### 145
### 160
### 15% 419 452 8%
Mexico (1) 43 6 (3) 10 4 11 124 NM 46 139 NM
Latin America 56 61 57 76 58 67 63 11% 174 188 8%
Central & Eastern Europe, Middle East and Africa 15 15 12 8 18 21 24 100% 42 63 50%
Total Emerging Markets Consumer Banking 255 221 205 225 227 244 371 81% 681 842 24%
Total International 501 485 503 530 535 579 739 47% 1,489 1,853 24%
e-Consumer (59) (37) (31) (33) (24) (22) (14) 55% (127) (60) 53%
Other (39) (34) (7) 36 4 (8) 15 NM (80) 11 NM
Total Global Consumer 1,530 1,612 1,739 1,900 1,838 1,920 2,196 26% 4,881 5,954 22%
Global Corporate:
Corporate Finance 921 649 637 391 824 719 688 8% 2,207 2,231 1%
Private Client 359 254 251 208 195 203 179 (29%) 864 577 (33%)
Corporate and Investment Bank 1,280 903 888 599 1,019 922 867 (2%) 3,071 2,808 (9%)
Emerging Markets Corporate Banking and Global Transaction Services 302 322 372 407 425 440 428 15% 996 1,293 30%
Commercial Lines 247 272 317 257 278 286 (136) NM 836 428 (49%)
Total Global Corporate 1,829 1,497 1,577 1,263 1,722 1,648 1,159 (27%) 4,903 4,529 (8%)
Global Investment Management & Private Banking:
Citigroup Asset Management 93 87 93 72 89 80 93 - 273 262 (4%)
The Citigroup Private Bank 80 79 79 85 97 93 93 18% 238 283 19%
Total Global Investment Management & Private Banking 173 166 172 157 186 173 186 8% 511 545 7%
Corporate / Other (243) (189) (243) (183) (217) (196) (159) 35% (675) (572) 15%
Investment Activities 650 255 284 194 131 240 (120) NM 1,189 251 (79%)
Total Core Income $3,939 $3,341 $3,529 $3,331 $3,660 $3,785 $3,262 $10,809 $10,707
(8%) (1%)
SUPPLEMENTAL INFORMATION:
Citigroup Emerging Markets - Excl. Investment Activities $682 $600 $633 $707 $759 $770 $887 40% $1,915 $2,416 26%
Global Wealth Management $881 $772 $757 $715 $735 $748 $687 (9%) $2,410 $2,170 (10%)
Global Cards $475 $512 $604 $645 $593 $570 $736 22% $1,591 $1,899 19%
Global Consumer Finance $305 $356 $383 $392 $389 $493 $536 40% $1,044 $1,418 36%
(1) Comprises both Consumer and Corporate operations in Mexico, including the results of Banamex (excluding Investment Activities) from August 2001 forward.
NM Not meaningful
Reclassified to conform to the current period's presentation.
Page 3
5. GLOBAL CONSUMER - Banking/Lending
CITIBANKING NORTH AMERICA (1)
(In millions of dollars)
3Q 2001 vs. YTD YTD YTD 3Q 2001 vs.
1Q 2Q 3Q 4Q 1Q 2Q 3Q 3Q 2000 Increase/ 3Q 3Q YTD 3Q 2000 Increase/
2000 2000 2000 2000 2001 2001 2001 (Decrease) 2000 2001 (Decrease)
Total Revenues, Net of Interest Expense $579 $566 $566
### $562 $612 $663 $714 26% $1,711 $1,989 16%
Adjusted Operating Expenses 366 349 356 352 365 415 439 23% 1,071 1,219 14%
Provision for Loan Losses 9 7 7 6 7 13 28 NM 23 48 NM
Core Income Before Taxes 204 210 203 204 240 235 247 22% 617 722 17%
Income Taxes 82 85 82 76 95 91 96 17% 249 282 13%
Core Income $122 $125 $121 $128 $145 $144 $151 25% $368 $440 20%
Average Assets (in billions of dollars) $9 $9 $9 $9 $9 $9 $17 89% $9 $12 33%
Return on Assets 5.45% 5.59% 5.35% 5.66% 6.53% 6.42% 3.52% 5.46% 4.90%
Average Loans (in billions of dollars) $7.0 $7.0 $6.9 $7.0 $7.0 $7.0 $11.6 68% $7.0 $8.5 21%
Average Customer Deposits (in billions of dollars) $43.7 $44.5 $45.0 $46.1 47.9 $48.1 $56.0 24% 44.4 50.7 14%
EOP Accounts (in millions) 6.3 6.4 6.5 6.7 6.7 6.8 7.8 20%
Non-Interest Revenue as % of Total Revenues 27.4% 26.9% 26.9% 25.2% 22.7% 29.9% 21.4% 27.0% 24.6%
Net Credit Loss Ratio (1) 1.00% 0.88% 0.86% 0.90% 0.85% 1.03% 1.12%
Loans 90+Days Past Due:
In millions of dollars $47 $33 $33 $35 $41 $41 $69 NM
% 0.67% 0.47% 0.46% 0.48% 0.59% 0.58% 0.55%
Proprietary Mutual Funds / UIT $373 $124 $280 $280 $331 $255 $251 (10%) $777 $837 8%
Proprietary Money Market Funds 1,015 679 748 690 958 722 1,027 37% 2,442 2,707 11%
Total Proprietary Funds 1,388 803 1,028 970 1,289 977 1,278 24% 3,219 3,544 10%
Third Party Funds 947 599 426 346 420 294 392 (8%) 1,972 1,106 (44%)
Mutual Fund / UIT Sales at NAV (in millions of dollars) $2,335 $1,402 $1,454 $1,316 $1,709 $1,271 $1,670 15% $5,191 $4,650 (10%)
Variable Annuity Premiums & Deposits (in millions of dollars) $270 $330 $385 $381 $304 $302 $316 (18%) $985 $922 (6%)
Branches 371 367 367 367 368 368 446 22%
ATM-only locations 109 105 107 91 103 107 112 5%
Proprietary ATMs 2,092 2,081 2,079 2,063 2,048 2,043 2,174 5%
(1) Includes the results of The European American Bank from July 2001 forward.
(2) The 4Q00 net credit loss ratio includes a 10 basis point increase related to the adoption of revised FFIEC write-off policies.
NM Not meaningful
Reclassified to conform to the current period's presentation.
Page 4
6. GLOBAL CONSUMER - Banking/Lending
MORTGAGE BANKING (1)
(In millions of dollars)
3Q 2001 vs. YTD YTD YTD 3Q 2001 vs.
1Q 2Q 3Q 4Q 1Q 2Q 3Q 3Q 2000 Increase/ 3Q 3Q YTD 3Q 2000 Increase/
2000 2000 2000 2000 2001 2001 2001 (Decrease) 2000 2001 (Decrease)
Total Revenues, Net of Interest Expense $223 $226 $225 $238 $242 $268
### $260 16% $674 $770 14%
Adjusted Operating Expenses 99 102 92 102 109 116 104 13% 293 329 12%
Provision for Loan Losses 9 (1) 1 (7) - (3) (4) NM 9 (7) NM
Core Income Before Taxes and Minority Interest 115 125 132 143 133 155 160 21% 372 448 20%
Income Taxes 44 48 49 55 51 60 62 27% 141 173 23%
Minority Interest, Net of Tax 5 6 6 5 5 7 6 - 17 18 6%
Core Income $66 $71 $77 $83 $77 $88 $92 19% $214 $257 20%
Average Assets (in billions of dollars) $34 $37 $42 $45 $47 $48 $47 12% $38 $47 24%
Return on Assets 0.78% 0.77% 0.73% 0.73% 0.66% 0.74% 0.78% 0.75% 0.73%
EOP Accounts Owned and Serviced (in millions):
Student Loans 2.8 3.0 3.3 3.5 3.5 3.5 3.7 12%
Mortgages 0.7 0.9 0.9 0.9 0.9 0.9 0.9 -
Consumer Finance 0.1 0.1 0.1 0.1 0.1 0.1 0.1 -
Total 3.6 4.0 4.3 4.5 4.5 4.5 4.7 9%
Owned and Serviced Average Loans (in billion of dollars):
Mortgages (2) $20.1 $21.6 $23.8 $25.9 $26.8 $27.3 $25.8 8% $21.8 $26.6 22%
Student Loans 11.6 12.3 14.2 15.3 16.8 17.2 17.6 24% 12.7 17.2 35%
Consumer Finance 0.4 0.5 0.7 0.9 1.0 1.2 1.4 100% 0.5 1.2 NM
Average Loans - On Balance Sheet 32.1 34.4 38.7 42.1 44.6 45.7 44.8 16% 35.0 45.0 29%
Other Serviced Loans 54.1 59.9 61.8 62.6 64.2 66.0 69.6 13% 58.6 66.6 14%
Total $86.2 $94.3 $100.5 $104.7 $108.8 $111.7 $114.4 14% $93.6 $111.6 19%
Mortgage Originations (in billions of dollars) $3.7 $5.1 $5.7 $5.5 $5.9 $8.8 $8.1 42% $14.5 $22.8 57%
Student Loan Originations $1.0 $0.7 $1.5 $1.2 $1.5 $0.5 $1.2 (20%) $3.2 $3.2 -
Consumer Finance Originations $0.2 $0.3 $0.3 $0.3 $0.3 $0.4 $0.5 67% $0.8 $1.2 50%
Net Credit Loss Ratio (3) 0.19% 0.08% 0.09% 0.27% 0.06% 0.08% 0.10%
Loans 90+ Days Past Due:
In millions of dollars $733 $722 $723 $846 $957 $1,191 $1,204 67%
% 2.28% 2.10% 1.88% 2.01% 2.14% 2.61% 2.74%
(1) Includes Student Loans.
(2) Includes loans held for sale.
(3) The 4Q00 net credit loss ratio includes a 16 basis point increase related to the adoption of revised FFIEC write-off policies.
NM Not meaningful
Reclassified to conform to the current period's presentation.
Page 5
7. GLOBAL CONSUMER - Banking/Lending
NORTH AMERICA CARDS (1)
(In millions of dollars)
3Q 2001 vs. YTD YTD YTD 3Q 2001 vs.
1Q 2Q 3Q 4Q 1Q 2Q 3Q 3Q 2000 Increase/ 3Q 3Q YTD 3Q 2000 Increase/
2000 2000 2000 2000 2001 2001 2001 (Decrease) 2000 2001 (Decrease)
Adjusted Revenues, Net of Interest Expense $2,551 $2,557 $2,737 $2,911 $3,004 $3,099 $3,352 22% $7,845 $9,455 21%
Adjusted Operating Expenses 957 975 1,005 1,017 1,041 1,003 1,004 - 2,937 3,048 4%
Adjusted Provision for Loan Losses 990 961 957 1,065 1,221 1,371 1,434 50% 2,908 4,026 38%
Core Income Before Taxes 604 621 775 829 742 725 914 18% 2,000 2,381 19%
Income Taxes 224 233 283 302 275 270 341 20% 740 886 20%
Core Income $380 $388 $492 $527 $467 $455 $573 16% $1,260 $1,495 19%
Managed Average Assets (in billions of dollars) $90 $94 $101 $106 $106 $106 $109 8% $95 $107 13%
Return on Managed Assets 1.70% 1.66% 1.94% 1.98% 1.79% 1.72% 2.09% 1.77% 1.87%
CITI CARDS DATA (2):
(in billions of dollars)
Net Interest Revenue (in millions of dollars) (3) $1,956 $1,899 $2,055 $2,198 $2,374 $2,411 $2,685 31% $5,910 $7,470 26%
% of Average Managed Loans 9.29% 8.66% 8.62% 8.83% 9.61% 9.61% 10.34% 8.85% 9.86%
Risk Adjusted Revenue (in millions of dollars) (4) $1,471 $1,516 $1,701 $1,768 $1,709 $1,627 $1,850 9% $4,688 $5,186 11%
% of Average Managed Loans 6.99% 6.91% 7.14% 7.10% 6.92% 6.49% 7.13% 7.02% 6.85%
Adjusted Operating Expenses as % of Average Managed Loans 4.19% 4.14% 3.93% 3.79% 3.93% 3.73% 3.61%
End of Period Managed Receivables $86.1 $92.3 $97.7 $103.2 $100.5 $103.9 $105.6 8%
Total EOP Open Accounts (in millions) 78.5 83.9 89.4 90.8 93.2 94.1 93.4 4%
Total Sales $48.4 $55.3 $55.2 $56.8 $51.2 $55.6 $55.0 - $158.9 $161.8 2%
End of Period Loans:
On Balance Sheet $27.9 $33.5 $37.9 $37.0 $32.6 $32.6 $33.0 (13%)
Securitized 54.5 51.6 53.3 57.2 60.1 61.4 65.2 22%
Held for Sale 3.4 6.5 5.8 8.1 7.0 9.0 6.5 12%
Total $85.8 $91.6 $97.0 $102.3 $99.7 $103.0 $104.7 8%
Average Loans:
On Balance Sheet $26.9 $32.1 $36.9 $36.9 $34.7 $33.5 $33.5 (9%) 32.0 33.9 6%
Securitized 54.7 51.7 51.1 55.4 58.5 59.7 61.3 20% 52.5 59.8 14%
Held for Sale 3.1 4.4 6.8 6.7 7.0 7.4 8.2 21% 4.8 7.5 56%
Total $84.7 $88.2 $94.8 $99.0 $100.2 $100.6 $103.0 9% $89.3 $101.2 13%
Net Credit Losses (in millions of dollars):
On Balance Sheet $340 $374 $377 $420 $465 $481 $541 44% $1,091 $1,487 36%
Securitized 619 534 509 570 668 812 790 55% 1,662 2,270 37%
Held for Sale 21 40 56 61 63 90 92 64% 117 245 NM
Total $980 $948 $942 $1,051 $1,196 $1,383 $1,423 51% $2,870 $4,002 39%
Coincident Net Credit Loss Ratio 4.65% 4.32% 3.95% 4.22% 4.84% 5.51% 5.48%
12 Month Lagged Net Credit Loss Ratio 5.11% 4.81% 4.67% 5.16% 5.72% 6.29% 5.96%
Loans 90+ Days Past Due:
In millions of dollars $1,281 $1,156 $1,295 $1,497 $1,836 $1,775 $1,908 47%
% 1.49% 1.26% 1.34% 1.46% 1.84% 1.72% 1.82%
(1) Includes Citi Cards (bankcards and private-label cards) and Diners Club. (4) Risk Adjusted Revenue is adjusted revenues less net credit losses.
(2) Excludes Diners Club NM Not meaningful
(3) Includes delinquency and other risk-based charges.
Reclassified to conform to the current period's presentation.
Page 6
8. GLOBAL CONSUMER - Banking/Lending
CITIFINANCIAL
(In millions of dollars)
3Q 2001 vs. YTD YTD YTD 3Q 2001 vs.
1Q 2Q 3Q 4Q 1Q 2Q 3Q 3Q 2000 Increase/ 3Q 3Q YTD 3Q 2000 Increase/
2000 2000 2000 2000 2001 2001 2001 (Decrease) 2000 2001 (Decrease)
Adjusted Revenues, Net of Interest Expense* $1,222 $1,269 $1,262 $1,318 $1,339 $1,390 $1,436 14% $3,753 $4,165 11%
Adjusted Operating Expenses 536 571 568 581 569 502 492 (13%) 1,675 1,563 (7%)
Adjusted Provision for Benefits, Claims, and Credit Losses 404 373 362 407 428 434 451 25% 1,139 1,313 15%
Core Income Before Taxes 282 325 332 330 342 454 493 48% 939 1,289 37%
Income Taxes 103 120 119 117 130 168 185 55% 342 483 41%
Core Income $179 $205 $213 $213 $212 $286 $308 45% $597 $806 35%
Average Assets (in billions of dollars) $51 $55 $58 $61 $63 $65 $66 14% $55 $65 18%
Return on Assets 1.41% 1.50% 1.46% 1.39% 1.36% 1.76% 1.85% 1.45% 1.66%
Net receivables (in billions of dollars):
Real estate secured loans (1) $33.7 $35.5 $36.7 $38.1 $40.3 $40.6 $41.4 13%
Personal loans (2) 9.8 9.7 9.7 9.9 9.8 9.8 9.6 (1%)
Auto 3.0 3.8 4.2 4.6 5.2 5.8 6.3 50%
Sales finance and other 2.8 2.6 2.6 2.7 2.4 2.3 2.4 (8%)
Total $49.3 $51.6 $53.2 $55.3 $57.7 $58.5 $59.7 12%
Number of offices 2,767 2,738 2,699 2,720 2,430 2,336 2,320 (14%)
Average yield (3) 14.26% 14.16% 14.11% 14.03% 13.93% 13.69% 13.38% 14.17% 13.66%
Average net interest margin (3) 8.21% 7.84% 7.61% 7.55% 7.70% 7.85% 7.95% 7.88% 7.83%
Net credit loss ratio (3) 2.92% 2.49% 2.33% 2.57% 2.57% 2.55% 2.53%
Loans 90+ Days Past Due:
In millions of dollars $1,044 $1,033 $1,084 $1,272 $1,599 $1,757 $1,909 76%
% 2.11% 1.98% 2.00% 2.23% 2.77% 3.00% 3.20%
(1) Includes fully secured $.M.A.R.T. receivables,
as follows: $4.1 $4.4 $4.7 $5.2 $5.6 $6.4 $7.1 51%
(2) Includes $.A.F.E. and partially secured $.M.A.R.T.
receivables, as follows: $0.3 $0.3 $0.3 $0.3 $0.3 $0.3 $0.3 -
(3) Includes loans held for sale
* Excludes realized gains / (losses) on investments.
Page 7
9. GLOBAL CONSUMER - Insurance
TRAVELERS LIFE AND ANNUITY
(In millions of dollars)
3Q 2001 vs. YTD YTD YTD 3Q 2001 vs.
1Q 2Q 3Q 4Q 1Q 2Q 3Q 3Q 2000 Increase/ 3Q 3Q YTD 3Q 2000 Increase/
2000 2000 2000 2000 2001 2001 2001 (Decrease) 2000 2001 (Decrease)
Total Revenues, Net of Interest Expense* $1,010 $983 $899 $999 $1,130 $975 $875 (3%) $2,892 $2,980 3%
Total Operating Expenses 126 97 103 83 88 87 69 (33%) 326 244 (25%)
Provision for Benefits and Claims 603 586 531 605 729 546 549 3% 1,720 1,824 6%
Core Income Before Taxes 281 300 265 311 313 342 257 (3%) 846 912 8%
Income Taxes 94 98 86 102 103 111 79 (8%) 278 293 5%
Core Income $187 $202 $179 $209 $210 $231 $178 (1%) $568 $619 9%
Pre-tax contribution by source:
Individual annuities $108 $118 $117 $122 $122 $125 $100 (15%) $343 $347 1%
Group annuities 92 114 91 123 117 134 98 8% 297 349 18%
Life and long-term care insurance 60 55 40 46 63 74 50 25% 155 187 21%
Other (includes run-off and return on excess capital) 21 13 17 20 11 9 9 (47%) 51 29 (43%)
Total $281 $300 $265 $311 $313 $342 $257 (3%) $846 $912 8%
Individual annuities:
Net written premiums & deposits:
Fixed $293.5 $302.6 $320.3 $350.0 $427.2 $571.5 $464.6 45% $916.4 $1,463.3 60%
Variable 1,245.0 1,258.5 1,273.6 1,247.7 1,098.7 1,068.3 951.7 (25%) 3,777.1 3,118.7 (17%)
Individual Payout 20.5 21.7 20.6 17.0 18.7 14.7 14.1 (32%) 62.8 47.5 (24%)
Total $1,559.0 $1,582.8 $1,614.5 $1,614.7 $1,544.6 $1,654.5 $1,430.4 (11%) $4,756.3 $4,629.5 (3%)
Policyholder account balances & benefit reserves: (1)
Fixed $7,911.3 $7,904.0 $7,939.8 $8,050.0 $8,271.7 $8,609.3 $8,907.4 12%
Variable 21,072.7 21,013.2 21,678.1 20,704.0 18,948.3 20,438.0 17,952.1 (17%)
Individual Payout 619.6 626.2 630.0 630.3 631.9 631.7 630.3 -
Total $29,603.6 $29,543.4 $30,247.9 $29,384.3 $27,851.9 $29,679.0 $27,489.8 (9%)
Group annuities:
Net written premiums & deposits (2) $1,456.9 $1,439.1 $1,481.8 $1,149.9 $2,501.6 $1,397.4 $1,717.4 16% $4,377.8 $5,616.4 28%
Policyholder account balances & benefit reserves: (1)
GIC's and other investment contracts $11,087.0 $11,204.2 $11,966.9 $12,598.6 $13,732.0 $14,091.0 $14,795.0 24%
Payout Group annuities 4,514.9 4,624.0 4,713.8 4,861.5 5,140.5 5,259.0 5,359.5 14%
Total $15,601.9 $15,828.2 $16,680.7 $17,460.1 $18,872.5 $19,350.0 $20,154.5 21%
Individual life insurance:
Net written premiums and deposits:
Direct periodic premiums and deposits $116.7 $113.4 $135.8 $144.7 $187.0 $142.1 $126.7 (7%) $365.9 $455.8 25%
Single premium deposits 18.3 21.0 22.3 37.6 47.2 48.4 36.4 63% 61.6 132.0 NM
Reinsurance (19.1) (20.3) (21.4) (23.0) (22.6) (24.1) (24.8) (16%) (60.8) (71.5) (18%)
Total $115.9 $114.1 $136.7 $159.3 $211.6 $166.4 $138.3 1% $366.7 $516.3 41%
Policyholder account balances & benefit reserves $2,755.3 $2,801.9 $2,911.0 $2,983.3 $3,085.1 $3,193.1 $3,174.8 9%
Life insurance in force (in billions, face amt.) $61.7 $63.2 $65.2 $66.9 $69.4 $71.0 $72.5 11%
Life insurance issued (in billions, face amt.) $2.7 $3.0 $3.1 $2.9 $3.8 $2.9 $3.0 (3%) $8.8 $9.7 10%
All businesses:
Net investment income (pretax) $594.9 $639.1 $609.1 $655.9 $654.9 $673.5 $608.0 - $1,843.1 $1,936.4 5%
Interest credited to contractholders $244.7 $248.7 $266.7 $290.4 $291.3 $305.8 $302.6 13% $760.1 $899.7 18%
Statutory data:
Travelers Insurance Company
Statutory capital and surplus $5,011.2 $4,977.4 $5,355.1 $5,160.4 $5,024.5 $5,047.8 $4,972.6 (7%)
Surplus to liabilities ratio 20.5% 20.3% 21.3% 20.2% 18.8% 18.9% 17.5%
(1) Includes general account, separate accounts and managed funds.
(2) Excludes deposits of $28.0, $12.0 and $594.0 for the first, second and third quarters of 2001 and $24.0, $45.0 and $251.0 in the first, second, and fourth quarters of 2000,
related to Travelers plans previously managed externally.
NM Not meaningful
* Excludes realized gains / (losses) on investments.
Page 8
10. GLOBAL CONSUMER - Insurance
PRIMERICA FINANCIAL SERVICES
(In millions of dollars)
3Q 2001 vs. YTD YTD YTD 3Q 2001 vs.
1Q 2Q 3Q 4Q 1Q 2Q 3Q 3Q 2000 Increase/ 3Q 3Q YTD 3Q 2000 Increase/
2000 2000 2000 2000 2001 2001 2001 (Decrease) 2000 2001 (Decrease)
Total Revenues, Net of Interest Expense* $472 $479 $474 $490 $490 $497 $493 4% $1,425 $1,480 4%
Total Operating Expenses 162 159 177 161 169 172 171 (3%) 498 512 3%
Provision for Benefits and Claims 125 126 106 139 128 127 129 22% 357 384 8%
Core Income Before Taxes 185 194 191 190 193 198 193 1% 570 584 2%
Income Taxes 66 69 67 66 68 70 68 1% 202 206 2%
Core Income $119 $125 $124 $124 $125 $128 $125 1% $368 $378 3%
Life Insurance
Face value (in billions) of:
Life insurance issued $15.0 $18.5 $16.8 $17.1 $16.3 $18.6 $17.6 5% $50.3 $52.5 4%
Life insurance in force $397.8 $403.6 $408.4 $412.7 $415.4 $422.9 $427.7 5%
Annualized issued premiums $44.1 $54.1 $49.5 $50.0 $47.4 $53.7 $50.9 3% $147.7 $152.0 3%
Direct premiums $324.5 $330.9 $333.3 $337.6 $340.4 $346.9 $348.1 4% $988.7 $1,035.4 5%
Earned premiums $270.6 $277.4 $275.0 $282.6 $284.0 $285.2 $287.1 4% $823.0 $856.3 4%
Other Products
Mutual fund sales at NAV:
Proprietary $465.0 $468.7 $448.5 $428.9 $479.9 $509.1 $496.7 11% $1,382.2 $1,485.7 7%
Other funds 497.1 552.5 397.8 368.5 330.1 259.1 195.4 (51%) 1,447.4 784.6 (46%)
Total U.S. mutual fund sales 962.1 1,021.2 846.3 797.4 810.0 768.2 692.1 (18%) 2,829.6 2,270.3 (20%)
Mutual fund sales - Canada 228.8 128.1 117.4 119.0 183.8 100.1 84.4 (28%) 474.3 368.3 (22%)
Total mutual fund sales $1,190.9 $1,149.3 $963.7 $916.4 $993.8 $868.3 $776.5 (19%) $3,303.9 $2,638.6 (20%)
Cash advanced on $.M.A.R.T. and $.A.F.E. loans (1) $492.0 $475.6 $457.2 $667.5 $694.5 $1,091.9 $1,006.1 NM $1,424.8 $2,792.5 96%
Variable annuity net written premiums and deposits $249.9 $248.0 $270.6 $288.2 $247.6 $237.1 $222.1 (18%) $768.5 $706.8 (8%)
Agents licensed for:
Life insurance 79,818 82,288 85,183 86,900 88,907 93,998 93,156 9%
Mutual funds 25,570 25,968 27,300 27,961 27,671 28,766 29,653 9%
$.M.A.R.T. / $.A.F.E. loans 93,055 99,481 105,640 116,491 125,450 133,200 143,738 36%
Variable annuities 16,453 16,692 17,281 17,777 18,665 19,642 20,179 17%
Long term care 8,010 7,785 9,612 10,134 10,869 11,319 12,010 25%
Home & auto insurance 13,238 13,038 12,194 11,647 11,275 12,834 12,473 2%
Financial Needs Analyses submitted 110,900 109,451 108,838 108,705 114,991 122,009 119,093 9% 329,189 356,093 8%
(1) The $.M.A.R.T. and $.A.F.E. loan products are marketed by PFS; the receivables are reflected in the assets of CitiFinancial.
NM Not meaningful
* Excludes realized gains / (losses) on investments.
Page 9
11. GLOBAL CONSUMER - Insurance
PERSONAL LINES
(In millions of dollars)
3Q 2001 vs. YTD YTD YTD 3Q 2001 vs.
1Q 2Q 3Q 4Q 1Q 2Q 3Q 3Q 2000 Increase/ 3Q 3Q YTD 3Q 2000 Increase/
2000 2000 2000 2000 2001 2001 2001 (Decrease) 2000 2001 (Decrease)
Total Revenues, Net of Interest Expense* $1,034 $1,050 $1,058 $1,088 $1,080 $1,106 $1,132 7% $3,142 $3,318 6%
Adjusted Operating Expenses 250 256 246 250 267 261 276 12% 752 804 7%
Claims and Claim Adjustment Expenses 659 673 717 718 688 793 820 14% 2,049 2,301 12%
Core Income Before Taxes and Minority Interest 125 121 95 120 125 52 36 (62%) 341 213 (38%)
Income Taxes 38 36 27 37 38 13 7 (74%) 101 58 (43%)
Minority Interest, Net of Tax 13 3 - - - - - - 16 - (100%)
Core Income (1) $74 $82 $68 $83 $87 $39 $29 (57%) $224 $155 (31%)
Net written premiums by product line (2):
Auto $588.7 $614.7 $608.7 $596.1 $639.1 $669.0 $682.2 12% $1,812.1 $1,990.3 10%
Homeowners and other 307.9 378.6 397.1 372.5 322.7 404.5 414.6 4% 1,083.6 1,141.8 5%
Total net written premiums (a) $896.6 $993.3 $1,005.8 $968.6 $961.8 $1,073.5 $1,096.8 9% $2,895.7 $3,132.1 8%
Net written premiums by distribution channel:
Independent agents $691.9 $769.8 $779.2 $750.1 $749.1 $837.6 $861.3 11% $2,240.9 $2,448.0 9%
Alternative distribution 147.3 165.1 176.2 172.2 165.7 178.8 182.2 3% 488.6 526.7 8%
Other 57.4 58.4 50.4 46.3 47.0 57.1 53.3 6% 166.2 157.4 (5%)
Total net written premiums (a) $896.6 $993.3 $1,005.8 $968.6 $961.8 $1,073.5 $1,096.8 9% $2,895.7 $3,132.1 8%
Statutory ratio development (2):
$917.2 $927.7 $937.8 $972.5 $957.9 $994.9 $1,021.5 9% $2,782.7 $2,974.3 7%
Earned premiums (b)
Losses and loss adjustment expenses (c) 661.5 674.0 719.3 721.0 688.5 793.1 819.7 14% 2,054.8 2,301.3 12%
Other underwriting expenses (d) 242.1 254.3 260.3 245.3 254.6 264.9 280.8 8% 756.7 800.3 6%
Total deductions 903.6 928.3 979.6 966.3 943.1 1,058.0 1,100.5 12% 2,811.5 3,101.6 10%
Statutory underwriting gain/(loss) $13.6 $(0.6) $(41.8) $6.2 $14.8 $(63.1) $(79.0) (89%) $(28.8) $(127.3) NM
Statutory combined ratio (2):
72.1% 72.7% 76.7% 74.1% 71.9% 79.7% 80.2% 73.8% 77.4%
Loss and loss adjustment expense ratio (c / b)
Other underwriting expense ratio (d / a) 27.0% 25.6% 25.9% 25.3% 26.5% 24.7% 25.6% 26.1% 25.6%
Combined ratio 99.1% 98.3% 102.6% 99.4% 98.4% 104.4% 105.8% 99.9% 103.0%
Net investment income (pre-tax) $113.1 $115.2 $113.0 $107.7 $114.1 $102.7 $101.4 (10%) $341.3 $318.2 (7%)
Effective tax rate on net investment income 29.3% 29.5% 29.4% 29.2% 29.2% 28.1% 28.8% 29.4% 28.5%
Catastrophe losses, net of reinsurance (after-tax) $30.4 $17.2 $1.9 $4.1 $- $42.3 $41.6 NM $49.5 $83.9 69%
(1) During April 2000, Travelers Insurance Group Inc. completed a cash tender offer to purchase all the outstanding shares of Class A Common Stock of Travelers Property Casualty Corp. at a
price of $41.95 per share. Results for the periods prior to April 20, 2000 are net of minority interest.
(2) The 2001 third quarter and YTD third quarter results include the effects of the events of September 11, 2001, which resulted in a decrease of $4.0 million to premiums, an increase of $60.0 million to losses and loss adjustment
expenses and a decrease of $64.0 million to statutory underwriting loss. Excluding the effects of these events, the loss and loss adjustment expense ratio, other underwriting expense ratio, and combined ratio for
the 2001 third quarter were 74.1%, 25.5%, and 99.6%, respectively, and for the YTD 2001 third quarter were 75.3%, 25.5%, and 100.8%, respectively.
* Excludes realized gains / (losses) on investments.
NM - Not meaningful
Page 10