(ANIKA) Budhwar Peth Call Girls Just Call 7001035870 [ Cash on Delivery ] Pun...
.credit-suisse Annual Report Part 3 Financial report 1999 / 2000 continued
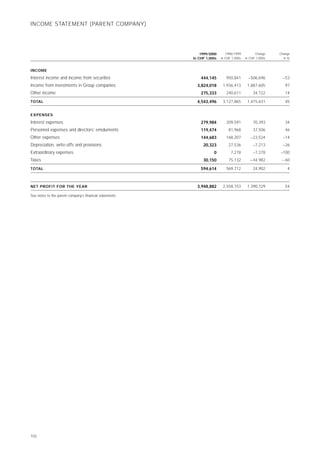
1. INCOME STATEMENT (PARENT COMPANY)
1999/2000 1998/1999 Change Change
in CHF 1,000s in CHF 1,000s in CHF 1,000s in %
INCOME
Interest income and income from securities 444,145 950,841 – 506,696 – 53
Income from investments in Group companies 3,824,018 1,936,413 1,887,605 97
Other income 275,333 240,611 34,722 14
4,543,496 3,127,865 1,415,631 45
TOTAL
EXPENSES
Interest expenses 279,984 209,591 70,393 34
Personnel expenses and directors’ emoluments 119,474 81,968 37,506 46
Other expenses 144,683 168,207 –23,524 –14
Depreciation, write-offs and provisions 20,323 27,536 –7,213 –26
Extraordinary expenses 0 7,278 –7,278 –100
Taxes 30,150 75,132 – 44,982 – 60
594,614 569,712 24,902 4
TOTAL
3,948,882 2,558,153 1,390,729 54
NET PROFIT FOR THE YEAR
See notes to the parent company’s financial statements.
102
2. BALANCE SHEET BEFORE ALLOCATION OF RETAINED EARNINGS (PARENT COMPANY)
31 March 2000 31 March 1999 Change Change
Notes in CHF 1,000s in CHF 1,000s in CHF 1,000s in %
ASSETS
Investments in Group companies 21,705,760 19,602,439 2,103,321 11
7
Long-term loans to Group companies 1,309,309 1,209,020 100,289 8
Securities 1,861,835 1,334,911 526,924 39
Total long-term assets 24,876,904 22,146,370 2,730,534 12
Liquid assets held at third parties 1 250,001 –250,000 –100
Liquid assets held at Group companies 1,078,865 2,054,114 – 975,249 – 47
Securities 3,645,017 1,797,428 1,847,589 103
Other receivables from third parties 1,319,333 636,678 682,655 107
Accrued income and prepaid expenses 408,434 359,567 48,867 14
Total current assets 6,451,650 5,097,788 1,353,862 27
31,328,554 27,244,158 4,084,396 15
TOTAL
SHAREHOLDERS’ EQUITY AND LIABILITIES
Share capital 5,476,853 5,406,030 70,823 1
11
Legal reserve 11,676,078 11,047,637 628,441 6
13
Reserve for own shares 600,000 600,000 0 0
10
Retained earnings:
– retained earnings, initial balance 1,966,225 768,579 1,197,646 156
– net profit for the year 3,948,882 2,558,153 1,390,729 54
Total shareholders’ equity 23,668,038 20,380,399 3,287,639 16
Bonds 3,550,000 3,649,500 – 99,500 –3
6
Long-term loans from Group companies 2,521,077 1,557,438 963,639 62
Provisions 467,951 437,761 30,190 7
14
Total long-term liabilities 6,539,028 5,644,699 894,329 16
Payable to third parties 3,203 4,324 –1,121 –26
Payable to Group companies 404,330 587,797 –183,467 – 31
Accrued expenses and deferred income 713,955 626,939 87,016 14
Total current liabilities 1,121,488 1,219,060 – 97,572 –8
Total liabilities 7,660,516 6,863,759 796,757 12
31,328,554
TOTAL 27,244,158 4,084,396 15
See notes to the parent company’s financial statements.
103
3. NOTES TO THE FINANCIAL STATEMENTS (PARENT COMPANY)
31 March 2000 31 March 1999
in CHF 1,000s in CHF 1,000s
1 CONTINGENT LIABILITIES
Aggregate guarantees and indemnity liabilities 19,903,280 17,735,611
– of which have been entered into on behalf of subsidiaries 19,733,079 17,565,248
The company belongs to the Swiss value-added tax (VAT) group of Credit Suisse Group, and thus
carries joint liability to the Swiss federal tax authority for value-added tax debts of the entire Group.
2 BALANCE SHEET ASSETS WITH RETENTION OF TITLE
TO SECURE OWN OBLIGATIONS
There are no such assets.
3 OFF-BALANCE-SHEET OBLIGATIONS RELATING TO LEASING CONTRACTS
There are no such obligations.
8,200 9,160
4 FIRE INSURANCE VALUE OF TANGIBLE FIXED ASSETS
5 LIABILITIES RELATING TO PENSION PLANS
AND OTHER RETIREMENT BENEFIT OBLIGATIONS
There are no such liabilities.
6 BONDS ISSUED
31 March 2000 31 March 1999
TYPE Interest rate Maturity date in CHF m in CHF m
Bonds 7.00% 1990 –23.02.2000 – 200
Warrant bonds (ex warrant) 2.25% 1993 – 06.08.2001 500 500
Bonds (subordinated) 6.00% 1994 –15.12.2003 250 250
Convertible bonds from Winterthur Insurance Company (subordinated) 2.25% 1997–28.02.2000 – 400
Bonds 4.00% 1997– 31.10.2006 800 800
Bonds 4.00% 1997–23.05.2007 1,000 1,000
Bonds 3.50% 1998 –15.09.2008 500 500
Bonds 3.50% 1999 – 02.07.2009 500 –
104
4. 7 PRINCIPAL PARTICIPATIONS
The company’s principal participations are shown in the notes to the consolidated financial statements.
8 RELEASE OF UNDISCLOSED RESERVES
No significant undisclosed reserves were released.
9 REVALUATION OF LONG-TERM ASSETS TO HIGHER THAN COST
There was no such revaluation.
10 OWN SHARES HELD BY THE COMPANY 1999/2000 1998/1999
AND BY GROUP COMPANIES No. of shares in CHF 1,000s No. of shares in CHF 1,000s
SHARES IN FINANCIAL INVESTMENTS
In registered share equivalents, including derivatives
At beginning of financial year 13,645 3,766 144,985 9,385
Additions (purchase price) 111,151 19,771 4,815 1,600
Disposals (selling price) 32,572 8,972 136,155 6,058
At end of financial year 92,224 30,389 13,645 3,766
HOLDINGS INCLUDED IN CURRENT ASSETS
In registered share equivalents, including derivatives
At beginning of financial year 221,512 61,137 337,331 102,886
At end of financial year 1,356,857 449,119 221,512 61,137
105
5. NOTES TO THE FINANCIAL STATEMENTS (PARENT COMPANY)
11 SHARE CAPITAL, CONDITIONAL AND AUTHORISED CAPITAL No. of Par value
OF CREDIT SUISSE GROUP registered shares in CHF
270,301,488 5,406,029,760
SHARE CAPITAL AT 31 MARCH 1999
Par value
CONDITIONAL CAPITAL No. of shares in CHF
Warrants and convertible bonds
AGM of 4 June 1992 12,500,000 250,000,000
Bonds converted 19 Nov. 1992 – 31 March 1999 –7,151,100 –143,022,000
Bonds converted 1 Apr. 1999 – 31 March 2000 –111,150 –2,223,000 111,150 2,223,000
Warrants exercised 6 Aug. 1993 –25 Sept. 1996 – 4,998,845 – 99,976,900
Warrants not exercised (lapsed 26 Sept. 1996) –1,155 –23,100
Remaining capital 237,750 4,755,000
Warrants and convertible bonds
AGM of 29 May 1995 12,500,000 250,000,000
Remaining capital 12,500,000 250,000,000
Staff shares
AGM of 29 May 1998 5,800,000 116,000,000
Subscriptions exercised 29 May 1998 – 31 March 1999 –1,326,008 –26,520,160
AGM of 28 May 1999 (increase) 1,526,008 30,520,160
AGM of 28 May 1999 6,000,000 120,000,000
Subscriptions exercised 1 Apr. 1999 – 31 March 2000 0 0 0 0
Remaining capital 1 6,000,000 120,000,000
AUTHORISED CAPITAL
Acquisitions of companies/participations
AGM of 29 May 1998 7,500,000 150,000,000
Acquisition Garantia Banking Limited 31 July 1998 –1,938,708 – 38,774,160
Acquisition Credit Suisse Financial Products 15 April 1999 –1,800,000 – 36,000,000 1,800,000 36,000,000
AGM of 28 May 1999 (increase) 9,238,708 184,774,160
AGM of 28 May 1999 13,000,000 260,000,000
Exercise of convertible bonds from Winterthur 2 March 2000 –1,630,000 – 32,600,000 1,630,000 32,600,000
Remaining capital 11,370,000 227,400,000
273,842,638 5,476,852,760
SHARE CAPITAL AT 31 MARCH 2000
1 of which 1,043,000 shares (par value CHF 20,860,000) reserved for rights issued to the management and staff
106
6. REPORT OF THE AUDITORS ON THE CAPITAL INCREASE TO THE BOARD OF DIRECTORS OF CREDIT SUISSE GROUP ON
CONDITIONAL AND AUTHORISED CAPITAL INCREASES
As auditors responsible for the capital increase of Credit Suisse Group, we have examined the issuance of shares for the period from
1 April 1999 to 31 March 2000 in accordance with the resolutions passed by the Annual General Meeting of Shareholders of
4 June 1992, 29 May 1998 and 28 May 1999 respectively, in accordance with Swiss law and the Company’s Articles of Association.
Furthermore, we have examined the capital increase reports dated 15 April 1999 and 2 March 2000 respectively, in accordance
with Swiss law.
It is the responsibility of the Board of Directors to execute the issuance of new shares in accordance with the Company’s Articles of
Association. Our responsibility is to examine whether the issuance of new shares was done in accordance with Swiss law, the Company’s
Articles of Association and the offering circular. The Board of Directors takes responsibility for the capital increase reports. Our respon-
sibility is to examine the information provided therein. We confirm that we meet the legal requirements concerning professional qualification
and independence.
Our examination was conducted in accordance with the auditing standards promulgated by the Swiss profession, which require that
our examination be planned and performed to obtain reasonable assurance about whether the issuance of new shares is free from
material mistakes, and whether material errors in the capital increase reports would be detected with reasonable assurance. We have
performed the audit procedures required in the circumstances and are of the opinion that they form a reasonable basis for our opinion.
We are of the opinion that the issuance of 111,150 registered shares, with a nominal value of CHF 20 each and a total nominal
value of CHF 2,223,000, is in agreement with Swiss law, the Company’s Articles of Association and the offering document dated
18 November 1992. Furthermore, in our opinion, the information set out in the capital increase reports is complete and appropriate and
corresponds to the resolutions passed by the Annual General Meeting of Shareholders held on 29 May 1998 and 28 May 1999 respec-
tively, and the resolutions of the Board of Directors dated 15 April 1999 and 2 March 2000 respectively.
KPMG Klynveld Peat Marwick Goerdeler SA Zurich, 15 April 1999, 2 March 2000 and 28 April 2000
12 SUBSTANTIAL SHAREHOLDERS AND THEIR HOLDINGS AT 31 MARCH 2000
BZ Group Holding has notified Credit Suisse Group that it held, as of 31 March 2000, on a consolidated basis 24,662,561 registered
shares, corresponding to 9.01% of the total outstanding registered shares, of which 6.64% were recorded in the share register with the
right to vote.
13 LEGAL RESERVES
The change in legal reserves compared to 31 March 1999 equals the capital surplus of CHF 636.3 m (1998/1999: CHF 976.0 m)
received for newly issued shares, net of issuing costs of CHF 7.9 m (1998/1999: CHF 3.4 m).
14 PROVISIONS
This item represents mainly general provisions of CHF 301 m (at 31 March 1999: CHF 301 m).
107
7. PROPOSED ALLOCATION OF RETAINED EARNINGS
in CHF
Retained earnings, beginning of year 1,966,225,059
Net profit for 1999/2000 3,948,881,857
5,915,106,916
RETAINED EARNINGS AT 31 MARCH 2000
DIVIDEND
CHF 7.00 per registered share of CHF 20 par value 1,916,898,466
(273,842,638 eligible for dividend)
To be brought forward 3,998,208,450
5,915,106,916
TOTAL
On behalf of the Board of Directors:
The Chairman: Rainer E. Gut
The Executive Board:
L. Mühlemann, H.-U. Doerig, P. K. Ryan, O. J. Grübel, T. Wellauer, R. Dörig, A. D. Wheat, R. E. Thornburgh, P. M. Colebatch
Zurich, 28 April 2000
108
8. REPORT OF THE STATUTORY AUDITORS TO THE ANNUAL GENERAL MEETING
OF CREDIT SUISSE GROUP, ZURICH
As statutory auditors, we have audited the accounting records and the financial statements (profit and loss account, balance sheet and
notes) of Credit Suisse Group for the year ended 31 March 2000.
These financial statements are the responsibility of the Board of Directors. Our responsibility is to express an opinion on these
financial statements based on our audit. We confirm that we meet the legal requirements concerning professional qualification and
independence.
Our audit was conducted in accordance with auditing standards promulgated by the Swiss profession, which require that an audit be
planned and performed to obtain reasonable assurance about whether the financial statements are free from material misstatement. We
have examined on a test basis evidence supporting the amounts and disclosures in the financial statements. We have also assessed the
accounting principles used, significant estimates made and the overall financial statement presentation. We believe that our audit provides a
reasonable basis for our opinion.
In our opinion, the accounting records, financial statements and the proposed appropriation of retained earnings comply with Swiss
law and the Company’s Articles of Association. We recommend that the financial statements submitted to you be approved.
KPMG Klynveld Peat Marwick Goerdeler SA
Brendan R. Nelson Peter Hanimann
Chartered Accountant Certified Accountant
Auditors in Charge
Zurich, 28 April 2000
109
9. TEN-YEAR SUMMARY OF SELECTED FINANCIAL DATA
1999
31 Dec.
CONSOLIDATED BALANCE SHEET in CHF m
Cash and other liquid assets,
due from banks, money market claims 197,036
– of which securities lending and reverse repos 128,585
Claims from insurance business 6,457
Due from customers 104,931
– of which securities lending and reverse repos 28,068
Mortgages 86,553
– of which mortgages from banking business 77,763
Securities and precious metals trading
portfolios, financial investments 145,574
Investments from insurance business 117,222
Non-consolidated participations 1,823
Tangible and intangible fixed assets 9,818
Accrued income and prepaid expenses, other assets 53,332
722,746
TOTAL ASSETS
Due to banks 198,324
– of which securities borrowing and repos 67,420
Commitments from insurance business 6,268
Money market liabilities, due to customers
as savings and investments, and other
dues to customers 248,376
– of which securities borrowing and repos 34,350
Medium-term notes, bonds and mortgage-backed bonds 51,790
Technical provisions 107,561
Accrued expenses and deferred income,
other liabilities, valuation adjustments and provisions 76,059
Reserves for general banking risks 2,131
Share capital 5,444
Capital reserve, retained earnings and net profit 26,793
Shareholders’ equity (before profit allocation) 34,368
– of which minority interests 1,747
Shareholders’ equity after minority interests 32,621
722,746
TOTAL LIABILITIES AND SHAREHOLDERS’ EQUITY
All figures are adjusted for the merger with Winterthur Group.
110
11. TEN-YEAR SUMMARY OF SELECTED FINANCIAL DATA
1999
CONSOLIDATED INCOME STATEMENT in CHF m
Net interest income 5,252
Net commission and service fee income 10,870
Net trading income 6,578
Net income from insurance business 5,060
Other ordinary income 110
NET OPERATING INCOME 27,870
Personnel expenses, banking business 11,754
Personnel expenses, insurance business 1,755
Other operating expenses, banking business 4,026
Other operating expenses, insurance business 1,203
Total operating expenses 18,738
GROSS OPERATING PROFIT 9,132
Depreciation, valuation adjustments and losses 2,585
– of which depreciation on fixed assets 1,045
GROUP PROFIT BEFORE EXTRAORDINARY ITEMS AND TAXES 6,547
Extraordinary income 93
Extraordinary expenses 152
Taxes, banking business 809
Taxes, insurance business 340
GROUP PROFIT/GROUP LOSS 5,339
Minority interests, banking business 28
Minority interests, insurance business 90
NET PROFIT/NET LOSS 5,221
CASHFLOW 7,983
RETURN ON EQUITY (ROE) IN % 1999
ROE 17.4
ROE (after minority interests) 18.2
112
13. TEN-YEAR SUMMARY OF SELECTED FINANCIAL DATA
KEY FIGURES INSURANCE BUSINESS
1999
NON-LIFE BUSINESS in CHF m
Net premiums 12,678
Profit (before taxes/minority interests) 962
NON-LIFE BUSINESS, KEY RATIOS 1999
Combined ratio, % 107.8
Claims ratio, % 75.5
Expense ratio, % 29.7
Dividends to policyholders incurred, % 2.6
Technical provision ratio, % 190.4
1999
LIFE BUSINESS in CHF m
Net premiums 14,171
Profit (before taxes/minority interests) 567
LIFE BUSINESS, KEY RATIOS 1999
Expenses ratio, % 10.9
Claims incurred and change in actuarial provision, % 112.2
Allocation to participation, % 13.1
RESOURCES
STAFF (FULLY CONSOLIDATED ENTITIES ONLY) 1999
At year-end: banking business, Switzerland 20,885
insurance business, Switzerland 6,569
banking business, abroad 17,249
insurance business, abroad 19,260
total 63,963
Average 62,772
NUMBER OF BANKING OFFICES 1999
Switzerland 1
301
Abroad 2
103
Total 404
1 Switzerland: CS 239, CSPB 51, CSFB 4, CSAM 7
2 abroad: CS 0, CSPB 36, CSFB 51, CSAM 16
114
14. 1998 1997 1996 1995 1994 1993 1992 1991 1990
in CHF m in CHF m in CHF m in CHF m in CHF m in CHF m in CHF m in CHF m in CHF m
12,257 13,694 13,414 11,449 10,641 9,227 8,715 8,366 7,265
900 761 618 580 483 374 266 342 331
1998 1997 1996 1992 1991 1990
1995 1994 1993
109.2 108.4 107.7 108.9 106.5 107.1
107.7 108.0 109.6
75.6 76.4 74.9 75.2 72.8 72.5
76.1 75.7 76.9
30.8 29.8 29.8 32.8 32.8 33.6
29.5 30.1 31.3
2.8 2.2 3.0 0.9 0.9 1.0
2.1 2.2 1.4
181.9 182.3 176.6 146.7 146.8 146.1
172.0 161.4 157.3
1998 1997 1996 1992 1991 1990
1995 1994 1993
in CHF m in CHF m in CHF m in CHF m in CHF m in CHF m
in CHF m in CHF m in CHF m
14,674 12,072 11,279 6,053 5,323
9,775 8,827 6,217 4,246
430 366 375 125 67
240 249 166 38
1998 1997 1996 1992 1991
1995 1994 1993 1990
9.3 10.4 10.5 11.2 13.8
11.2 11.7 10.8 15.4
110.6 112.5 108.0 103.9 108.8
105.8 102.7 107.0 100.0
13.1 13.5 13.6 13.3 13.5
13.8 14.7 14.5 11.4
1998 1997 1996 1992 1991
1995 1994 1993 1990
20,625 21,442 23,553 17,695 17,884
24,330 24,035 23,062 18,391
6,827 7,108 6,554 6,751 6,824
6,511 6,449 6,555 6,625
15,753 13,235 11,268 9,778 8,999
9,980 10,950 10,353 8,894
18,375 20,457 19,163 12,083 12,078
19,061 16,628 13,131 11,564
61,580 62,242 60,538 46,307 45,785
59,882 58,062 53,101 45,474
61,911 61,390 60,098 45,974 45,599
58,862 55,698 51,857 45,129
1998 1997 1996 1992 1991
1995 1994 1993 1990
301 304 369 234 240
402 427 384 239
116 118 101 93 94
98 90 97 87
417 422 470 327 334
500 517 481 326
115
15. TEN-YEAR SUMMARY OF SELECTED FINANCIAL DATA
CREDIT SUISSE GROUP SHARE INFORMATION 1
NO. OF SHARES, CHF 20 PAR VALUE 1999
Number of shares issued at 31 December 272,206,488
Shares ranking for dividend
– at 31 December 272,206,488
– average 271,310,760
PER SHARE RANKING FOR DIVIDEND IN CHF 1999
Book value (at year-end) 119.8
Cashflow (average) 29.4
Gross operating profit (average) 33.7
Net profit/loss (average) 19.2
Net profit (fully diluted) 19.1
Dividend 7.0
STOCK EXCHANGE PRICE IN CHF 1999
Year-end 316.5
High 316.5
Low 212.0
Price/earnings ratio (31 December) 16.5
Price/book value ratio (31 December) 2.6
MARKET CAPITALISATION 1999
Year-end, in CHF m 86,153
Change in % 49
As a % of SMI (at year-end) 9.9
TRADING VOLUME ON SWISS EXCHANGE (SWX) 1999
In CHF m
– total per year 88,107
– daily average 346.9
In 1,000 units
– total per year 325,497
– daily average 1,281.5
1 figures for 1996 and before do not include Winterthur Group
116