

Recommandé
Contenu connexe
En vedette
En vedette (20)
Similaire à S6 w2 chi square
Similaire à S6 w2 chi square (20)
Plus de Rachel Chung
Plus de Rachel Chung (20)
Dernier
Dernier (20)
S6 w2 chi square
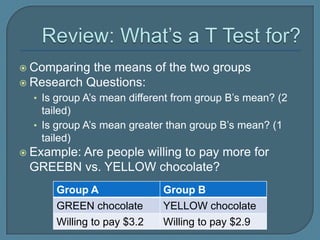
- 1. Comparing the means of the two groups Research Questions: • Is group A’s mean different from group B’s mean? (2 tailed) • Is group A’s mean greater than group B’s mean? (1 tailed) Example: Are people willing to pay more for GREEBN vs. YELLOW chocolate? Group A Group B GREEN chocolate YELLOW chocolate Willing to pay $3.2 Willing to pay $2.9
- 2. T test is an inferential statistic We will discuss two more: chi square and regression What are inferential statistics?
- 3. Research Question Inferential Statistics Compare means of 2 numeric variables T test Relate 2 numeric variables Pearson Correlation r Relate 2 categorical variables Pearson Chi Square Use 1+ IVs to explain 1 numeric DV Regression
- 5. Understand Pearson Chi Square • Definition/Purpose • Mathematical concepts • Assumptions • Reporting chi square results Understand regression • Definition/Purpose • Mathematical concepts • Assumptions • Assessing model fit • Reading SPSS outputs • Reporting regression results
- 6. Purpose – See if there’s a relationship between 2 categorical variables Example of categorical variables: Giant Eagle store – Market District? (yes/no) Has child play area (yes/no) Gender (male/female) Commit fraud (yes/no) Example Research Questions: • Are Giant Eagle’s Market District stores more likely than other GE stores to have a child play area? • Are men more likely than women to commit fraud?
- 7. EXPECTED VALUES FOR DATA YOU HAVE NULL HYPOTHESIS: NO COLLECTED DIFFERENCE BETWEEN MEN/WOMEN Fraud No Fraud Fraud No Fraud Men (20) 2 (20%) 10 Men 19 (95%) 1 Women (30) 3 (20%) 15 Women 9 (30%) 21 Question: Do your data differ significantly from what’s expected for “no difference between men/women?”
- 9. Count is the actual data/observations Expected Count is the theoretical expected values (table on left on last slide) 20.576 is the chi 1 is the degree of The test is significant square value freedom (p < .001)
- 10. There was a significant association between gender and fraud commitment X2(1, N=50)=20.576, p <.001. Based on the contingency table, men appear to have a greater likelihood of committing fraud than women.
- 11. Independence – Each case contributes to only one of the cells in the contingency table Each cell should be expected to have a value of at least 5 Each variable is normally distributed
- 12. What’s the purpose of Chi Square? What kind of research question is it designed to answer?
Notes de l'éditeur
- T test is for comparing 2 means, not for measuring anything. Usually we want to compare the dependent, not the independent variables.For example, if we do an experiment - We give one group of customers our new chocolate product in GREEN, and another group of customers our new product in YELLOW. We want to see how much they would be willing to spend on the chocolate.In this case, the COLOR of the product is the IV, and the $ amount the customer is willing to pay is the DV. We have 2 DV measures - the dollar amount for the GREEN group, and the dollar amount for the YELLOW group.The T test can be used to find out if the GREEN group and the YELLOW group differ significantly from each other in terms of how much $$ they are willing to pay.
- All of the inferential statistics are designed to help test your null hypotheses. It's like you suspect your child has a fever (but you're not sure - it's a hypothesis.) You take out the thermometer and measure the child's temperature. The thermometer reading tells you if your hypothesis (your hunch) is correct or not.Chi square, t or F tests are like the thermometer reading. They tell you if your hypothesis is correct.
- We will discuss two more inferential statistics today – chi square and regressionHow do you know which test is appropriate for your project?Use this summary table to determine
- Again choosing the right statistics really depends on what kind of variable you have – categorical or numeric??Chi square is for you to see if two categorical variables relate to each otherSee Individual Assignment 6 for more examples
- Basically, chi-square allows you to test a null hypothesis that 2 categorical variables are NOT related to each otherIn this example, we’d like to test the null hypothesis that men do NOT commit more fraud than women by examining these tables called “contingency tables” or “crosstabs”Let’s say we are going to examine the fraud records of 20 men and 30 women. Before we look at the actual records, we would specify our expectations in terms of the null hypothesis.[Question – what 2 variables are we examining?]If the null hypothesis is true, we would expect the same proportion of men and women to commit fraud (in the slide it’s 20% for both genders). Those numbers in the contingency table on the left are the “expected values”Then we will go out and actually inspect the 50 records.Turns out that 19 out of 20 men committed fraud, whereas only 9 out of 30 women committed fraud. Is this distribution significantly different from what we expect from the null hypothesis?Let’s look at the chi square results on the next slide
- A casual inspection of the data would probably make you think, yesBTW, this is the bar chart generated by SPSS in the “crosstab” function – You will create this in your assignmentBut how do we know that the difference is statistically significant?
- This slide illustrates how to read the SPSS output
- This example shows you how to write up the chi square test outcome in the results section of your research paper
- Caution – running statistics is deceivingly simply due to the elegant design of the SPSS softwareBut remember, SPSS is just a robot. It executes your commands obediently without questioning. However, these statistical tests are designed based on a lot of complex assumptions about your sample. If you have a bad sample, remember the GIGO principle always applies - Garbage In, Garbage Out!Here are some basic assumptions of chi square. As you will see, many inferential statistics come with many assumptions. What should you do when they are violated?With the many assumptions going into inferential statistics, it's quite possible to violate a rule or two. When this happens, you won't get a parking ticket - instead you do the following:1. Fix your data in a reasonable fashion (get rid of outliers, etc) to meet the rules2. Pick another statistical test that's more fitting (there are dozens out there that we have not discussed!)3. Run the statistics with a big warning to the reader about the violations.