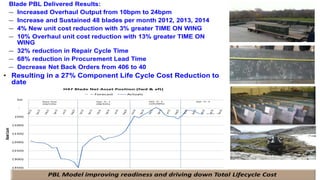
1. PBL Model improving readiness and driving down Total Lifecycle Cost
Blade PBL Delivered Results:
– Increased Overhaul Output from 10bpm to 24bpm
– Increase and Sustained 48 blades per month 2012, 2013, 2014
– 4% New unit cost reduction with 3% greater TIME ON WING
– 10% Overhaul unit cost reduction with 13% greater TIME ON
WING
– 32% reduction in Repair Cycle Time
– 68% reduction in Procurement Lead Time
– Decrease Net Back Orders from 406 to 40
• Resulting in a 27% Component Life Cycle Cost Reduction to
date
(350)
(300)
(250)
(200)
(150)
(100)
(50)
-
50
BladeCount
H47 Blade Net Asset Position (fwd & aft)
Forecast Actuals
Base Year
(58/53%)
Opt. Yr. 1
(98/92%)
Opt. Yr. 2
(105/88%)
Opt. Yr. 3