amino acid paper chromotography lab
•Télécharger en tant que PPT, PDF•
12 j'aime•7,402 vues

Mixtures of compounds are very common in Organic Chemistry. Most reactions produce more than one product. Naturally occurring materials are only rarely 100% pure. It is therefore desirable to have a simple, fast and efficient way to determine the purity of Organic mixtures. The separation of a mixture by passing it, in solution, over an adsorbent (such as Alumina or Silica Gel) is the basic idea of Chromatography. Chromatography is a very general phenomenon. It involves the passage of a mobile phase across a stationary phase in a column. Usually a mixture of compounds is present in the mobile phase

Recommandé
Contenu connexe
Tendances
Tendances (20)
En vedette
En vedette (20)
Similaire à amino acid paper chromotography lab
Similaire à amino acid paper chromotography lab (20)
Plus de Dr Robert Craig PhD
Plus de Dr Robert Craig PhD (20)
amino acid paper chromotography lab
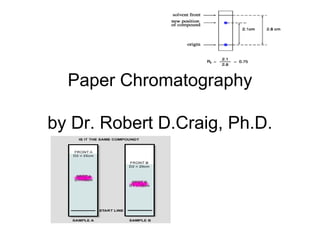
- 1. Paper Chromatography by Dr. Robert D.Craig, Ph.D. .
- 2. Chromatography • Chromatography is usually introduced as a technique for separating and/or identifying the components in a mixture.
- 3. The theory • The basic principle is that components in a • mixture have different tendencies to adsorb onto a surface or dissolve in a solvent. • It is a powerful method in industry, where it is used on a large scale to separate and • purify the intermediates and products in various syntheses
- 4. The theory • There are several different types of chromatography currently in use – ie paper • chromatography; thin layer chromatography (TLC); gas chromatography (GC); liquid • chromatography (LC); high performance liquid chromatography (HPLC); ion • exchange chromatography; and gel permeation or gel filtration chromatography.
- 5. Basic principles • All chromatographic methods require one static part (the stationary phase) and one • moving part (the mobile phase). The techniques rely on one of the following • phenomena: adsorption; partition; ion exchange; or molecular exclusion.
- 6. Adsorption • Adsorption chromatography was developed first. It has a solid stationary phase and a liquid or gaseous mobile phase. (Plant pigments were separated at the turn of the 20th century by using a calcium carbonate stationary phase and a liquid hydrocarbon mobile phase.
- 7. Adsorption • The different solutes travelled different distances through the solid, carried along by the solvent.) Each solute has its own equilibrium between adsorption onto the surface of the solid and solubility in the solvent, the least soluble or best adsorbed ones travel more slowly. • The result is a separation into bands containing different solutes.
- 8. Adsorption • Liquid chromatography using a column containing silica gel or alumina is an example of adsorption chromatography (Fig. 1). • The solvent that is put into a column is called the eluent, and the liquid that flows out of the end of the column is called the eluate.
- 9. Paper chromotography • This is probably the first, and the simplest, type of chromatography that people meet. • A drop of a solution of a mixture of dyes or inks is placed on a piece of chromatography paper and allowed to dry. The mixture separates as the solvent front • advances past the mixture. Filter paper and blotting paper are frequently substituted for chromatography paper if precision is not required. Separation is most efficient if the atmosphere is saturated in the solvent vapour
- 10. Today . . . . • Some simple materials that can be separated by using this method are inks from fountain and fibre-tipped pens, food colourings and dyes. The components can be regenerated by dissolving them out of the cut up paper.
- 11. Stationary and mobile phases • The efficiency of the separation can be optimised by trying different solvents, and • this remains the way that the best solvents for industrial separations are discovered • (some experience and knowledge of different solvent systems is advantageous). • Paper chromatography works by the partition of solutes between water in the • paper fibres (stationary phase) and the solvent (mobile phase).
- 12. Stationary and mobile phases • Common solvents that are used include pentane, propanone and ethanol. Mixtures of solvents are also used, including aqueous solutions, and solvent systems with a range of polarities can be made
- 13. Stationary and mobile phases A mixture useful for separating the dyes on Similarities is a 3:1:1 mixture (by • volume) of butan-1-ol:ethanol ammonia solution.
- 14. You goal today . . . Rf factor determination • As each solute distributes itself (equilibrates) between the stationary and the mobile phase, the distance a solute moves is always the same fraction of the distance moved by the solvent. This fraction is variously called the retardation factor or the retention ratio, and is given the symbol R or Rf:
- 15. 2D chromotography • It is possible that two solutes have the same Rf values using one solvent, but • different values using another solvent (eg this occurs with some amino acids). This • means that if a multi component system is not efficiently separated by one solvent the • chromatogram can be dried, turned through 90 degrees, and run again using a second solvent.
- 16. The Rf factor
- 17. Rise over run of solvent front
- 18. Procedures for finishing Lab #2 • Find your (2) Chromatography strips (Known & unknown) • Compare your strips with other classes • Note where the amino acid moved **If it is speared approximate its location using the other classes. • Measure the distances moved by the solvent and the amino acid • Calculate the Rf value and enter your value in the computer • Identify your unkown using all of the Rf values • Write up your lab report
- 19. Introduction/Background • Purpose of the lab and its importance toward our study of Chemistry and Biology. • What are the various ways that compounds can be separated (use your research) • Why is paper chromatography being used for our setting? • How does this method work? • What are the goals for this lab?
- 20. Hypothesis & Preparations for Lab • Must be a clear statement of what you predict will happen. • Follow your prediction with reasons why you have made this statement • Identify the independent and dependent variables • Provide a list of materials needed to do this lab. Be sure the list is complete including size and number of items needed.
- 21. Method & Procedures • Write a step by step procedure indicating everything you did in this lab. • A bulleted list can be helpful • Use the handout I gave you as a starting point and make all of the necessary modifications to be as accurate as possible. • Someone reading this procedure should be able to follow these instructions and do exactly what you did. This would include: – How the data was obtained – How the data will be analyzed
- 22. Data- How to Organize it -show where the solvent and solvent front moved to with the measured distances (cm) • Show the Rf value you calculated next to these strips • Be sure to explain how all of the data was obtained in your table
- 23. Lab # 2: Guidelines for Write Up • Title • Introduction/Background • Hypothesis • Independent & Dependent Variables • Materials (modify the list w/specifics) • Procedure (modify from what I gave you) • Data (both chromatography strips cut in half) • Data Table • Analysis w/ graph • Conclusion & Evaluation
- 24. Analysis • Graph your data (molecular weight vs. Rf or distance moved) • Review your hypothesis - were you right? • Explain what happened vs. what you predicted • Why were you wrong or right? • Explain how you interpreted your results (procedure & methods) • Look for any patterns, correlations, or relationships that might be significant • Were you able to identify the unknown? Explain
- 25. Sources of Error & Evaluation • What were some of the problems you encountered during the lab? • Why were your results different from others? • How can this lab be improved?
- 26. Lab # 2: Guidelines for Write Up • Title • Introduction/Background • Hypothesis • Independent & Dependent Variables • Materials (modify the list w/specifics) • Procedure (modify from what I gave you) • Data (both chromatography strips cut in half) • Data Tables • Analysis w/ graph • Conclusion & Evaluation