Software Business Strategy
•
2 j'aime•656 vues

Software Business Strategy : Bridging the Gap Between Business Strategy and Software Development

Recommandé
Contenu connexe
Tendances
Tendances (19)
Similaire à Software Business Strategy
Similaire à Software Business Strategy (20)
Plus de Rubayet Hassan
Plus de Rubayet Hassan (18)
Dernier
Dernier (20)
Software Business Strategy
- 1. Twenty Eighth International Conference on Information Systems, Montreal 2007 1 BRIDGING THE GAP BETWEEN BUSINESS STRATEGY AND SOFTWARE DEVELOPMENT Information Systems Strategy and Governance Victor Basili Fraunhofer CESE & University of Maryland College Park, MD, USA basili@fc-md.umd.edu Jens Heidrich Fraunhofer IESE & University of Kaiserslautern Kaiserslautern, Germany jens.heidrich@iese.fraunhofer.de Mikael Lindvall Fraunhofer CESE College Park, MD, USA mikli@fc-md.umd.edu Jürgen Münch Fraunhofer IESE Kaiserslautern, Germany juergen.muench@iese.fraunhofer.de Myrna Regardie Fraunhofer CESE College Park, MD, USA mregardie@fc-md.umd.edu Dieter Rombach Fraunhofer IESE & University of Kaiserslautern Kaiserslautern, Germany dieter.rombach@iese.fraunhofer.de Carolyn Seaman Fraunhofer CESE & University of Maryland Baltimore Campus College Park & Baltimore, MD, USA cseaman@fc-md.umd.edu Adam Trendowicz Fraunhofer IESE Kaiserslautern, Germany adam.trendowicz@iese.fraunhofer.de Abstract In software-intensive organizations, an organizational management system will not guarantee or- ganizational success unless the business strategy can be translated into a set of operational soft- ware goals. The Goal Question Metric (GQM) approach has proven itself useful in a variety of in- dustrial settings to support quantitative software project management. However, it does not ad- dress linking software measurement goals to higher-level goals of the organization in which the software is being developed. This linkage is important, as it helps to justify software measurement efforts and allows measurement data to contribute to higher-level decisions. In this paper, we pro- pose a GQM+ Strategies measurement approach that builds on the GQM approach to plan and implement software measurement. GQM+ Strategies® provides mechanisms for explicitly linking software measurement goals to higher-level goals for the software organization, and further to goals and strategies at the level of the entire business. An example application of the proposed method is illustrated in the context of an example measurement initiative. Keywords: Goal-oriented Measurement, GQM, GQM+ Strategies® Registered trademark application pending, Fraunhofer USA and Fraunhofer IESE.
- 2. Information Systems Strategy and Governance 2 Twenty Eighth International Conference on Information Systems, Montreal 2007 Introduction In today’s competitive software development market, organizational survival and growth require effective means to align organizational business objectives with software project management. Organization-wide business objectives reflect a corporate vision, which includes such aspects as improvement/maintenance of customers’/stakeholders’ satisfaction and market share. At the organizational level, an effective management system offers numerous poten- tial benefits such as focus on areas critical for financial success, effective use of resources, analysis of market poten- tial and opportunities for innovation, development of a learning environment, etc. An organizational management system will not guarantee organizational success unless the business strategy can be translated into a set of operational software goals and respective quantitative project management. Corporate execu- tives do not only have to clearly define business goals and communicate them to project managers, but they also have to be able to map corporate objectives onto operational-level software project goals and measurement systems. This will help ensure reliable management and alignment of goals at all organizational levels. Even if senior man- agement defines an effective business strategy, it might happen that when mapped onto operational-level software project objectives, they will stay in conflict. Organizational success will then depend on the synchronization of cor- porate strategies in terms of market opportunities or competitiveness and software project objectives such as in- creased product reliability or reduced development schedule. To understand the relationships between objectives on both strategic (organization) and implementation (project) levels as well as to verify their achievement, quantitative data is required. This is one of the reasons that quantitative methods are required at high-maturity organizations. A common mistake software organizations make in reaching for higher maturity levels is that the measurement of key performance indicators (KPIs) on the project level is per- ceived as a final objective, developed in isolation of indicators on the organizational level. Improvement strategies, such as CMMI (Chrissis et al., 2007) and ITIL (OGC, 2002), are not directly linked to generating business value; thus, it is not enough to merely follow such strategies, because they are strictly software strategies; the strategies need to be linked to business goals. This leads to the situation where a large effort invested into collecting project data does not result in the expected benefits. Even if data on the strategic level and on the project level tell “how we are performing” on each of those levels, the contribution of project performance to the achievement of strategic goals usually remains unclear. The popular Goal Question Metric (GQM) approach (Basili & Weiss, 1984; Basili et al., 1994) has served the soft- ware industry well for several decades in defining their measurement programs. Yet, it does not provide explicit support for integrating its software measurement model with elements of the larger organization, such as higher- level business goals, strategies, and assumptions. This linkage is important for several reasons. Software engineers are, for instance, frequently faced with apparently unrealistic goals related to software development. For example, if the next version of a product with some embedded software needs to be released to the market in half of the origi- nally planned time, the software development schedule is often simply cut in half. There is rarely a discussion of trade-offs or other options to avoid unsatisfactory results. Software-specific business goals and strategies need to be defined explicitly and derived from business goals in a systematic and transparent way. Those deficits call for an integrated approach that provides a structured and quantitative way to define and synchro- nize organization-strategic objectives and software project objectives. In this paper, we propose a GQM+ Strategies measurement method developed at Fraunhofer CESE (Maryland, USA) and Fraunhofer IESE (Kaiserslautern, Germany). This approach is based on the GQM approach, which is to- day in widespread use for creating and establishing measurement programs throughout the software industry. This extension to GQM adds the capability to create measurement programs that ensure alignment between business goals and strategies, software-specific goals, and measurement goals. The remaining part of the paper is organized as follows. First, we review related work relevant to the measurement method presented in this paper. Next, we describe GQM+ Strategies® and illustrate its application to a particular business goal. Then, we provide brief practical guidelines for implementing a measurement program in an industrial context. Finally, a summary and future work perspectives are given. Registered trademark application pending, Fraunhofer USA and Fraunhofer IESE.
- 3. Basili et al. / Bridging the Gap between Business Strategy and Software Development Twenty Eighth International Conference on Information Systems, Montreal 2007 3 Related Work In this section, we briefly summarize and review previous work that is relevant to the measurement approach de- scribed in this paper. We begin by discussing various approaches to goal-oriented software measurement, one of which (GQM) is the basis of the work described in the rest of the paper. Two other goal-oriented approaches are also described. Finally, we review other previous attempts to develop a measurement approach that incorporates both organizational-level and project-level concerns. Goal-oriented Software Measurement Common problems that software development organizations encounter in instituting software measurement pro- grams include too much data collected, not the right data collected, and insufficient analysis of the data that is col- lected. This leads to numerous problems, including decreased cost effectiveness of the measurement program and disillusionment about metrics on the part of developers and managers. The end result is often the eventual failure of the measurement program as a whole. In response to such problems, several structured approaches to software measurement have been developed and are used in organizations. These approaches are referred to as “goal-oriented” approaches because they use goals, objec- tives, strategies, or other mechanisms to guide the choice of data to collect and analyze in a systematic way. One well-known goal-oriented approach is the GQM approach (Basili et al., 1994a), which is described in the following section. Two others approaches, Balanced Scorecard (BSC) and Practical Software Measurement (PSM), are also described below. The GQM Method The GQM approach (Basili et al., 1994a) provides a method for an organization or a project to define goals, refine those goals down to specifications of data to be collected, and then analyze and interpret the resulting data with re- spect to the original goals. GQM goals are defined in terms of purpose, focus, object of study, viewpoint, and con- text. For example, a possible GQM goal might be: Purpose: Improve Focus: the timeliness of Object: change request processing Viewpoint: from the project manager’s viewpoint Context: the characteristics of a particular division in some company Such a goal is then refined into specific questions that must be answered in order to evaluate the achievement of the goal. The questions are then operationalized into specific quantitative measures. All the components of the goal are used in formulating the questions and specifying the measures by narrowing down the space of inquiry to those questions and metrics that are relevant to the goal and also by making sure all aspects of the goal are covered by the questions and metrics. A relevant question and associated metrics taken from (Basili et al., 1994a) and related to the above goal might be: Question: What is the current change request processing speed? Metrics: Average cycle time of a change request Standard deviation % cases outside of the upper limit An important feature of GQM is its focus on the cost effectiveness of data collected, i.e., on minimizing the amount of data collected while maximizing the amount of information gathered. This means that the resulting set of metrics is usually smaller than the original set of goals. Implicit in the GQM approach is the use of interpretation models. These are models of the products, processes, and quality perspectives of interest, from which the metrics themselves are defined. Interpretation models, as the name implies, help practitioners interpret the data yielded by the metrics. In the example above, a process model depicting the change request process would be an important interpretation model. It would explain the scope of the change request process, which would be necessary to correctly interpret data about cycle time.
- 4. Information Systems Strategy and Governance 4 Twenty Eighth International Conference on Information Systems, Montreal 2007 GQM was originally developed in the NASA Goddard Space Flight Center’s flight software development environ- ment, which was also the originating environment for the Quality Improvement Paradigm (QIP). The QIP (Basili, 1989) is an evolutionary model tailored for improvement of software development organizations. It includes a goal- setting step, as well as steps that involve measurement and evaluation of improvement efforts. GQM is used in these steps of the QIP, so the two concepts are closely related. Other Goal-Oriented Approaches Balanced Scorecard (Kaplan and Norton, 1992) is an approach to linking measurement at all levels of an organiza- tion to the organization’s strategy. The “scorecard” consists of four perspectives: financial, customer, internal busi- ness processes, and learning and growth. BSC does not dictate a static set of measures, but serves as a framework for choosing measures, processes, and initiatives that are aligned with organizational strategy and higher-level business goals. The idea is to create linkages among the four perspectives so that all activities contribute to a unified strategy. Thus, BSC can be viewed as a tool for translating the strategy into operation. BSC has become popular because it is fairly easy to use and has automated tool support (Becker and Bostelman, 1999). Practical Software Measurement (DoD, 2003) offers very detailed guidance on software measurement, including a catalogue of specific measures, along with information on operationalizing them in an organization. PSM also includes a process for choosing ap- propriate measures based on the issues and objectives relevant to a software development project. PSM was devel- oped by the US Department of Defense, and is based on the long-term experience of the Defense Department and its software contractors. For specific domains and application fields, specific approaches exist that emphasize the need for linking business goals to lower-level properties. Examples include approaches focusing on performance management across the or- ganization or those addressing specific areas like managing IT infrastructure. For the latter, for instance, several regulatory constraints in the IT governance domain and the IT service domain (such as SOX) have been developed recently. The solutions proposed by models in these domains, especially COBIT® 4.1 (ISACA, 2007) and ITIL re- lease 3, offer connections between predefined sets of goals and attributes of the IT infrastructure. CoBIT® , for ex- ample, is based on a process model that subdivides IT into four domains and 34 processes. However, a methodology is missing to adapt and tailor the solution to the specific needs of an organization. Such a solution should model measurable goal statements that may be tracked regularly and address the specific context as well as document in- herent assumptions. Also, there is no clearly defined interpretation model that makes statements about whether the overall strategy is working or has to be changed to avoid business failure. GQM+ Strategies® can focus on all soft- ware-related activities and aspects of a company and integrate them into its business strategies. Aligning Business and Software Objectives Most of the approaches attempting to align measurement at the business level and software level are combinations of well-known approaches to measurement (i.e., BSC, GQM, and PSM). Becker and Bostelman’s (1999) work ad- dresses the misalignment between strategy at the organizational and project levels of software organizations caused by project data that does not address organizational goals and organizational goals that fail because they are not op- erationalized through processes and metrics at the project level. Specifically, the authors developed a common measurement framework to support the alignment of organizational and project-level goals. Their approach is to embed a GQM structure within each of the four BSC perspectives. One advantage of this approach is that it allows more consistency in notation and terminology surrounding goals and measures at all levels. However, Becker and Bostelman’s approach does not recognize or support truly different goals at different levels of the organization. In our approach, we create mappings between the data related to goals at different levels, so that insights gained rela- tive to one goal at one level can still feed up and contribute to satisfying goals at higher levels, without requiring that each level share the same goals. Becker and Bostelman’s approach also requires that GQM be used to operationalize goals that may not be related to the software part of the business, where GQM may not be appropriate. Buglione and Abran (2000) also discuss the misalignment problem addressed by Becker and Bostelman (1999). However, Bugione and Abran’s work is more of a comparison, than a merger, of BSC and GQM. They found that the major differences between BSC and GQM lie in the object of measurement (BSC focuses on the organization while GQM is more project-focused), the nature of the approach (GQM is a technique for project measurement while BSC is a comprehensive framework), and the approach’s incorporation of organizational strategy (BSC broadly incorporates organizational strategy and goals while GQM does not).
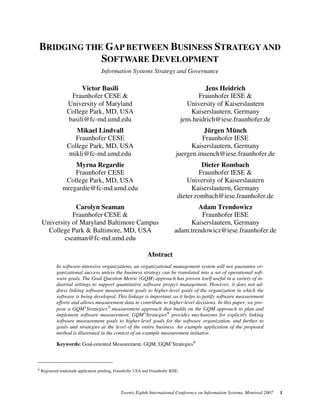
- 5. Basili et al. / Bridging the Gap between Business Strategy and Software Development Twenty Eighth International Conference on Information Systems, Montreal 2007 5 The M3 P – Model, Measure, Manage Paradigm – is an extension of the QIP and GQM presented by Offen and Jeffery (1997). Like Becker and Bostelman’s (1999) approach, M3 P embeds GQM as a measurement definition technique within a larger framework that encompasses higher-level organizational concerns. While Becker and Bos- telman use BSC for the larger framework, M3 P incorporates a business model from which the GQM goals are de- fined. Again, like Becker and Bostelman, M3 P does not allow for goals at different levels of the organization that are different but explicitly linked, to allow analysis of measurement data to feed back up the chain. PSM has also been combined with GQM and/or BSC to create broader approaches to measurement. Bianchi (2001) combines BSC, GQM, and PSM in an approach to organizational measurement that aligns IT decision-making with organizational strategy. Like Becker and Bostelman’s (1999) and Offen and Jefferey’s (1997) approaches, Bianci uses BSC as an overall framework, then uses GQM within each perspective to further specify measurement goals and questions. Then, PSM is used to operationalize the specific metrics. Card (2003) also discusses the use of BSC to inject enterprise-level concerns into the use of PSM. The GQM+ Strategies® Method The GQM+ Strategies® method adds several extensions on top of the GQM model. As described previously, GQM represents a systematic approach for tailoring and integrating goals with models of the software processes, products, and quality perspectives of interest, based upon the specific needs of the project and the software domain of an or- ganization. The goals are defined in an operational, traceable way by refining them into a set of quantifiable ques- tions that are used to extract the appropriate information from the interpretation models. The questions and models define the metrics and the metrics, in turn, specify the data that needs to be collected. The interpretation models pro- vide a framework for interpretation of the collected data. Business Goals, e.g., Improve Customer Satisfaction Lower Production Costs Reduce Time to Market Software Goals, e.g., Improve System Test Effectiveness Increase User Involvement in Development Measurement Goals Question Question Metric Metric Metric Metric Linkages Linkages Strategies define tradeoffs to identify specific Software Goals that contribute to achieving the Business Goal Software Goals are carried out using scenarios to define Measurement Goals GQM R e s u l t s R e s u l t s Measures are derived from Measurement Goals to interpret higher-level goals Figure 1. The GQM+ Strategies® Method In extending GQM, the GQM+ Strategies® approach, depicted in Figure 1, makes the business goals, strategies, and corresponding software goals explicit. Strategies are formulated to deal with business goals such as improving cus- tomer satisfaction, garnering market share, reducing production costs, and more, taking into account the context and making explicit any assumptions. Strategies also help define lower-level goals that can be assigned to different parts of the organization, e.g., software goals, hardware goals, marketing goals, etc. For our work, we focus on software goals at this level because we are concerned with relating software project measurement to higher-level business goals. GQM+ Strategies® also makes the relationships between software-related activities and measurement goals explicit. Sequences of activities necessary for accomplishing the goals are defined by the software organization and embedded into scenarios in order to achieve some software-related goal. Links are established between each soft- ware goal and the business-level strategy it supports. Attached to goals, strategies, and scenarios at each level of the model is information about relationships between goals, relevant context factors, and assumptions. The entire model
- 6. Information Systems Strategy and Governance 6 Twenty Eighth International Conference on Information Systems, Montreal 2007 provides an organization with a mechanism not only to define software measurement consistent with larger, upper- level organizational concerns, but also to interpret and roll up the resulting measurement data at each level. GQM+ Strategies® linkages and measures ensure that the business goals are fulfilled. For example, assume an organization has decided to increase customer satisfaction. The strategy chosen to achieve this business goal might be to improve the reliability of the product (which includes both hardware and software elements). It is determined that the software development part of the organization could best contribute by reducing defect slippage to customers by improving the software system testing process (a software goal). The leaders of the software unit then decide on a set of actions (i.e., a scenario) to achieve this improvement, including creating a data baseline of current defect slippage, consulting experts for potential specific improvements to the system testing process, implementing the improvements, and measuring the results. Some of these scenario steps directly generate measurement goals, e.g., measuring defect slippage. These measurement goals are then the starting point for apply- ing traditional GQM to determining questions and specific metrics and data (e.g., system test defect data) for achiev- ing those measurement goals. Applying GQM+ Strategies® in this situation would result in an integrated model that makes the linkages explicit between the initial business goal (improving customer satisfaction) and the data gener- ated by the software measurement plan (system test defect data). This not only provides a meaningful rationale for the software measurement effort, but also provides a blueprint for interpreting the data at each level up the chain. Assumptions may be reexamined and modified to create new strategies and scenarios. Most importantly, the effects of any changes can be understood in the context of the entire goal set. GQM+ Strategies® is not limited to exactly three levels when breaking down goals and strategies (business, software, and project level). The GQM+ Strategies® meta-model allows multiple goal levels and permits deriving multiple strategies for each of these goal levels. However, for certain application fields, it makes sense to focus on certain goal and strategy levels and give them more concrete names, as in our case for software-oriented organizations. The GQM+ Strategies® meta-model instantiation presented in this paper distinguishes eight conceptual elements that form the basis for constructing a consistent model. Table 1 defines all conceptual elements and Figure 2 gives an over- view of the relationships between those elements. Table 1. Definition of Conceptual GQM+ Strategies® Elements Business goals A hierarchical set of goals the organization wishes to accomplish in general in order to maintain business success. Strategy decisions A set of possible approaches for achieving business goals. Software goals A set of goals directly related to the software process or product for implementing the strategy decisions. Scenarios Sets of concrete steps for achieving selected software goals. (Templates are available to support this.) Measurement goals Goals that help to make scenario steps operational through meas- urement. Interpretation models Models that help interpret data to determine whether goals at all levels are achieved. Assumptions Estimated unknowns that can affect the interpretation of the data. Context factors Environmental variables that change the kind of models and data that can be used. A business goal may be refined by more specific business goals. Four different types of business goals are distin- guished: growth goals, success goals, maintenance goals, and specific focus goals. Growth goals include acquiring new projects within the current competence areas, expanding the existing project set, evolving existing competen- cies, building new competencies, etc. Success goals include delivering good products to customers, controlling costs, shrinking schedules, increasing profits, achieving corporate visibility (e.g., awards), or building core compe- tencies. Maintenance (internal) goals include transparency, employee satisfaction, controlled risk, learning environ- ment; the idea is to measure to assure no decrease. Specific focus goals include such things as making the helpdesk more efficient, or predicting if a proposed effort has a good ROI.
- 7. Basili et al. / Bridging the Gap between Business Strategy and Software Development Twenty Eighth International Conference on Information Systems, Montreal 2007 7 Assumptions and context factors are used to drive the goal refinement process. They are used to explicitly define the rationale behind a business goal, select a strategy, interpret a software goal, select a relevant scenario, and define measurement goals. When the complete goal hierarchy is defined, the measures can be taken and interpretations made to see if the goals at all levels have been achieved. Measurement data is collected according to the GQM+ Strategies® measurement plan. Business Goal Software Goals Context/ Assumptions Strategy Decisions refined by Scenarios restricted by Interpretation Models interpreted by Object: Review process Purpose: Improve the review process Quality: Review efficiency Viewpoint: QA manager Context: A review process of Company XY Object: Review process Purpose: Improve the review process Quality: Review efficiency Viewpoint: QA manager Context: A review process of Company XY What’s the efficiency of the review process? What’s the efficiency of the review process? What influences the efficiency? What influences the efficiency? Found defects per reviewer per hour Found defects per reviewer per hour Human Factors?Human Factors? Technical Factors?Technical Factors? average years of experience in reviews average years of experience in reviews # pages of reviewed document # pages of reviewed document # figures of reviewed documents # figures of reviewed documents # found defects # found defects sum of review time of all reviewers sum of review time of all reviewers # reviewers# reviewers GQM refined by Measurement Goals Figure 2. Components of the GQM+ Strategies® Method The GQM+ Strategies® method consists of the following steps that define and apply the conceptual model: 1) Determine and define the right business goals. a) In order to define a business goal for an organization, one needs to determine the basic motivation first and to informally describe the business goal and the rationale that leads to defining the goal (making use of context factors and assumptions). For instance, one wants to safeguard a place in the market and therefore increase costumer satisfaction. b) The business goal needs to be formalized, which is facilitated by filling out a goal template. The template consists of eight sections. First, the main focus (cost, profit, turnover, market share, prestige, customer sat- isfaction) and object (people, market, a project, collection of projects, customer) of the business goal is ad- dressed as well as the basic activity that is performed (reducing, increasing, achieving, pursuing, or provid- ing the main focus of the business goal). In addition, the goal has to be quantified by specifying a magni- tude (like x%, $1M, y% more than last year) and a timeframe in which the magnitude has to be achieved (3 years, till January 1, 2008, or permanently). Finally, the scope needs to be defined (the whole organization, a certain business unit, or a person) as well as constraints (limited influence on certain factors, laws, mis- sion statement and basic principles) and relations with other goals (tradeoffs, hierarchy, and ordering). c) Criteria are identified for evaluating the achievement of the business goal, including defining how to ag- gregate and interpret the measures and models. 2) Select the right set of strategy decisions. a) A list of potential strategies for achieving the business goal needs to be identified (e.g., building a more re- liable system that will lead to less customer complaints vs. testing reliability in). b) The most promising strategy has to be selected considering feasibility, cost, and benefit, taking into account context factors and assumptions. Context factors and assumptions restrict the set of applicable strategies. 3) Select the right software goals. a) The implications of the chosen strategy with respect to software development have to be elicited. For in- stance, in order to test in reliability, the software test processes must be examined. b) Potential software goals need to be identified based on this analysis (e.g., decrease customer reported de- fects by improving system test effectiveness).
- 8. Information Systems Strategy and Governance 8 Twenty Eighth International Conference on Information Systems, Montreal 2007 c) The most promising goal considering feasibility, cost, and benefit for each potential software goal is se- lected. Again, context factors and assumptions help to define the right selection criteria. d) The software goal needs to be formalized, with the help of a goal template, which is similar to formalizing business goals. e) The last step is to identify criteria for evaluating the achievement of the software goal. Again, measures and models demonstrating how to aggregate and interpret the measures are defined based on the magnitude and timeframe definition of the formalized software goal. 4) Select the right scenario and scenario steps. a) Potential scenarios are identified that consist of a set of tailorable steps for implementing the software process strategy. b) Questions relating to the potential scenario have to be addressed, such as: Does historical data related to my goal and interpretation model exist; are the projects from the historical data set relevant; or are experts available to make intelligent estimates for the historical baselines? The results of these inquiries lead to a list of context factors and assumptions. c) Select the right set of steps of the scenario enabling achievement of the software goals based on context factors and assumptions. d) The interpretation models of the business and software goal may lead to a refinement depending on whether the selected scenario steps have a relevant influence. 5) Select the right measurement goals. a) Potential measurement goals for the selected scenario steps need to be identified. b) The GQM goal template is used in order to formalize the measurement goal. The measurement object, pur- pose, quality aspect, viewpoint, and context are defined. 6) Derive questions and metrics using GQM. a) GQM questions and metrics and criteria for evaluating the achievement of the measurement goals are de- termined. b) Interpretation models are defined for aggregating and interpreting the collected measurement data. Multiple Business Goals explicitly defined as part of the GQM+ Strategies® method most likely will have interrelated relationships with each other. The most obvious relationship (documented in the conceptual model) is a hierarchical structure consisting of a top goal and sub-goals for organizations, inherited by divisions, projects, and/or individuals. For a certain goal (business goal, software goal, or measurement goal), a set of complementary goals may exist that additionally support the current goal. A set of competing goals may exist that conflict with the current goal while other goals may be totally unaffected by the current goal; these are referred to as indifferent goals. Implementing a Measurement Program After defining a measurement program, it must be deployed within the context of a specific organization. Measure- ment implementation consists of four major activities: • Measurement Instrumentation • Data Collection and Validation • Data Analysis, Visualization, and Interpretation • Management of a Measurement Program Measurement Instrumentation The objective of measurement instrumentation is to make measurement operational. Typical instrumentation activi- ties include creating a measurement plan and preparing data collection tools. A Measurement Plan defines the proc-
- 9. Basili et al. / Bridging the Gap between Business Strategy and Software Development Twenty Eighth International Conference on Information Systems, Montreal 2007 9 ess and denotes for each measure the persons responsible for collecting the data and reporting results, including the frequency for both. While selecting the personnel responsible for data collection, the following issues should be considered in order to assure appropriate quality of data: • Expertise: technical or managerial expertise to provide high-quality data • Bias: potential sources of bias in the collected data (e.g., due to specific interests) • Access: direct access to measured artifacts • Cost: cost effects (consequences) of the involvement in the measurement • Availability: time available to spend on data collection (as defined in the measurement plan) • Motivation: personnel committed regarding the measurement program Included in the plan are the points during the development process at which data are to be collected and those devel- opment artifacts that are subject to measurement. In principle, a certain measure may be collected once or multiple times. Multiple measurements may be performed per designated frequency or on an event basis. The number of re- quirements measures, for instance, may be collected after the requirements freeze (once), at the end of each devel- opment life cycle phase (time basis), or after each requirements change (event basis). Additionally, a measurement plan may include suggested implementation guidelines, e.g., how to collect data more effectively and efficiently. Data collection tools facilitate collecting, storing, maintaining, and retrieving measurement data. Dependent on the type of collected data (qualitative or quantitative), measurement instruments may range from manual, paper-based data collection forms to semi-automated forms, email-triggered collection, and online forms. Fully automated col- lection may involve using static analyzers of software development products (e.g., code, design, and documenta- tion). Other data collection instruments may be stand-alone tools or plug-ins, or may be an integral part of larger software development environments (e.g., CASE tools). An important issue to consider during the selection of data collection instruments is their acceptance by data providers. Without such acceptance, data collection usually suffers from missing, faked, or manipulated data. Data storage, maintenance, and retrieval tools should assure effective and efficient usage of the collected measure- ment data according to objectives defined at various levels of the GQM+ Strategies® . The experience factory (EF) (Basili et al., 1994) was created to support these objectives. It defines a logical and/or physical structure to collect, maintain, and reuse various types of organizational experiences represented by measurement data, lessons learned, processes, and models. EF provides mechanisms to access and modify (reuse) stored data in order to meet the in- formation needs of a specific project, based upon actual business, software, and measurement objectives. Data Collection and Validation Data collection is not limited to gathering the measurement data. Correct implementation of a measurement program requires data validation to assure that later data analysis and interpretation are based upon valid data. As already mentioned, the selection of appropriate people (data providers) and tools are key determinants of valid data. A nega- tive attitude of data providers towards measurement and/or a lack of tool acceptance may result in biased, incom- plete, and inconsistent data. In order to increase measurement acceptance and prevent invalid output, data collection should be as unobtrusive as possible and people must not feel monitored or “exposed” by measurement. Therefore, the purposes of the measurement should be clearly communicated to the affected personnel and data collection should be automated whenever it is possible. Besides preventive actions, a postmortem analysis of measurement outputs might be used to identify potentially in- valid data. For that purpose, basic descriptive statistics or simple consistency checks might be used. Descriptive sta- tistics might be used to identify potentially invalid data (e.g., outliers) and moderate their impact on the results of data analysis and interpretation. Potentially invalid data may then be either excluded from the analysis or explicitly considered during analysis and interpretation. Consistency checks may, for instance, insist on collecting the same data with various instruments (e.g., different tools and experts) and comparing results with respect to alignment. Such an approach would, however, require collecting redundant data. On the other hand, consistency checks might be based on common sense and expectations regarding the measured output. If measured data does not match intui- tive expectations, the underlying reasons should be investigated.
- 10. Information Systems Strategy and Governance 10 Twenty Eighth International Conference on Information Systems, Montreal 2007 Finally, the data collection process should be controlled with respect to the measurement plan. This includes track- ing that the data is collected according to definitions and that it is provided according to schedule. Data Analysis, Visualization, and Interpretation Data analysis and visualization typically consist of first looking at descriptive statistics and then applying quality models. Yet, various analysis techniques require specific characteristics of the input data. Statistical methods, for instance, usually assume completeness and normal distribution of the data. On the other hand, the computational complexity of some machine learning techniques limits their practical applicability for large data sets. Moreover, certain analysis methods require input data to be measured on specific measurement scales (e.g., at least interval). In consequence, applying certain analysis methods requires, in practice, prior data preprocessing. Typical preprocess- ing activities include (Weiss and Indurkhya, 1997): • Data formatting (e.g., removing special characters) • Data integration (i.e., merging data collected from various sources, removing redundancies, resolving conflicts) • Data cleaning: • Dealing with missing data (e.g., through data imputation) • Smoothing (i.e., dealing with noisy data) • Data transformation: • Data normalization (e.g., normalization of standard deviation) • Data discretization (i.e., transforming continuous data into discrete data) • Data augmentation (i.e., transforming textual data into numerical data) • Unit conversion (i.e., transforming measurement units) • Data reduction (reducing the number of attributes and/or cases) After preparing the data, analysis and visualization may be performed. As the first step of analysis, descriptive sta- tistics are usually employed to understand the nature of the analyzed data represented by such characteristics as range, central tendency, and dispersion. Example descriptive statistics include mean, median, and standard deviation of data. Next, inferential analysis is used to analyze dependencies between measures and interpret with respect to the achievement of goals on various abstraction levels. The impact of measures (and goals) at lower levels of abstraction on measures and goals on higher levels is evaluated. During data analysis, the context information should be consid- ered in order to properly interpret results. Context, represented by a set of context factors, characterizes important attributes of the setting in which the measurement objects (product, processes, etc.) are considered. Context specifi- cation is an important part of defining goals and deriving measures, since it prevents drawing wrong conclusions from the analysis. Visualization supports the analysis of both rough measurement data as well as the results of data analysis, provides a basis for interpreting the results of data analysis, and supports understanding complex data characteristics and inter- actions. Numerous graphical notations exist to present data. The selection of a certain notation depends on the pur- pose of the visualization (e.g., presenting a trend or dependency) and the nature of the underlying data (e.g., number of characteristics). The most common graphs include box plots, pie charts, histograms, bar charts, and scatter plots. Management of a Measurement Program As with any other engineering process, in order to be effective, measurement must be integrated within project and organizational processes and must be managed appropriately. Typical management activities include (1) planning measurement, (2) performing measurement, and (3) evolving measurement. Planning measurement involves estab- lishing commitment at the management and project levels, defining a measurement program and integrating it into existing technical and management processes, as well as setting up organizational structures for executing the meas- urement program (i.e., resources and technologies needed to effectively implement the measurement program). Per-
- 11. Basili et al. / Bridging the Gap between Business Strategy and Software Development Twenty Eighth International Conference on Information Systems, Montreal 2007 11 forming measurement refers to collecting, analyzing, and interpreting the measurement data according to the defined measurement plan. Finally, evolving measurement applies monitoring and improvement methods to the measure- ment process itself. The capability of the established measurement program is, for example, evaluated with respect to costs and profits. Iterative control and improvement of the measurement program is supposed to keep it tailored to the changing characteristics of a particular application context, e.g., to the changing availability of information sources or to changing decision needs. Practical Example The example presented in this section is a hypothetical project, but built upon real measurement project experience over many years. GQM+ Strategies® was applied post mortem in order to better present the conceptual model. The following subsections describe the activities that were performed in order to systematically define the measurement program according to the GQM+ Strategies® method. Step 1: Select the right business goals a) The basic motivation for defining a measurement program in our example is that the market for our class of product is becoming highly competitive and there is a need to safeguard our place in the market (this can be seen as a context factor). A way to safeguard our place is to keep existing customers by generating customer loyalty. One way to do that is to improve customer satisfaction with our next product (this can be seen as an un- derlying assumption). Consequently, the business goal is to increase customer satisfaction when the next prod- uct is released. b) The business goal is then formalized according to the business goal template. Therefore, a series of questions are asked, e.g.: Q1: What is the main focus and object of your business goal? Answer: Improve customer satis- faction for the next product, “Splash”. Q2: What is the scope (environment, responsible unit or person)? An- swer: The Web Products division, the Splash manager. Q3: How would you quantify this goal? Answer: Cus- tomer satisfaction can be measured by # of customer complaints and reducing the # of customer complaints will increase loyalty (assumptions). Q4: What is the timeframe for achieving the goal? Is it a current business goal or is it planned for the future? Answer: For immediate impact, consider 12 weeks after release. Q5: Are there any constraints and/or relations to other goals? Answer: It can affect cost, schedule, etc. An overview of the an- swers is presented in Table 2 according to the business goal template. Table 2. Formalized Business Goal Activity Increase Focus Customer satisfaction Object Product “Splash” Magnitude (degree) 10% reduction in number of customer complaints Timeframe 12 weeks after release Scope (context) Web Products Division, Splash Project Manager Constraints (limitations) Splash price and functionality Relations with other goals Can conflict with development cost goals, schedule goals, … c) Criteria are identified for evaluating the achievement of the business goal. If the ratio between customer com- plaints for “Splash” and a historical baseline over the 12-week time period is less than or equal to .9, the busi- ness goal is achieved. Step 2: Select the right set of strategy decisions a) First, a list of potential strategies for achieving the business goal is identified:
- 12. Information Systems Strategy and Governance 12 Twenty Eighth International Conference on Information Systems, Montreal 2007 • S1: Build reliability in (e.g., implement fewer defects) • S2: Test reliability in (e.g., remove more defects) • S3: Increase reuse of reliable components • S4: Improve training • S5: Improve customer service • S6: Reduce price b) The most promising strategy is selected considering feasibility, cost, and benefit. Splash is already partly devel- oped so there is little control over the development process (context factor). Moreover, there is a limited budget for process improvement (context factor), and too many changes cannot be made at once (assumption). There- fore, the decision is made to “test reliability in”. This means more time will be devoted to testing the product than usual, potentially costing more and taking more time to complete. “Testing reliability in” thus may conflict with other competing goals (reduce cost, release product to market sooner). Step 3: Select the right software goals a) Next, the right software goals have to be selected by eliciting the implications of the chosen strategy with re- spect to software development. In order to test in reliability, the software test processes must be examined. It is necessary to identify potential software goals that help to fulfill the chosen strategy. b) In this example, decreasing customer reported defects can be achieved by improving system test effectiveness, unit test effectiveness, or acceptance test. c) The most promising goal is selected. In this example, improving system test effectiveness was selected because there is a new system test process that seems appropriate (context), and, if the number of defects visible to the customer can be reduced by 20%, the number of customer complaints can be reduced by 10% (assumption). d) The software goal then needs to be formalized and a goal template needs to be filled out asking the same ques- tions that were used to formalize the business goal. An overview of the answers is presented in Table 3. Table 3. Formalized Software Goal Activity Decrease Focus Customer reported software defects Object System test process for Splash Magnitude (degree) Decrease customer reported defects by 20% Timeframe 12 weeks after release (might check every week) Scope (context) Web Products Division, Splash Software and Test Manager Constraints (limitations) Development cost and functionality Relations with other goals Can conflict with development cost goals, schedule goals, … e) The last step is to identify criteria for evaluating the achievement of the software goal. The choice of the strat- egy affects the interpretation model for the business goal. For example, if the number of customer complaints is reduced by 10% or more, then we have achieved our business goal, else if the number of unique customer com- plaints due to defects is reduced by 20% the assumption may be wrong and it is necessary to check the assump- tion. It is necessary to consider that perhaps the unique customer complaints due to defects are not a major prob- lem relative to other customer complaints. It is then necessary to identify the major sources of complaints and redefine the strategy or reconsider the business goal. For the interpretation model of the software goal, the fol- lowing data to be collected have been identified: number of customer complaints and number of unique cus- tomer complaints that are due to software defects. Furthermore, for this example we need these two data items for prior projects.
- 13. Basili et al. / Bridging the Gap between Business Strategy and Software Development Twenty Eighth International Conference on Information Systems, Montreal 2007 13 Step 4: Select the right scenario templates and scenario steps a) First, a potential scenario and steps are identified. In this example, two possible scenarios were identified. Sce- nario Template A is based on historical data and consists of (A1) building a defect slippage baseline from his- torical data, and (A2) applying the new system test process and comparing the defect slippage to past projects to evaluate its impact. Template B is based on hypotheses (that is, no historical data) and consists of (B1) propos- ing explicit hypotheses about defect slippage baselines based upon available expertise, and (B2) applying the new system test process, and comparing the defect slippage to the hypotheses to evaluate its impact. b) In order to facilitate selecting the right scenario templates, questions such as the following are asked relating to the potential scenario template: Q1: Is there historical data related to my goal and interpretation? Q2: Are the projects from the historical data set relevant? Q3: Can experts estimate the appropriate baselines? c) Next, the right template and set of scenario steps for achieving the software goals are selected. In this example, it is assumed that reducing the defect slippage from the system test by 20% will reduce the customer reported defects on Splash by at least 20% (assumption). Moreover, baseline data exists on defect slippage (context) and the projects that form the baseline are relevant to the current project (assumption). Therefore, scenario template A is selected. d) The criterion for evaluating the achievement of the software goal (and linked business goal) was to consider the ratio between unique software defect-related customer complaints for “Splash” and the baseline over the 12- week time period. If this ratio is less than or equal to .8, the business goal linked to the software goal is achieved. The choice of scenario has implications for the interpretation model for the software goal. If customer reported defects are reduced by 20%, the software goal has been achieved. If defect slippage is reduced by less than 20%, the assumptions need to be checked. Are other activities generating more than the normal number of defects into system test? Are defects being introduced during acceptance test? For instance, in order to check this model, it is necessary to collect data on the number of defects that are found after system test, and a history of this data on prior projects is needed. Table 4. Formalized Measurement Goal Object System test process for Splash Purpose Evaluation Quality Focus 20% defect slippage compared to prior projects Viewpoint Test Manager Context Web Products Division Step 5: Select the right measurement goals a) First, potential measurement goals for the selected scenario steps are identified. In this case, three measurement goals are identified: (MG1) Analyze representative projects in order to characterize them (build a baseline) with respect to de- fect slippage from the point of view of the test manager of the Web Product division. (MG2) Analyze a pilot project using a new system test process in order to characterize it with respect to de- fect slippage from the point of view of the test manager of the Web Product division. (MG3) Analyze the system test process in order to evaluate it with respect to a 20% improvement in defect slippage compared to past projects from the point of view of the test manager of the Web Product division. For applying the steps of scenario template A, MG1 is assigned to scenario step A1, and MG2 and MG3 are as- signed to step A2.
- 14. Information Systems Strategy and Governance 14 Twenty Eighth International Conference on Information Systems, Montreal 2007 b) In order to formalize the measurement goal, the GQM goal template is used. An overview for measurement goal MG3 is presented in Table 4. Figure 3 displays an overview of the GQM+ Strategies® model containing the goal derivation structure as well as the context factors and assumptions mentioned to derive the conceptual model. Increase customer satisfaction Increase reuse of reliable components Build reliability in Improve system test effectiveness Business Goals Strategy Decisions Software Goals Scenario Templates and Steps Measurement Goals Estimate current slippage … Estimate defect slippage with experts Analyze available projects for defect slippage baseline Can’t make too many changes Reducing defects by 20% reduces complaints by 10% Context / Assumptions … … … … Improve training If data not available but experts available Test reliability in If data available Gather defect slippage data on current project Characterize defect slippage of baseline projects Evaluate improvement Defect Slippage Data available on past projects Analyze improvement results Characterize defect slippage of new project Satisfaction can be measured by # of complaints New system test process available then Improving product will increase customer loyalty Little control over development process Reducing defect slippage by 20% => Reducing customer visible defects by 20% Baseline projects relevant Limited budget Highly competitive market for class of products Figure 3. Overview of the example application Step 6: Derive questions and metrics using GQM c) A GQM plan containing questions and metrics has to be defined as well as criteria for evaluating the achieve- ment of the goal. For instance, for MG3, the Defect Slippage Ratio (DSR) is defined as the ratio between the quotient of faults found in system test and faults found after system test on this project and the same quotient in a historical baseline set of projects. If DSR is greater than or equal to 1.2, there is at least a 20% improvement. If DSR is greater than or equal to 1, but less than 1.2, the method is better than history but not good enough. After defining the measurement goals, and plans for implementing the goals, the “Splash” Software Manager must go back to the Web Products Manager and ask for resources for process definition, data collection, and analysis. To justify this request, the “Splash” Software Manager can point to a clear link between the resources needed and the related business goal. The “Splash” Software Manager now has a clear plan of activities (the scenario), how the resulting information needs to be passed back up the line (the strategy), and who is inter- ested. The Web Products Manager, in turn, gets the information needed to show how customer satisfaction (the original success goal) is addressed, and whether it is effective or not. Applying the Model Defined Finally, an overview of the interpretation models is provided to help decide whether the overall business goal was achieved and to analyze some sample outputs of our example measurement program. Table 5 presents some sample data for two potential outcomes for the decision criteria defined in the interpretation models. As is evident in the table, the business goal was finally achieved for Outcome 2. For Outcome 1, none of the defined decision criteria was met; that is, it seems that the original strategy of “testing reliability in” is not promising. The question is whether there are differences between the current and baseline products that might explain the results and whether there are other changes that can be made to the process that may yield better results in the future.
- 15. Basili et al. / Bridging the Gap between Business Strategy and Software Development Twenty Eighth International Conference on Information Systems, Montreal 2007 15 The GQM+ Strategies® model provides guidance not just for planning, but also for analyzing and rolling up the re- sulting data to the decision makers and helps to make the right decisions for achieving the designated business goal and evaluating the implementation strategy. Table 5. Example Data Table Goal Decision Criteria Result Interpretation Business Goal: 10% improve- ment in customer complaints Customer Complaints Ratio <= 0.9 Outcome 1: 0.94 Outcome 2: 0.83 Outcome 1: Not Achieved Outcome 2: Achieved Business Goal linked with Soft- ware Goal: 20% improvement in unique customer complaints re- lated to SW defects Software Defect Related to Customer Complaints <= 0.8 Outcome 1: 1.40 Outcome 2: 0.67 Outcome 1: Not Achieved Outcome 2: Achieved Software Goal: 20% improve- ment in defect slippage Defect Slippage Ratio >= 1.2 Outcome 1: 0.83 Outcome 2: 1.49 Outcome 1: Not Achieved Outcome 2: Achieved Summary and Further Work In this paper, the GQM+ Strategies® approach, which extends the successful GQM approach, was presented. In recent decades, GQM has proved to be a natural and pragmatic way of creating a measurement program based on software goals, questions, models generated by these goals, and the metrics that are needed to answer the questions. GQM+ Strategies® inherits GQM’s benefit of assuring that the metrics set is as small as possible and that the data collected address the defined organizational objectives. However, it extends GQM by providing explicit support for linking software measurement goals to organizational business objectives. Considering this linkage is essential for organizational success, as it helps to translate strategic-level objectives into a set of operational software goals and respective quantitative project management. On the other hand, it helps to justify software measurement efforts and allows measurement data to contribute to higher-level decisions. GQM+ Strategies® provides a systematic way to deal with relationships between different objectives at various organizational levels. Early identification of conflict- ing objectives, for instance, may prevent failures very early, namely, at the time of defining the organizational strat- egy. Moreover, a transparent and intuitive way of specifying and synchronizing objectives at various operational levels contributes to better understanding of a business and to improved communication between different organiza- tional levels. In order to validate the practical usefulness of the GQM+ Strategies® method, it was applied to several projects retro- actively. It has, however, not yet been applied end-to-end to build a comprehensive measurement program that in- cludes the business objectives as well as the software objectives. Currently, support tools are under development to take advantage of actual experiences as well as the extensive expertise in the domain of goal-oriented measurement gathered over the years by the Fraunhofer organizations. We are in the process of building a multiple domain ex- perience base that incorporates common business goals, strategies, scenarios, etc., and their linkages, so that soft- ware organizations would be able to navigate through better the space of options and adapt it to their specific appli- cation context. The experience base is designed to support organizations in developing their own measurement pro- grams, and in tracking and improving them over time. Acknowledgements We would like to thank Sonnhild Namingha from Fraunhofer IESE for reviewing a first version of the article. References Basili V. and Weiss D. “A Methodology for Collecting Valid Software Engineering Data,” IEEE Transactions on Software Engineering, vol.10 (3): 728-738, November 1984.
- 16. Information Systems Strategy and Governance 16 Twenty Eighth International Conference on Information Systems, Montreal 2007 Basili, V. “Software Development: A Paradigm for the Future”, Proceedings of the 13th Annual International Com- puter Software and Applications Conference, Orlando, Florida, pp. 471-485, September 1989. Basili, V., Caldiera, G., and Rombach D. “Goal, Question Metric Paradigm”, Encyclopedia of Software Engineer- ing, vol. 1, John Wiley and Sons, 1994a. Basili, V., Caldiera, G., and Rombach D. “The Experience Factory,” in Encyclopedia of Software Engineering, Mar- ciniak, E. (Ed.), vol. 1, John Wiley & Sons, 1994b, pp. 469-476. Becker, S.A. and Bostelman, M.L. “Aligning Strategic and Project Measurement Systems”, IEEE Software, May/June 1999, pp. 46-51. Bianchi, A.J. “Management Indicators Model to Evaluate Performance of IT Organizations”, Proceedings of the International Conference on Management of Engineering and Technology, Portland, vol. 2, pp. 217-299, 2001. Buglione L. and Abran A. “Balanced Scorecards and GQM: What are the Differences?” Proceedings of FESMA- AEMES Software Measurement Conference, October 2000. Card, D. “Integrating Practical Software Measurement and the Balanced Scorecard”, Proceedings of the 27th Annual International Computer Software and Applications Conference, 2003. Chrissis, M., Konrad, M., and Shrum, S. CMMI® Guidelines for Process Integration and Product Development, Ad- dison-Wesley, 2007 ISACA, Control Objectives for Information and related Technology (COBIT®), retrieved 04/12/2007, from www.isaca.org Kaplan, R. and Norton, D. "The Balanced Scorecard--Measures That Drive Performance", Harvard Business Re- view, January-February 1992, p. 71. Offen, R.J. and Jefferey, R. “Establishing Software Measurement Programs“, IEEE Software, Mar/Apr 1997. Office of Government Commerce (OGC), The IT Infrastructure Library (ITIL) Service Delivery, The Stationary Office London, 2002 US Department of Defense and US Army (DoD), Practical Software and Systems Measurement: A Foundation for Objective Project Management, v. 4.0c, March 2003, from www.psmsc.com Weiss, S.M. and Indurkhya, N. Predictive Data Mining. A Practical guide. Morgan Kaufmann, August 1997.