SGS 2015 Full Year Results
•
0 j'aime•2,961 vues

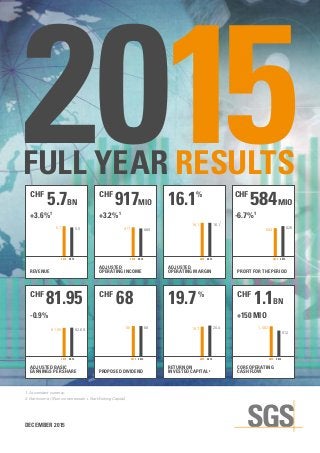
At a glance: Revenue of CHF 5.7 billion, up 3.6% Adjusted operating income of CHF 917 million, up 3.4% Stable margin of 16.1% You can view our financial reports here: http://www.sgs.com/en/Our-Company/Investor-Relations/Financial-Reports.aspx

Recommandé
Recommandé
Contenu connexe
Plus de SGS
Plus de SGS (20)
Dernier
Dernier (20)
SGS 2015 Full Year Results
- 1. DECEMBER 2015 2015FULL YEAR RESULTS 1. At constant currency. 2. Net Income / (Non current assets + Net Working Capital). REVENUE CHF 5.7BN +3.6% 1 ADJUSTED OPERATING INCOME CHF 917MIO +3.2% 1 ADJUSTED OPERATING MARGIN 16.1% 16.1 20142015 16.1 1 917 20142015 889 5.7 20142015 5.5 CORE OPERATING CASH FLOW CHF 1.1BN +150 MIO 1,062 20142015 912 PROFIT FOR THE PERIOD CHF 584MIO -6.7% 1 584 20142015 626 ADJUSTED BASIC EARNINGS PER SHARE CHF 81.95 -0.9% PROPOSED DIVIDEND CHF 68 RETURN ON INVESTED CAPITAL 2 19.7 % 81.95 20142015 82.69 68 20142015 68 19.7 20142015 20.4
- 2. 2
- 3. 3 FINANCIAL HIGHLIGHTS (CHF million) 2015 2014 PRO-FORMA 2 2014 REVENUE Change in % 5 712 5 512 3.6 5 883 (2.9) ADJUSTED EBITDA 1 Change in % 1 191 1 152 3.4 1 226 (2.9) ADJUSTED OPERATING INCOME 1 Change in % 917 889 3.2 947 (3.2) ADJUSTED OPERATING MARGIN IN % 1 16.1 16.1 16.1 OPERATING INCOME (EBIT) Change in % 822 885 (7.1) 941 (12.6) PROFIT FOR THE PERIOD Change in % 584 626 (6.7) 666 (12.3) PROFIT ATTRIBUTABLE TO EQUITY HOLDERS OF SGS SA Change in % 549 590 (6.9) 629 (12.7) ADJUSTED PROFIT ATTRIBUTABLE TO EQUITY HOLDERS OF SGS SA 1 Change in % 625 593 5.4 634 (1.4) BASIC EPS (CHF) 71.99 76.87 81.99 ADJUSTED BASIC EPS (CHF) 81.95 77.31 82.69 DILUTED EPS (CHF) 71.95 76.55 81.65 CORE OPERATING CASH FLOW 1 062 868 912 FREE CASH FLOW 3 658 577 607 RETURN ON INVESTED CAPITAL 19.7 20.1 20.4 (NET DEBT)/NET CASH (482) (340) WEIGHTED AVERAGE NUMBER OF SHARES (‘000) 7 626 7 671 AVERAGE NUMBER OF EMPLOYEES 85 903 83 515 1. Before amortisation of acquisition intangibles, restructuring, transaction and integration-related costs, and other non-recurring items. 2. Constant currency basis. 3. Operating Cash Flow less Capital Expenditures.
- 4. 4 SGS DEMONSTRATES RESILIENCE The SGS Group performed well in 2015 with total revenues reaching CHF 5.7 billion. This represents revenue growth of 3.6% (constant currency basis), of which 2.0% was organic and 1.6% was contributed by recent acquisitions. Trading conditions remained difficult during the year with the fall in commodity prices, primarily impacting Oil, Gas & Chemicals, Minerals and Industrial Services. Group revenue declined 2.9% in comparison with the reported figures for December 2014 due to the strengthening of the Swiss Franc against the majority of other currencies. Achieving growth during this challenging year underlines the strength of the Group’s strategy and the depth and balance of its portfolio. Organic revenue growth was most apparent in Governments and Institutions Services (12.0%) predominantly in Product Conformity Assessments experiencing impressive double-digit growth. Automotive Services saw 8.5% organic growth resulting from the expansion of Vehicle Inspection Services. Systems and Services Certification delivered 7.2% organic growth from high adoption of new 2015 standards and good performance in food activities. Solid results were also seen in Life Science Services at 6.4%, Environmental Services at 5.2% and Consumer Testing Services at 4.9% organic growth. The restructuring programme that the Group announced in the first semester to align operations with current market conditions is proceeding as planned. This measure resulted in one-off expenses amounting to CHF 64 million (CHF 47 million net of taxes). Adjusted EBITDA reached CHF 1,191 million, up 3.4% at constant currency versus prior year. Adjusted operating income was CHF 917 million resulting in a stable margin versus prior year at 16.1%. Net financial expenses for the year increased to CHF 43 million. The overall effective tax rate for the period was 25%, slightly below prior year. Profit for the period reached CHF 584 million, down 6.7% at constant currency versus prior year, mainly due to the one-off effect of the restructuring expenses of CHF 64 million in 2015 and the one-off benefit in 2014 resulting from the settlement of a long standing dispute with the Republic of Paraguay amounting to CHF 32 million. Operating cash flow improved significantly over the year. For the first time in the history of SGS, the core operating cash flow exceeded CHF 1 billion. The Group invested in acquisitions during the year for a total cash consideration of CHF 103 million. It also paid a dividend of CHF 522 million, leading to a Group net debt position as at 31st of December 2015 of CHF 482 million compared to CHF 340 million in December 2014. ORGANIC REVENUE GROWTH: GOVERNMENT AND INSTITUTIONS SERVICES 12.0% CORE OPERATING CASH FLOW CHF 1.1BN ACQUISITIONS COMPLETED IN 2015 10 REDUCTION IN NET WORKING CAPITAL CHF 160MIO
- 5. 5 Sergio Marchionne Chairman of the Board Frankie Ng Chief Executive Officer ACQUISITIONS The Group initiated 14 acquisitions in 2015 of which 10 were completed. These acquisitions further expand the Group’s footprint into new markets and create a more diverse service offering. Combined, these companies add CHF 45 million to the Group’s revenue and CHF 9 million to the operating income in 2015. Examples of this year’s acquisitions include: SVA Ltd, a UK-based leading independent provider of extensive advisory services in the food testing space, the Chile-based SIGA Ingeniería y Consultoría S.A., a leading project management, technical inspection and engineering consulting company and Quality Compliance Laboratories Inc. in Canada, a provider of analytical testing to the pharmaceutical, nutrition and cosmetic industries. The Group has also begun to complement its traditional approach to acquisitions by finding opportunities to take smaller equity stakes in certain strategic technology companies to form partnerships. An example of this is the recent partnership with SAVI, the US-based sensor technology company in which SGS now holds a 17.65% stake. DISTRIBUTION TO SHAREHOLDERS The SGS Board of Directors will recommend to the Annual General Meeting, to be held on 14 March 2016, the approval of a dividend of CHF 68 per share, unchanged from the prior year. MANAGEMENT The Board would like to take this opportunity to thank former CEO Christopher Kirk for his commitment and leadership during his time at SGS. Mr Kirk, who left his position as CEO in March 2015 after ten successful years at the helm of the Group, was replaced by Frankie Ng who has been with the Group since 1994 and most recently led the Industrial Services and Consumer Testing businesses. In the course of 2015, Michael Belton, EVP Minerals Services, resigned from his position. Ladislav Papik, COO South East Europe left the Operations Council to assume a regional role within the Group. Anthony Hall, COO South East Asia Pacific stepped down from the Operations Council to take the global leadership of the Innovation initiative for the Group. The Nomination and Remuneration Committee approved the internal promotion and appointment at the Operations Council of Derick Govender as EVP Minerals Services, Richard Shentu as EVP Consumer Testing Services and Kimmo Fuller as COO North America. SIGNIFICANT SHAREHOLDERS As at 31 December 2015, Mr. August von Finck and members of his family acting in concert held 15.03%, Groupe Bruxelles Lambert acting through Serena SàRL held 15.00%, the Bank of New York Mellon Corporation held 3.35%, BlackRock Inc. held 3.03% and MFS Investment Management held 3.01% of the share capital and voting rights of the Company. At the same date, SGS Group held 2.77% of the share capital of the Company. OUTLOOK In response to a constantly changing global marketplace and new demand patterns from our existing customer base, SGS is evolving both structurally and technically. The organisational realignment that was announced last fall will not only underpin our ability to service clients following the emergence of new product categories (such as pharma-nutritional products), but it will also help us to broaden our services, pool expertise and create synergies across business lines to drive innovation. Another important development in the Group will be the work we are beginning to do in the exciting and rapidly changing fields of e-commerce and data analytics. In decisively embracing the increasing digitalisation of global supply chains with our strategic Testing Inspection and Certification (TIC) 4.0 initiative, we can take advantage of a number of new business opportunities. GUIDANCE 2016 The Group expects to deliver an organic revenue growth in the range of 2.5% to 3.5%, with stable margins compared to prior year and solid cash flow generation. 20 January 2016
- 6. 6 AGRICULTURAL SERVICES MINERALS SERVICES 1. Before amortisation of acquisition intangibles, restructuring, transaction and integration-related costs, and other non-recurring items. 2. Constant currency basis. 1. Before amortisation of acquisition intangibles, restructuring, transaction and integration-related costs, and other non-recurring items. 2. Constant currency basis. (CHF million) 2015 2014 PRO-FORMA 2 2014 REVENUE 367.6 353.6 387.1 Change in % 4.0 (5.0) ADJUSTED OPERATING INCOME 1 63.7 57.3 63.8 Change in % 11.2 (0.2) MARGIN % 1 17.3 16.2 16.5 (CHF million) 2015 2014 PRO-FORMA 2 2014 REVENUE 632.8 644.2 702.7 Change in % (1.8) (9.9) ADJUSTED OPERATING INCOME 1 89.6 88.6 98.8 Change in % 1.1 (9.3) MARGIN % 1 14.2 13.8 14.1 Agricultural Services maintained organic revenue growth of 4.0% to CHF 368 million for the year, despite the fishing ban in Peru and the full year impact of the curtailment in collateral management activities, without which organic growth would have been 6.6%. Both Seed & Crop and Laboratory services delivered strong growth, supported by recent investments across the network. Trade and related activities delivered moderate growth. In the second half of the year, growth increased in line with traditional seasonality of the business in greater Europe and the Americas, while operations in South East Asia Pacific were hampered by low agricultural export volumes. Minerals Services delivered revenue of CHF 633 million, down 1.8% versus prior year. This was mainly attributable to reduced exploration funding in the mining sector, which resulted in flat sample volumes at commercial facilities in most regions and also impacted metallurgical testing programmes. The onsite laboratories continued to perform solidly with four new sites commencing operation in 2015 and four new contract wins that will come into operation during 2016. Energy Minerals performed well, mainly in Russia, South Africa and China, but this was partially offset by the market contraction in the USA, Australia and Indonesia. Trade services for fertilizer and non-ferrous activities continued to perform well, while steel and raw materials volumes were impacted by a reduction in demand for iron ore and associated steel products. The adjusted operating margin improved to 17.3% from 16.2% in prior year (constant currency basis) driven by the high trade volumes in Europe and profit improvement initiatives in North America launched in late 2014, which are already delivering results. Seed & Crop investments in the Southern hemisphere have come on-line in the second semester and are expected to gain traction in 2016. Considerable efforts have also been made to realign the business organisation with the recently announced Group strategy. Despite the downturn in the market, Minerals business in Chile was successful in securing key contracts from the major global copper producers which will drive performance in 2016. The Minerals service portfolio in 2015 included the new hyperspectral scanning services which have already experienced some success in the North American market and there are opportunities to further grow this using the SGS global footprint. The adjusted operating margin for the period increased to 14.2% from 13.8% in prior year (constant currency basis). Efforts to improve cost alignment and efficiency initiatives, including further network consolidation in the USA and Australia, helped to offset strong pricing pressure. During the year, the Group initiated the acquisition of Bateman Projects, specialists in process plant design and site engineering services. This is expected to be concluded in early 2016 and will be integrated into the SGS site services portfolio, further strengthening the Group’s position as the leading one-stop-shop service provider.
- 7. 7 OIL, GAS & CHEMICALS SERVICES LIFE SCIENCE SERVICES 1. Before amortisation of acquisition intangibles, restructuring, transaction and integration-related costs, and other non-recurring items. 2. Constant currency basis. 1. Before amortisation of acquisition intangibles, restructuring, transaction and integration-related costs, and other non-recurring items. 2. Constant currency basis. (CHF million) 2015 2014 PRO-FORMA 2 2014 REVENUE 1 119.5 1 144.3 1 201.0 Change in % (2.2) (6.8) ADJUSTED OPERATING INCOME 1 129.2 132.7 144.5 Change in % (2.6) (10.6) MARGIN % 1 11.5 11.6 12.0 (CHF million) 2015 2014 PRO-FORMA 2 2014 REVENUE 211.2 197.8 212.7 Change in % 6.8 (0.7) ADJUSTED OPERATING INCOME 1 22.8 18.0 19.9 Change in % 26.7 14.6 MARGIN % 1 10.8 9.1 9.4 Oil, Gas & Chemicals Services organic revenue declined by 2.2% to CHF 1,119 million for the period, primarily impacted by the double-digit decline in Upstream services. This was partially offset by growth in Trade-related services and Plant and Terminal Operations. Falling oil prices continued to cripple exploration affecting Well-side services and Subsurface Consultancy. To minimise the impact, efforts were made to re-allocate resources towards the more resilient Production segment which achieved solid wins in Eastern Europe, Middle East and North Africa. During the first three quarters of the year, Trade-related services experienced strong growth in Russia and the Middle East due to high volatility in the market. However, activity slowed down in the last quarter, particularly in the Americas and in some parts of Asia due to a deficit in storage capacity compounded by flat demand in Europe. Life Science Services delivered revenue growth of 6.8% (of which 6.4% organic) to CHF 211 million for the period, with strong performance in Laboratory services. Laboratory services delivered double-digit growth driven by strong performance in North America, Asia and Europe. Clinical Research in Antwerp experienced a slow start to the year due to projects postponed by clients. This impact was partially offset by strong performance in Biometry. In addition, new initiatives have been implemented to increase presence in North America and Europe. The adjusted operating margin for the period increased to 10.8% from 9.1% in prior year (constant currency basis) driven by strong results in laboratory testing which was partially offset by the slow start in Clinical Research. The business continued its drive towards operational excellence with a strong focus on quality and cost efficiency. Plant and Terminal Operations started the year with low double-digit growth but slowed to flat growth by the end of the year, particularly in North America. The Oil Condition Monitoring segment continued to see mid double- digit growth with operating margin improvement due to better utilisation of the laboratories. The Non-Inspection Related Testing/ Laboratory Outsourcing segment grew in high single-digits over the year improving margin in the testing business, while experiencing a drop in laboratory commissioning projects. The adjusted operating margin for the period declined from 11.6% in prior year to 11.5% (constant currency basis), mainly due to the contraction in high-margin Upstream services. Oil, Gas & Chemicals continues to reconfigure its business mix to align with evolving market conditions. During the year, the Group completed the acquisition of Quality Compliance Laboratories Inc. in Canada, a provider of analytical testing to the pharmaceutical, nutrition and cosmetic industries. Several investments were also initiated including a new quality control laboratory in France and significant expansion of capabilities in India. The business continues to optimise the laboratory network which is expected to improve performance in 2016 with a focus on the UK and the USA. Operational excellence, quality improvement and customer focus remain the Group’s key objectives to drive business growth.
- 8. 8 CONSUMER TESTING SERVICES SYSTEMS & SERVICES CERTIFICATION Consumer Testing Services delivered revenue growth of 6.3% (of which 4.9% organic) to CHF 1,133 million for the period with strong growth in Western Europe, the Americas, Eastern Europe & Middle East and East Asia. Food Testing activities achieved double- digit growth fueled by increased food safety concerns in Asia and the recent acquisition of SVA Ltd in the UK. Automotive Parts testing continued to exceed expectations with a strong contribution from operations in Germany, China and India. Electrical and Electronics experienced stable growth, benefiting from solid results in Restricted Substances Testing and Electromagnetic Compatibility and Safety Testing, despite delays in some Wireless and Mobile Testing projects. The Cosmetics, Personal Care & Household segment remained strong throughout the year, especially in Germany and China. Systems & Services Certification delivered solid organic revenue growth of 7.2% to CHF 419 million for the period with all regions reporting growth. Management System Certification delivered strong growth driven by high adoption of the new 2015 standards and good performance in food activities. Training activities achieved double-digit growth boosted by solid demand from our clients for the new ISO 9001:2015 standard training. The adjusted operating margin for the period decreased from 18.1% in prior year (constant currency basis) to 16.9%, mainly impacted by margin erosion in some regions. In particular, China continues to be impacted by high labour costs, East Asia by strong competition and Western Europe by Despite strong growth in new sourcing countries, Softlines faced difficult market conditions as retail industry and brand owners continue to consolidate their supply chains. The performance of Hardlines remained stable thanks to new inspection and testing programmes with e-retailers. The adjusted operating margin for the period decreased from 25.2% in prior year (constant currency basis) to 23.8% as a result of difficult market conditions for Softlines and Toys testing, as well as a change in the portfolio mix. During 2015, the Group acquired SVA Ltd, a leading UK-based independent provider of advisory, testing and IT services to retailers and food manufacturers. This acquisition adds new testing capabilities and expands the Group’s geographical footprint. additional personnel cost mainly related to strengthening of the medical device team in the UK. Going forward, growth is expected to remain healthy driven by Training, as well as recent contract wins in Hospitality, Automotive and Hart Aviation and further transition to the new ISO 9001:2015 standard. New product launches in industry sectors will start to feed the product mix supporting the future growth. 1. Before amortisation of acquisition intangibles, restructuring, transaction and integration-related costs, and other non-recurring items. 2. Constant currency basis. 1. Before amortisation of acquisition intangibles, restructuring, transaction and integration-related costs, and other non-recurring items. 2. Constant currency basis. (CHF million) 2015 2014 PRO-FORMA 2 2014 REVENUE 1 132.9 1 066.0 1 093.1 Change in % 6.3 3.6 ADJUSTED OPERATING INCOME 1 269.9 268.7 269.7 Change in % 0.4 0.1 MARGIN % 1 23.8 25.2 24.7 (CHF million) 2015 2014 PRO-FORMA 2 2014 REVENUE 419.0 390.9 414.6 Change in % 7.2 1.1 ADJUSTED OPERATING INCOME 1 71.0 70.7 73.9 Change in % 0.4 (3.9) MARGIN % 1 16.9 18.1 17.8
- 9. 9 INDUSTRIAL SERVICES ENVIRONMENTAL SERVICES Industrial services reported a decline in revenue of 0.6%, with an organic decline of 3.0%, largely offset by acquisitive growth of 2.4%, to CHF 884 million for the year. Organic growth was heavily impacted by the declining oil and gas prices on activities in North America, South East Asia Pacific and to a lesser extent in Africa. North America reported reduced supply chain inspections and asset integrity services in the USA and lower volumes in geotechnical services in the Canadian Oil Sands. Australia, Singapore and Malaysia were impacted by lower volumes and pricing due to reduced investments in the Mining and Energy sector. Despite difficult market conditions in Brazil and Colombia, South America posted stable revenue through the development of new activities in Argentina and expanding its reach into new markets such as maintenance- related activities. China reported double-digit growth driven by the continued increase in volume in testing activities. Globally, the implementation of key account management helped the business to secure new accounts which are expected to drive revenue growth. Environmental Services delivered robust revenue growth of 16.9% (of which 5.2% organic) to CHF 367 million for the year, by increasing market share. Strong performance in Europe was driven by the optimisation of the laboratory network and cost control measures. In South America, the business successfully developed a strong market position through increased field and testing services, with the exception of Brazil which is experiencing an economic slowdown, partially offset by the synergies from acquisitions made in the first semester. China delivered top and bottom line improvements due to the development of key product lines in addition to restructuring in the first half of the year. The market in Australia continues to face strong pricing pressure in the mining sector. The adjusted operating income margin for the year decreased from 12.8% in prior year (constant currency basis) to 11.3%, impacted by margin erosion related to the difficult market conditions in North America, South East Asia Pacific and Africa. Other regions performed in-line with prior year. During the year, the Group acquired Le Brigand in France, specialised in non-destructive testing for the aviation industry. The Group also acquired a majority stake in SIGA in Chile, an engineering consulting company; initiated a majority stake in FirstRank, specialised in quality and safety assurance and Safety-Tech, specialised in valve maintenance, repair and overhaul services, both in China. The acquisition of Matrolab Group in South Africa, specialising in engineering and construction materials testing, is being concluded. A minority stake was acquired in SAVI Technology, Inc. in the USA, a leader in sensor-based solutions. Industrial Hygiene services continued to expand globally, supported by a strengthened international sales and key account management structure. The adjusted operating margin for the period increased to 12.8% from 10.0% in prior year (constant currency basis), benefiting from an efficiency drive across the entire network and successful cost control measures. During the year, the Group acquired Western Radiation Services Pty Ltd and Radiation Safety Services Pty Ltd in Australia; and AirServices Estudos e Avaliaçôes Ambientais Ltda and Cronolab Referência em Análises Químicas e Ambientais Ltda in Brazil. 1. Before amortisation of acquisition intangibles, restructuring, transaction and integration-related costs, and other non-recurring items. 2. Constant currency basis. 1. Before amortisation of acquisition intangibles, restructuring, transaction and integration-related costs, and other non-recurring items. 2. Constant currency basis. (CHF million) 2015 2014 PRO-FORMA 2 2014 REVENUE 884.3 889.7 977.0 Change in % (0.6) (9.5) ADJUSTED OPERATING INCOME 1 100.0 113.8 122.6 Change in % (12.1) (18.4) MARGIN % 1 11.3 12.8 12.5 (CHF million) 2015 2014 PRO-FORMA 2 2014 REVENUE 367.1 314.1 342.4 Change in % 16.9 7.2 ADJUSTED OPERATING INCOME 1 46.9 31.3 34.3 Change in % 49.8 36.7 MARGIN % 1 12.8 10.0 10.0
- 10. 10 AUTOMOTIVE SERVICES GOVERNMENTS & INSTITUTIONS SERVICES Automotive Services delivered strong growth of 13.8% (of which 8.5% organic) to CHF 318 million for the period with solid results from all activities. The statutory inspection business strengthened in the Americas, Europe and Africa, with particularly solid growth in Homologation and Vehicle Inspection services. Commercial inspection activities and Testing services also delivered solid results, supported by growth from recent acquisitions and increased inspection volumes in the USA and Europe. Several long-term contracts were awarded to SGS during the year. In Africa, an exclusive motor vehicle inspection programme was secured with the Ministry of Works & Transport in Uganda and an existing motor vehicle inspection concession was extended in Ivory Coast. In the USA, an amendment was signed with the State of California to extend the next generation electronic transmission data management service Governments & Institutions Services delivered solid organic growth of 12.0% to CHF 260 million for the year, led by strong contract volumes in Product Conformity Assessments (PCA) and Single Window solutions. PCA achieved double-digit growth in Asia, Europe and the Middle East, along with three new mandates signed in Africa. Single Window solutions delivered excellent performance in Ghana and Mozambique thanks to high import volumes, as well as the successful launch of new consulting services in Nepal. The new valuation solution, “SGS E-Valuator™”, was also launched, replacing the traditional Pre-Shipment Inspection in Benin and thus complying with the recent recommendations of the World Customs Organisation and World Trade Organisation. A new national Timber Legality and Traceability solution was deployed in the Republic of Congo and TransitNet gained new markets in Europe. contract for the California Smog Check programme. In Argentina, SGS was awarded a contract for the design, build and management of vehicle inspection stations in Buenos Aires. The adjusted operating margin for the period decreased from 20.0% in prior year (constant currency basis) to 19.5%, impacted by the liberalisation of the statutory inspection market in Spain, investments in the development of testing activities and start-up costs for the motor vehicle programme in Uganda. During the period, the Group acquired two operations: Testing Services Group LLC, a leading provider of fuel testing systems in North America and DLH-VIS, a specialist in vehicle inspection services in Lyon, France. These acquisitions enable the Group to diversify and expand its global footprint. The adjusted operating margin for the period increased to 24.0% from 22.3% in prior year (constant currency basis), as a result of the new service mix and economies of scale, despite higher royalties incurred on renewed PCA programmes. During the year, improved cost control measures allowed the business to invest more in innovation. The continued introduction of new solutions is opening into new markets supporting the business diversification strategy. 1. Before amortisation of acquisition intangibles, restructuring, transaction and integration-related costs, and other non-recurring items. 2. Constant currency basis. 1. Before amortisation of acquisition intangibles, restructuring, transaction and integration-related costs, and other non-recurring items. 2. Constant currency basis. (CHF million) 2015 2014 PRO-FORMA 2 2014 REVENUE 317.5 279.1 302.8 Change in % 13.8 4.9 ADJUSTED OPERATING INCOME 1 61.8 55.9 62.0 Change in % 10.6 (0.3) MARGIN % 1 19.5 20.0 20.5 (CHF million) 2015 2014 PRO-FORMA 2 2014 REVENUE 260.0 232.1 249.5 Change in % 12.0 4.2 ADJUSTED OPERATING INCOME 1 62.3 51.8 57.9 Change in % 20.3 7.6 MARGIN % 1 24.0 22.3 23.2
- 11. 11 CONDENSED CONSOLIDATED FINANCIAL STATEMENTS FOR THE PERIOD ENDED 31 DECEMBER 2015 (CHF million) NOTES 2015 2014 REVENUE 5 712 5 883 Salaries, wages and subcontractors’ expenses (3 194) (3 252) Depreciation, amortisation and impairment (322) (304) Other operating expenses (1 374) (1 386) OPERATING INCOME (EBIT) 822 941 Analysis of Operating income Adjusted operating income 917 947 Restructuring costs (64) (11) Amortisation of acquisition intangibles (21) (20) Transaction and integration-related costs (10) (7) Other non-recurring items - 32 Operating income 822 941 Net financial expenses (43) (41) PROFIT BEFORE TAXES 779 900 Taxes (195) (234) PROFIT FOR THE PERIOD 584 666 Profit attributable to: Equity holders of SGS SA 549 629 Non-controlling interests 35 37 BASIC EARNINGS PER SHARE (IN CHF) 4 71.99 81.99 DILUTED BASIC EARNINGS PER SHARE (IN CHF) 4 71.95 81.65 CONDENSED CONSOLIDATED INCOME STATEMENT
- 12. 12 CONDENSED CONSOLIDATED BALANCE SHEET (CHF million) 2015 2014 NON-CURRENT ASSETS Land, buildings and equipment 964 1 043 Goodwill and other intangible assets 1 306 1 337 Other non-current assets 347 268 TOTAL NON-CURRENT ASSETS 2 617 2 648 CURRENT ASSETS Trade accounts and notes receivable 917 1 068 Other current assets 626 701 Cash and marketable securities 1 734 1 350 TOTAL CURRENT ASSETS 3 277 3 119 TOTAL ASSETS 5 894 5 767 TOTAL EQUITY 1 981 2 403 NON-CURRENT LIABILITIES Loans and obligations under financial leases 2 214 1 672 Provisions and other non-current liabilities 338 347 TOTAL NON-CURRENT LIABILITIES 2 552 2 019 CURRENT LIABILITIES Trade and other payables 526 511 Other liabilities 835 834 TOTAL CURRENT LIABILITIES 1 361 1 345 TOTAL LIABILITIES 3 913 3 364 TOTAL EQUITY AND LIABILITIES 5 894 5 767 CONDENSED CONSOLIDATED STATEMENT OF COMPREHENSIVE INCOME (CHF million) 2015 2014 Actuarial gains/(losses) on defined benefit plans (40) (100) Income tax on actuarial gains/(losses) taken directly to equity 9 26 Items that will not be subsequently reclassified to income statement (31) (74) Exchange differences and other (254) 82 Items that may be subsequently reclassified to income statement (254) 82 OTHER COMPREHENSIVE INCOME/(LOSS) FOR THE PERIOD (285) 8 Profit for the period 584 666 TOTAL COMPREHENSIVE INCOME FOR THE PERIOD 299 674 Attributable to: Equity holders of SGS SA 266 643 Non-controlling interests 33 31
- 13. 13 CONDENSED CONSOLIDATED CASH FLOW STATEMENT CONDENSED CONSOLIDATED STATEMENT OF CHANGES IN EQUITY (CHF million) 2015 2014 Profit for the Period 584 666 Non-cash items 541 559 Decrease/(Increase) in net working capital 160 (109) Taxes paid (223) (204) CORE OPERATING CASH FLOW 1 062 912 Pension funds special contribution (103) - CASH FLOW FROM OPERATING ACTIVITIES 959 912 Net (purchase) of fixed assets (286) (292) Net (acquisition) of businesses (104) (114) Investments in marketable securities and other (235) 6 CASH FLOW FROM INVESTING ACTIVITIES (625) (400) Dividend paid to equity holders of SGS SA (522) (499) Dividend paid to non-controlling interests (34) (24) Transactions with non-controlling interests (2) 1 Net cash (paid)/received on treasury shares (147) 31 Proceeds of corporate bonds 549 362 Interest paid (55) (43) Net flows on interest rate swaps 16 2 (Decrease)/Increase in borrowings (15) 2 CASH FLOW FROM FINANCING ACTIVITIES (210) (168) Currency translation 25 33 INCREASE IN CASH AND CASH EQUIVALENTS 149 377 ATTRIBUTABLE TO (CHF million) EQUITY HOLDERS OF SGS SA NON-CONTROLLING INTERESTS TOTAL EQUITY BALANCE AS AT 1 JANUARY 2014 2 143 69 2 212 Total comprehensive income for the period 643 31 674 Dividends paid (499) (24) (523) Share-based payments 10 - 10 Movement in non-controlling interests (1) - (1) Movement on treasury shares 31 - 31 BALANCE AS AT 31 DECEMBER 2014 2 327 76 2 403 Total comprehensive income for the period 266 33 299 Dividends paid (522) (34) (556) Share-based payments 9 - 9 Movement in non-controlling interests (1) - (1) Deferred tax on pension funds special contribution (24) - (24) Movement on treasury shares (149) - (149) BALANCE AS AT 31 DECEMBER 2015 1 906 75 1 981
- 14. 14 1. BASIS OF PREPARATION These condensed consolidated financial statements have been prepared in accordance with the measurement and recognition criteria of International Financial Reporting Standards (IFRS). 2. SIGNIFICANT ACCOUNTING POLICIES The condensed financial statements have been prepared in accordance with the accounting policies applied by the Group in its consolidated financial statements for the year ended 31 December 2014, except for the Group’s adoption of new amendments effective 1 January 2015. These amendments had no significant impact on the Group consolidated financial statements. 3. ACQUISITIONS In 2015, the Group acquired 100% of SVA Ltd and 70% of SIGA Ingeniería y Consultoría S.A. for the purchase prices of CHF 39 million and CHF 43 million respectively. The Group completed a further eight acquisitions during the year with a combined purchase price of CHF 46 million. NOTES TO THE CONDENSED CONSOLIDATED FINANCIAL STATEMENTS 4. EARNINGS PER SHARE 2015 2014 Profit attributable to equity holders of SGS SA (CHF million) 549 629 Weighted average number of shares (‘000) 7 626 7 671 BASIC EARNINGS PER SHARE (CHF) 71.99 81.99 Profit attributable to equity holders of SGS SA (CHF million) 549 629 Diluted weighted average number of shares (‘000) 7 630 7 702 DILUTED BASIC EARNINGS PER SHARE (CHF) 71.95 81.65 BALANCE SHEET END OF PERIOD RATES INCOME STATEMENT AVERAGE RATES 2015 2014 2015 2014 Australia AUD 100 72.24 80.59 72.44 82.49 Brazil BRL 100 25.64 36.54 29.37 38.96 Canada CAD 100 71.54 84.92 75.45 82.86 Chile CLP 100 0.14 0.16 0.15 0.16 China CNY 100 15.28 15.92 15.32 14.85 Eurozone EUR 100 108.42 120.22 106.91 121.47 United Kingdom GBP 100 146.91 153.47 147.19 150.69 Korea KRW 100 0.08 0.09 0.09 0.09 India INR 100 1.49 1.55 1.50 1.50 Taiwan TWD 100 3.01 3.11 3.03 3.02 USA USD 100 99.15 98.76 96.26 91.48 5. EXCHANGE RATES The most significant currencies for the Group were translated at the following exchange rates into Swiss Francs.
- 15. 15 SHAREHOLDER INFORMATION DISCLAIMER This PDF version is an exact copy of the document provided to SGS shareholders. Except when you are a shareholder, this material is provided for information purposes only and is not, in particular, intended to confer any legal rights on you. This document does not constitute an invitation to invest in SGS shares. Any decisions you make in reliance on this information are solely your responsibility. This document is given as of the dates specified, is not updated and any forward looking statements are made subject to the following reservations: This document contains certain forward looking statements that are neither historical facts nor guarantees of future performance. Because these statements involve risks and uncertainties that are beyond control or estimation of SGS, there are important factors that could cause actual results to differ materially from those expressed or implied by these forward looking statements. These statements speak only as of the date of this document. Except as required by any applicable law or regulation, SGS expressly disclaims any obligation to release publicly any updates or revisions to any forward looking statements contained herein to reflect any change in SGS group’s expectations with regard thereto or any change in events or conditions on which any such statements are based. SGS SA CORPORATE OFFICE 1 place des Alpes P.O. Box 2152 CH – 1211 Geneva 1 t +41 (0)22 739 91 11 f +41 (0)22 739 98 86 e sgs.investor.relations@sgs.com www.sgs.com ANNUAL GENERAL MEETING OF SHAREHOLDERS Monday, 14 March 2016 Geneva, Switzerland 2016 HALF YEAR RESULTS Monday, 18 July 2016 INVESTOR DAYS (IN EUROPE) Thursday - Friday 27–28 October 2016 DIVIDEND PAYMENT DATE Ex-Date: 16 March 2016 Record data: 17 March 2016 Payment date: 18 March 2016 STOCK EXCHANGE LISTING SIX Swiss Exchange, SGSN STOCK EXCHANGE TRADING SIX Swiss Exchange COMMON STOCK SYMBOLS Bloomberg: Registered Share: SGSN.VX Reuters: Registered Share: SGSN.VX Telekurs: Registered Share: SGSN ISIN: Registered Share: CH0002497458 Swiss security number: 249745 CORPORATE DEVELOPMENT, COMMUNICATIONS & INVESTOR RELATIONS Jean-Luc de Buman SGS SA 1 place des Alpes P.O. Box 2152 CH – 1211 Geneva 1 t +41 (0)22 739 93 31 f +41 (0)22 739 92 00 www.sgs.com