1. Chapter 3.8 Systems Development, Implementation, Management and
Applications
3.8 (a) Techniques for Developing Computer Systems
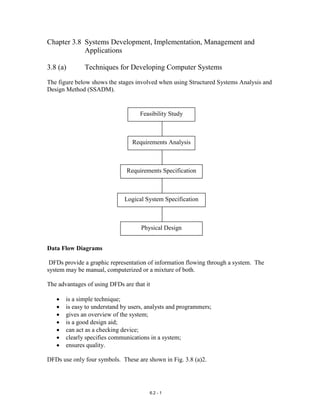
The figure below shows the stages involved when using Structured Systems Analysis and
Design Method (SSADM).
Feasibility Study
Requirements Analysis
Requirements Specification
Logical System Specification
Physical Design
Data Flow Diagrams
DFDs provide a graphic representation of information flowing through a system. The
system may be manual, computerized or a mixture of both.
The advantages of using DFDs are that it
is a simple technique;
is easy to understand by users, analysts and programmers;
gives an overview of the system;
is a good design aid;
can act as a checking device;
clearly specifies communications in a system;
ensures quality.
DFDs use only four symbols. These are shown in Fig. 3.8 (a)2.
6.2 - 1
2. Entity Outside environment (e.g. Customer)
e.g. 2 Accounts Dept
Process Produce Invoices
Data Flow Order
e.g.
D1 Data Store e.g. D1 Customer Orders
Fig. 3.8 (a)2
All names used should be meaningful to the users, whether they are computer literate or
not.
The steps to be taken when developing DFDs are given in Table 3.8 (a)1.
Step Notes
1. Identify dataflows. e.g. documents, VDU screens, phone messages.
2. Identify the external entities. e.g. Customer, Supplier
3. Identify functional areas. e.g. Departments, individuals.
4. Identify data paths. Identify the paths taken by the dataflows identified in
step 1.
5. Agree the system boundary. What is inside the system and what is not.
6. Identify the processes. e.g. Production of invoices, delivery notes, payroll
production.
7. Identify data stores. Determine which data are to be stored and where.
8. Identify interactions. Identify the interaction between the data stores and the
processes.
9. Validate the DFD. Check that meaningful names have been used.
Check that all processes have data flows entering and
leaving.
Check with the user that the diagram represents what
6.2 - 2
3. is happening now or what is required.
10. Fill in the details.
Table 3.8 (a)1
Fig. 3.8 (a)3 shows the different levels that can be used in DFDs.
0 Payroll System
Level 1
(Top 1 Get hours worked 2 Calculate wages 3 Produce wage slips
Level)
Level 2
(Lower 2.1 Validate 2.2 Calculate 2.3 Calculate 2.4 Calculate
Level) Data gross wage deductions net wage
Level 3
(Not
always
needed)
Fig. 3.8 (a)3
Now consider the following scenario.
A hotel reception receives a large number enquiries each day about the availability of
accommodation. Most of these are by telephone. It also receives confirmation of
bookings. These are entered onto a computer database.
While a guest is resident in the hotel, any expenses incurred by the guest are entered into
the database by the appropriate personnel. If guests purchase items from the bar or
restaurant, they have to sign a bill which is passed to a receptionist who enters the details
into the database.
When guests leave the hotel they are given an invoice detailing all expenditure. When
they pay, the database is updated and a receipt is issued.
The flow of data in this system is shown below:
6.2 - 3
4. Customer
Enquiry
Drinks Bill
Reply Drinks Order
Confirmation 1 Reception 1 Bar
of booking
Process Process
bookings and bookings and
Final Bill Customer's
accounts accounts
Customer Payment expenditure
Receipt
Customer Customer Drinks Bill
Details Details
D2 Customer Accounts
D1 Customer Details
Food Bill
1 Restaurant
Food Order Process
bookings and
Customer accounts
Food Bill
The symbol for Customer, an external entity, has a diagonal line to indicate that it occurs
more than once. This does not mean that these symbols represent different customers. It
is simply used to make the diagram clearer. Without this, there would be too many flow
lines between this symbol and the internal processes.
Data stores may also be duplicated. This is done by having a double vertical line on the
left hand side as shown in Fig. 3.8 (a)5.
M1 Customer data
Fig. 3.8 (a)5
Notice this data store is numbered M1 whereas those in Fig. 3.8 (a)4 were numbered D1
and D2. In data stores, M indicates a manual store and D indicates a computer based data
6.2 - 4
5. store. Also, there can be no data flows between an external entity and a data store. The
flow of data from, or to, an external entity must be between the external entity and a
process.
The example of the hotel system only shows one external entity, the customer. Usually
there is more than one external entity. Suppose we are dealing with a mail order
company. Clearly, one external entity is the customer. However, another is the supplier.
Note that although there are more than one customer and supplier, in the diagram they are
written in the singular.
When a major project is undertaken, there will be a number of different tasks to be
carried out. (If the project consisted of a single task it could hardly be called ‘major’).
With a number of tasks, some may be possible at the same time, while with others it
becomes important to do them in the correct order.
It may also be important to work out how long the project should take to complete.
Major projects like this can be represented graphically to show the different tasks and
how they join together, or relate to each other.
Take, as an example, the major project of building a bungalow. It can be divided into a
number of tasks.
A Concreting the foundations takes 4 days
B Building the walls takes 4 days
C Making the doors and windows takes 7 days
D Tiling the roof takes 2 days
E Installing the plumbing takes 3 days
F Doing the interior carpentry takes 4 days
G Installing the electrics takes 6 days
H Decorating takes 5 days
One way of deciding how long the bungalow takes to build is to add up all the separate
times, 35 days. On the other hand they are separate jobs so as long as enough people are
working, it will only take as long as the longest task, 7 days. This is silly, the decorating
can’t be done before the roof is on!
The real time for the project is somewhere between 7 and 35 days.
H
G
F
E
D
C
B
A
4 8 12 16 20 24 No of Days
Fig. 3.8 (a)6
Fig. 3.8 (a)6 shows when all the different tasks can start and when they must end.
6.2 - 5
6. It shows which can overlap, and by how much.
Finally, it shows how long the project will take. (Your ideas of how a bungalow is built
may be different, but this is the method used by B and L Construction.)
Another type of graph might be similar to a flow diagram. The circles represent stages
and the arrows the tasks needed to reach that stage and the time, in days, needed to carry
them out.
4
1 A 2
4
B
2
3 7 4 D 5 6
C G
4
3 F 7
E 5
6 H
1 Start
2 Foundations finished
3 Start making the windows and doors
4 Walls finished
5 Roof finished
6 Interior finished
7 Bungalow finished
There are many routes through the diagram. The one that gives the time taken to
complete the bungalow is
1 2 4 5 6(G) 7
A total of 21 days. This is the critical path. The bungalow cannot be built in a shorter
time.
The arrows show the order in which the tasks must be carried out, so E (the plumbing)
cannot be done before B (building the walls), but can be done at the same time as tiling
the roof (D). Each node can have an optimum time worked out. Node 6 has an optimum
time of 4+4+2+6 = 16 days. This is the time to be sure of getting to node 6 whichever
route you choose. Each node can also have a latest starting time before it holds up
another node. Node 1 must start immediately otherwise the walls (4) won’t be finished
by day 8. However, node 3 could start immediately or wait a day without affecting the
rest.
6.2 - 6
7. Complex computing projects require effective management or they may get out of
control. Different personnel will be needed for different tasks. Their time must be
booked in advance so that they are free from working on other tasks or projects when
they are needed. This means that an accurate prediction of the start times of the various
tasks must be made. It is also necessary to assess how long the different tasks will last so
that other projects can book personnel.
There is now specialist project management software available that can take more
complex projects than the one that we were considering and produce the type of analysis
that we have been talking about. If the software is compatible with the diary software
used by a firm then it can automatically book the workers when they are needed.
3.8 (b) The Purpose of Documentation
It is important that the design of a solution is accurate BEFORE it is implemented. For
the design to be accurate, the original specification must be accurate. This means that,
when we are asked to produce a solution, we must make sure that we thoroughly
understand the problem. This can only be achieved by checking our analysis with those
who are going to use our system. Users are not usually technical people and so we
require simple ways of showing our understanding of the problem. One of the best ways
of doing this is to use diagrams.
An E-R diagram shows the relationships between entities so that we can check these
relationships with the end user. These diagrams help us to ask questions like
Can a customer only have one product?
Can a customer own many products?
Can a student borrow many books?
Thus, we can ensure that the relationships are correct. We can also ensure that we have
included all the entities.
Similarly, our Data Flow Diagrams (DFDs) show how data is moving through the
organization and we can ask questions like
Are there any other data requirements?
Are all data moving between the right departments?
Are all the external entities present?
This continual validation process is essential if we are to reduce the cost of maintenance
due to errors and omissions. The careful documentation also helps to maintain a piece of
software when it is to be upgraded by adding extra facilities.
6.2 - 7
8. User Request
Initial Study
Feasibility
Study
Systems
Analysis
Systems
Design
Implementation
Change Over
Evaluation
and
Maintenance
3.8 (d) Appropriate Response Times
A classic example is the file of goods that needs to be accessed directly if it is to be used
at the point of sale terminal, and sequentially if the details are to be used for ordering of
replacements. The solution is to store the file in an indexed sequential format. At the
point of sale the item required is identified by a laser scanner whereas at the head office
the item name will likely be typed in at a keyboard. If a single item needs to be found
then a program can be written to find the details directly from the key field by using a
hashing algorithm, alternatively the items can be held sequentially in an index and a
program can be written to find the particular item by using a binary search of the index.
Dependent upon the method of search the data needs to be stored differently.
3.8 (e) Implementation Techniques
Direct Implementation
Parallel Implementation
Phased Implementation
3.8 (f) Managing, Monitoring and Maintenance of Systems
Adaptive Maintenance
Corrective Maintenance
Perfective Maintenance
6.2 - 8
9. 3.8 Example Questions
1. Explain what is meant by the term entity model. (4)
2. A computer system has been designed and produced for a person who works from
home for a publisher of fiction books as a proof reader of manuscripts. Another
system is designed for a graphic designer who sends work to clients electronically.
Describe how the hardware specifications for the two systems would differ. (10)
3. Describe how the forms of implementation:
(i) Parallel running
(ii) Phased
(iii) Direct
are carried out. In each case describe one aspect of an application which would
make that form of implementation appropriate in that case.
4. Discuss the need for project management when a major project is being
implemented.
6.2 - 9