

Recommandé
Recommandé
Contenu connexe
Tendances
Tendances (20)
En vedette
Similaire à Twitter 2015 Q2 financial report
Similaire à Twitter 2015 Q2 financial report (20)
Plus de Sergey Ulankin
Plus de Sergey Ulankin (15)
Dernier
Dernier (20)
Twitter 2015 Q2 financial report
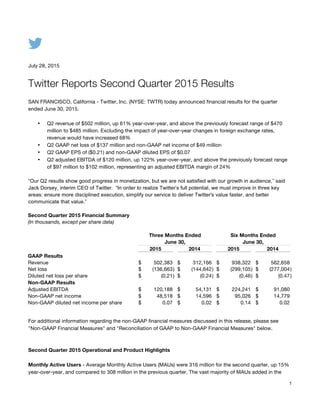
- 1. 1 July 28, 2015 Twitter Reports Second Quarter 2015 Results SAN FRANCISCO, California - Twitter, Inc. (NYSE: TWTR) today announced financial results for the quarter ended June 30, 2015. • Q2 revenue of $502 million, up 61% year-over-year, and above the previously forecast range of $470 million to $485 million. Excluding the impact of year-over-year changes in foreign exchange rates, revenue would have increased 68% • Q2 GAAP net loss of $137 million and non-GAAP net income of $49 million • Q2 GAAP EPS of ($0.21) and non-GAAP diluted EPS of $0.07 • Q2 adjusted EBITDA of $120 million, up 122% year-over-year, and above the previously forecast range of $97 million to $102 million, representing an adjusted EBITDA margin of 24% “Our Q2 results show good progress in monetization, but we are not satisfied with our growth in audience,” said Jack Dorsey, interim CEO of Twitter. “In order to realize Twitter’s full potential, we must improve in three key areas: ensure more disciplined execution, simplify our service to deliver Twitter's value faster, and better communicate that value.” Second Quarter 2015 Financial Summary (In thousands, except per share data) Three Months Ended Six Months Ended June 30, June 30, 2015 2014 2015 2014 GAAP Results Revenue $ 502,383 $ 312,166 $ 938,322 $ 562,658 Net loss $ (136,663) $ (144,642) $ (299,105) $ (277,004) Diluted net loss per share $ (0.21) $ (0.24) $ (0.46) $ (0.47) Non-GAAP Results Adjusted EBITDA $ 120,188 $ 54,131 $ 224,241 $ 91,080 Non-GAAP net income $ 48,518 $ 14,596 $ 95,026 $ 14,779 Non-GAAP diluted net income per share $ 0.07 $ 0.02 $ 0.14 $ 0.02 For additional information regarding the non-GAAP financial measures discussed in this release, please see "Non-GAAP Financial Measures" and "Reconciliation of GAAP to Non-GAAP Financial Measures" below. Second Quarter 2015 Operational and Product Highlights Monthly Active Users - Average Monthly Active Users (MAUs) were 316 million for the second quarter, up 15% year-over-year, and compared to 308 million in the previous quarter. The vast majority of MAUs added in the
- 2. 2 quarter on a sequential basis came from SMS Fast Followers. Excluding SMS Fast Followers, MAUs were 304 million for the second quarter, up 12% year-over-year, and compared to 302 million in the previous quarter. Mobile MAUs represented approximately 80% of total MAUs. Consumer Products –Twitter launched a new autoplay feature for native videos, Vines and GIFs, as well as Periscope live video streaming on Android. Advertising Products - Twitter launched objective-based campaigns, reports and pricing to all advertisers globally in order to drive higher ROI. Twitter also introduced installed application category targeting, a new feature that enables app advertisers to reach mobile users based on the categories of apps they have installed on their device. Twitter also rolled out Audience Insights, a tool that provides advertisers with aggregate information such as user demographics, interests, and purchasing behavior so they can better understand their key audiences. Partnerships – Twitter announced a partnership with Google’s DoubleClick platform to improve advertising performance measurement and attribution for Twitter direct response marketers. As part of the partnership, Twitter will also make its inventory available through the DoubleClick Bid Manager platform. Twitter also launched its Official Partner Program, a new initiative combining industry-leading product and service partners that help businesses achieve better results on Twitter and beyond. Developers – Twitter’s mobile developer conference, Flock, continued its world tour with events in Asia Pacific and Latin America. In addition, Twitter announced a standalone Digits kit and introduced open sourcing for both Fabric and Digits kits on Android. Acquired Companies – Twitter acquired TellApart, a leading marketing technology company providing retailers and e-commerce advertisers with unique cross-device retargeting capabilities through dynamic product ads and email marketing, and Whetlab, a startup focused on machine learning and artificial intelligence. Second Quarter 2015 Financial Highlights Revenue - Revenue for the second quarter of 2015 totaled $502 million, an increase of 61% compared to $312 million in the same period in 2014. Excluding the impact of year-over-year changes in foreign exchange rates, revenue would have increased 68%. • Advertising revenue totaled $452 million, an increase of 63% year-over-year. Excluding the impact of year-over-year changes in foreign exchange rates, advertising revenue would have increased 71%. • Mobile advertising revenue was 88% of total advertising revenue. • Data licensing and other revenue totaled $50 million, an increase of 44% year-over-year. • US revenue totaled $321 million, an increase of 53% year-over-year. • International revenue totaled $181 million, an increase of 78% year-over-year. Net loss - GAAP net loss was $137 million for the second quarter of 2015 compared to $145 million in the same period in 2014. GAAP net loss for the second quarter of 2015 included $175 million of stock-based compensation expense. Adjusted EBITDA - Adjusted EBITDA was $120 million for the second quarter of 2015, an increase of 122% compared to $54 million in the same period in 2014.
- 3. 3 Non-GAAP net income - Non-GAAP net income was $49 million for the second quarter of 2015 compared to $15 million in the same period in 2014. EPS - Basic and diluted GAAP EPS was ($0.21) for the second quarter of 2015 compared to ($0.24) in the same period in 2014. Non-GAAP diluted EPS - Non-GAAP diluted EPS was $0.07 for the second quarter of 2015 compared to $0.02 in the same period in 2014. Capital expenditures - Purchases of property and equipment for the second quarter of 2015 were $93 million. Additionally, $6 million of equipment purchases were financed through capital leases during the second quarter of 2015. Cash, cash equivalents and marketable securities - As of June 30, 2015, cash, cash equivalents, and marketable securities were approximately $3.6 billion, compared to $3.6 billion as of March 31, 2015. Outlook Twitter's outlook for the third quarter of 2015 is as follows: • Revenue is projected to be in the range of $545 million to $560 million. • Adjusted EBITDA is projected to be in the range of $110 million to $115 million. • Stock-based compensation expense is projected to be in the range of $190 million to $200 million, excluding the impact of equity awards that may be granted in connection with potential future acquisitions. Twitter's outlook for the full year of 2015 is as follows: • Revenue is projected to be in the range of $2.20 billion to $2.27 billion. • Adjusted EBITDA is projected to be in the range of $520 million to $540 million. • Capital expenditures are projected to be in the range of $450 million to $550 million. • Stock-based compensation expense is projected to be in the range of $750 million to $790 million, excluding the impact of equity awards that may be granted in connection with potential future acquisitions. Note that Twitter's outlook for the third quarter and full year of 2015 reflects foreign exchange rates as of July 15, 2015. Webcast and Conference Call Details Twitter will host a conference call today, Tuesday, July 28, 2015, at 2:00 p.m. Pacific Time (5:00 p.m. Eastern Time) to discuss financial results. Questions submitted via Twitter, directed to @TwitterIR, using the hashtag #TWTRearnings will be considered during the Q&A portion of the conference call in addition to questions submitted by conference call participants. A live webcast of the conference call, Twitter's financial results and
- 4. 4 supplemental slides will be accessible from the Investor Relations page of Twitter's website at investor.twitterinc.com. A replay will be archived and accessible at the same website after the conference call. Twitter has used, and intends to continue to use, its Investor Relations website (investor.twitterinc.com), as well as certain Twitter accounts (@jack, @twitter and @twitterIR), as means of disclosing material non-public information and for complying with its disclosure obligations under Regulation FD. About Twitter, Inc. Twitter (NYSE: TWTR) is a global platform for public self-expression and conversation in real time. By developing a fundamentally new way for people to consume, create, distribute and discover content, Twitter enables any voice to echo around the world instantly and unfiltered. The service can be accessed at Twitter.com, on a variety of mobile devices, and via SMS. Available in more than 35 languages, Twitter has 316 million monthly active users. For more information, visit about.twitter.com or follow @twitter. Forward Looking Statements This press release contains forward-looking statements within the meaning of Section 27A of the Securities Act of 1933 and Section 21E of the Securities Exchange Act of 1934. Forward-looking statements generally relate to future events or Twitter's future financial or operating performance. In some cases, you can identify forward- looking statements because they contain words such as "may," "will," "should," "expects," "plans," "anticipates," "could," "intends," "target," "projects," "contemplates," "believes," "estimates," "predicts," "potential" or "continue" or the negative of these words or other similar terms or expressions that concern Twitter's expectations, strategy, plans or intentions. Forward-looking statements in this press release include, but are not limited to, Twitter's strategies and business plans, Twitter's expectations regarding its revenue, adjusted EBITDA, capital expenditures and stock-based compensation expense for the third quarter and full year 2015. Twitter's expectations and beliefs regarding these matters may not materialize, and actual results in future periods are subject to risks and uncertainties that could cause actual results to differ materially from those projected. These risks include the possibility that: Twitter's user base and engagement do not continue to grow; Twitter's new products and product features do not meet expectations; advertisers reduce or discontinue their spending on Twitter; data partners reduce or discontinue their purchases of data licenses from Twitter; and Twitter experiences expenses that exceed its expectations. The forward-looking statements contained in this press release are also subject to other risks and uncertainties, including those more fully described in Twitter's Annual Report on Form 10-K for the fiscal year ended December 31, 2014 and Quarterly Report on Form 10-Q for the quarter ended March 31, 2015 filed with the Securities and Exchange Commission. Additional information will also be set forth in Twitter's Quarterly Report on Form 10-Q for the quarter ended June 30, 2015. The forward-looking statements in this press release are based on information available to Twitter as of the date hereof, and Twitter disclaims any obligation to update any forward-looking statements, except as required by law. Non-GAAP Financial Measures To supplement Twitter's financial information presented in accordance with generally accepted accounting principles in the United States, or GAAP, Twitter considers certain financial measures that are not prepared in accordance with GAAP, including revenue excluding foreign exchange effect, advertising revenue excluding foreign exchange effect, adjusted EBITDA, non-GAAP net income (loss), adjusted EBITDA margin and non-GAAP diluted EPS. Twitter defines adjusted EBITDA as net loss adjusted to exclude stock-based compensation expense, depreciation and amortization expense, interest and other expenses, net and provision (benefit) for income taxes; and Twitter defines non-GAAP net income (loss) as net loss adjusted to exclude stock-based compensation expense, amortization of acquired intangible assets, non-cash interest expense related to convertible notes, non-cash expense related to acquisitions and the income tax effects related to acquisitions.
- 5. 5 Adjusted EBITDA margin is calculated by dividing adjusted EBITDA by revenue. Twitter uses the non-GAAP financial measures of adjusted EBITDA, non-GAAP net income (loss), adjusted EBITDA margin and non-GAAP diluted EPS in evaluating its operating results and for financial and operational decision-making purposes. Twitter believes that adjusted EBITDA, non-GAAP net income (loss), adjusted EBITDA margin and non-GAAP diluted EPS help identify underlying trends in its business that could otherwise be masked by the effect of the expenses that we exclude in adjusted EBITDA, non-GAAP net income (loss), adjusted EBITDA margin and non-GAAP diluted EPS. Twitter also believes that adjusted EBITDA, non-GAAP net income (loss), adjusted EBITDA margin and non-GAAP diluted EPS provide useful information about its operating results, enhance the overall understanding of Twitter's past performance and future prospects and allow for greater transparency with respect to key metrics used by Twitter's management in its financial and operational decision-making. Twitter uses these measures to establish budgets and operational goals for managing its business and evaluating its performance. Twitter translated revenue and advertising revenue for the quarter and six months ended June 30, 2015 using the prior year's monthly exchange rates for its settlement currencies other than the U.S. dollar, which Twitter believes is a useful metric that facilitates comparison to its historical performance. Twitter is presenting these non-GAAP financial measures to assist investors in seeing Twitter's operating results through the eyes of management, and because it believes that these measures provide an additional tool for investors to use in comparing Twitter's core business operating results over multiple periods with other companies in its industry. These non-GAAP financial measures should not be considered in isolation from, or as a substitute for, financial information prepared in accordance with GAAP. These non-GAAP financial measures are not based on any standardized methodology prescribed by GAAP and are not necessarily comparable to similarly-titled measures presented by other companies. For future periods, Twitter is unable to provide a reconciliation of adjusted EBITDA to net loss as a result of the uncertainty regarding, and the potential variability of, depreciation and amortization expense, interest and other expenses, net and provision (benefit) for income taxes, that are expected to be incurred in the future. Contacts Investors: Dave Rivinus ir@twitter.com Press: Jim Prosser jprosser@twitter.com
- 6. 6 TWITTER, INC. CONDENSED CONSOLIDATED BALANCE SHEETS (In thousands) (Unaudited) June 30, December 31, 2015 2014 Assets Current assets: Cash and cash equivalents $ 883,307 $ 1,510,724 Short-term investments 2,677,263 2,111,154 Accounts receivable, net 475,204 418,454 Prepaid expenses and other current assets 234,653 215,521 Total current assets 4,270,427 4,255,853 Property and equipment, net 651,017 557,019 Intangible assets 156,352 105,011 Goodwill 1,102,193 622,570 Other assets 50,345 42,629 Total assets $ 6,230,334 $ 5,583,082 Liabilities and stockholders’ equity Current liabilities: Accounts payable $ 51,614 $ 53,241 Accrued and other current liabilities 274,621 228,233 Capital leases, short-term 98,606 112,320 Total current liabilities 424,841 393,794 Convertible notes 1,414,896 1,376,020 Capital leases, long-term 83,381 118,950 Deferred and other long-term tax liabilities, net 31,768 24,706 Other long-term liabilities 44,264 43,209 Total liabilities 1,999,150 1,956,679 Stockholders’ equity: Common stock 3 3 Additional paid-in capital 6,135,566 5,208,870 Accumulated other comprehensive loss (32,834) (10,024) Accumulated deficit (1,871,551) (1,572,446) Total stockholders’ equity 4,231,184 3,626,403 Total liabilities and stockholders’ equity $ 6,230,334 $ 5,583,082
- 7. 7 TWITTER, INC. CONDENSED CONSOLIDATED STATEMENTS OF OPERATIONS (In thousands, except per share data) (Unaudited) Three Months Ended Six Months Ended June 30, June 30, 2015 2014 2015 2014 Revenue $ 502,383 $ 312,166 $ 938,322 $ 562,658 Costs and expenses Cost of revenue 167,623 100,027 311,098 185,530 Research and development 198,907 177,095 388,653 326,486 Sales and marketing 201,948 140,261 385,505 246,496 General and administrative 64,909 44,694 130,686 83,428 Total costs and expenses 633,387 462,077 1,215,942 841,940 Loss from operations (131,004) (149,911) (277,620) (279,282) Interest expense (24,437) (2,654) (48,756) (5,756) Other income (expense), net (695) 2,324 8,430 3,657 Loss before income taxes (156,136) (150,241) (317,946) (281,381) Benefit from income taxes (19,473) (5,599) (18,841) (4,377) Net loss $ (136,663) $ (144,642) $ (299,105) $ (277,004) Net loss per share: Basic and diluted $ (0.21) $ (0.24) $ (0.46) $ (0.47) Weighted-average shares used to compute net loss per share: Basic and diluted 655,721 595,607 648,143 587,760
- 8. 8 TWITTER, INC. CONDENSED CONSOLIDATED STATEMENTS OF CASH FLOWS (In thousands) (Unaudited) Three Months Ended Six Months Ended June 30, June 30, 2015 2014 2015 2014 Cash flows from operating activities Net loss $ (136,663) $ (144,642) $ (299,105) $ (277,004) Adjustments to reconcile net loss to net cash provided by operating activities: Depreciation and amortization 76,049 45,631 143,913 85,582 Stock-based compensation expense 175,143 158,411 357,948 284,780 Amortization of discount on convertible notes 17,006 — 33,644 — Provision for bad debt 553 658 3,345 1,436 Deferred income tax benefit (22,364) (7,747) (24,306) (7,737) Other non-cash adjustments 1,214 (1,589) (5,197) 666 Changes in assets and liabilities, net of assets acquired and liabilities assumed from acquisitions: Accounts receivable (39,785) (46,074) (43,944) (37,213) Prepaid expenses and other assets (5,221) 13,186 (7,861) (17,229) Accounts payable (9,723) 1,710 (11,437) 1,407 Accrued and other liabilities 33,770 62,153 35,160 89,692 Net cash provided by operating activities 89,979 81,697 182,160 124,380 Cash flows from investing activities Purchases of property and equipment (92,605) (44,457) (160,340) (94,077) Purchases of marketable securities (1,505,704) (568,264) (2,235,497) (1,039,014) Proceeds from maturities of marketable securities 629,732 532,593 1,342,137 1,009,926 Proceeds from sales of marketable securities 156,630 — 335,261 168,138 Changes in restricted cash (435) 422 (3,797) (11,716) Business combinations, net of cash acquired 2,627 (132,496) (26,300) (132,496) Purchases of cost method investments and others (5,000) (400) (7,000) (400) Net cash used in investing activities (814,755) (212,602) (755,536) (99,639) Cash flows from financing activities Taxes paid related to net share settlement of equity awards (306) (1,028) (6,480) (16,168) Repayments of capital lease obligations (29,388) (21,365) (62,934) (42,886) Proceeds from exercise of stock options 3,213 14,557 6,962 15,907 Proceeds from issuances of common stock under employee stock purchase plan 21,600 21,224 21,600 21,224 Other financing activities — — — (1,162) Net cash provided by (used in) financing activities (4,881) 13,388 (40,852) (23,085) Net increase (decrease) in cash and cash equivalents (729,657) (117,517) (614,228) 1,656 Foreign exchange effect on cash and cash equivalents 5,559 1,738 (13,189) 2,310 Cash and cash equivalents at beginning of period 1,607,405 960,755 1,510,724 841,010 Cash and cash equivalents at end of period $ 883,307 $ 844,976 $ 883,307 $ 844,976 Supplemental disclosures of non-cash investing and financing activities Common stock issued in connection with acquisitions $ 458,859 $ 51,846 $ 516,538 $ 51,846 Equipment purchases under capital leases $ 5,723 $ 30,782 $ 10,544 $ 47,739 Changes in accrued equipment purchases $ (3,273) $ 32,546 $ 9,087 $ 43,597
- 9. 9 TWITTER, INC. RECONCILIATION OF GAAP TO NON-GAAP FINANCIAL MEASURES (In thousands, except per share data) (Unaudited) Three Months Ended Six Months Ended June 30, June 30, 2015 2014 2015 2014 Non-GAAP net income and net income per share: Net loss $ (136,663) $ (144,642) $ (299,105) $ (277,004) Stock-based compensation expense 175,143 158,411 357,948 284,780 Amortization of acquired intangible assets 13,965 8,099 24,760 14,275 Non-cash interest expense related to convertible notes 17,006 — 33,644 — Non-cash expense related to acquisitions 926 — 926 — Income tax effects related to acquisitions (21,859) (7,272) (23,147) (7,272) Non-GAAP net income $ 48,518 $ 14,596 $ 95,026 $ 14,779 GAAP diluted shares 655,721 595,607 648,143 587,760 Dilutive equity awards (1) 40,147 78,936 43,636 95,362 Non-GAAP diluted shares 695,868 674,543 691,779 683,122 Non-GAAP diluted net income per share $ 0.07 $ 0.02 $ 0.14 $ 0.02 Adjusted EBITDA: Net loss $ (136,663) $ (144,642) $ (299,105) $ (277,004) Stock-based compensation expense 175,143 158,411 357,948 284,780 Depreciation and amortization expense 76,049 45,631 143,913 85,582 Interest and other expense, net 25,132 330 40,326 2,099 Benefit from income taxes (19,473) (5,599) (18,841) (4,377) Adjusted EBITDA $ 120,188 $ 54,131 $ 224,241 $ 91,080 Stock-based compensation expense by function: Cost of revenue $ 10,486 $ 13,869 $ 23,372 $ 23,700 Research and development 103,121 92,493 206,157 170,811 Sales and marketing 39,607 37,547 82,265 65,348 General and administrative 21,929 14,502 46,154 24,921 Total stock-based compensation expense $ 175,143 $ 158,411 $ 357,948 $ 284,780 Amortization of acquired intangible assets by function: Cost of revenue $ 10,345 $ 5,754 $ 18,546 $ 9,894 Research and development 64 140 128 280 Sales and marketing 3,556 2,205 6,086 4,101 General and administrative — — — — Total amortization of acquired intangible assets $ 13,965 $ 8,099 $ 24,760 $ 14,275 (1) Gives effect to potential common stock instruments such as stock options, RSUs, unvested restricted stock and warrant. There is no dilutive effect of the notes nor the related hedge and warrant transactions.
- 10. 10 TWITTER, INC. RECONCILIATION OF GAAP REVENUE TO NON-GAAP CONSTANT CURRENCY REVENUE (In millions) (Unaudited) Three Months Ended Six Months Ended June 30, June 30, 2015 2014 2015 2014 Revenue and advertising revenue excluding foreign exchange effect: Revenue $ 502 $ 312 $ 938 $ 563 Foreign exchange effect on 2015 revenue using 2014 rates 23 38 Revenue excluding foreign exchange effect $ 525 $ 976 Revenue year-over-year change percent 61% 67% Revenue excluding foreign exchange effect year-over-year change percent 68% 74% Advertising revenue $ 452 $ 277 $ 840 $ 503 Foreign exchange effect on 2015 advertising revenue using 2014 rates 23 38 Advertising revenue excluding foreign exchange effect $ 475 $ 878 Advertising revenue year-over-year change percent 63% 67% Advertising revenue excluding foreign exchange effect year- over-year change percent 71% 75%