VVVIP Call Girls In Greater Kailash ➡️ Delhi ➡️ 9999965857 🚀 No Advance 24HRS...
Drug discovery and evaluation safety and pharmacokinetic assays
1. Magnetic Resonance Imaging in
Pharmaceutical Safety Assessment 17
Paul D. Hockings
Contents
17.1 Introduction ........................................ 561
17.2 Liver Volume Measurement ...................... 563
17.3 Cardiac Hypertrophy ............................. 565
17.4 Hepatic Steatosis ................................... 567
References and Further Reading ........................ 569
17.1 Introduction
The high rate of attrition of drug projects through the
pharmaceutical pipeline is a significant contributor to
the increasing R&D costs seen in recent years. In 2004,
the FDA released a report entitled “Innovation or Stag-
nation, Challenge and Opportunity on the Critical Path
to New Medical Products” in which the alarm was
raised that only 8% of the molecules that enter clinical
development were successfully registered (http://
www.fda.gov/oc/initiatives/criticalpath/whitepaper.
html). Recent data suggests that this figure had fallen to
4% by 2010 (Bunnage 2011). Many more fail in the
preclinical stages of development. There is an urgent
need for new tools to improve drug development and
the critical path document specifically highlights imag-
ing as one of the new technologies that has a potential
to contribute. One quote from the report is particularly
telling, “Often, developers are forced to use the tools of
the last century to evaluate this century’s advances.”
Despite the explosion of potential biomarkers due
to the “-omics” approaches, there is an acknowledged
need to find and establish more sensitive, specific, and
predictive biomarkers (Wehling 2006). ICI (now
AstraZeneca) and Sandoz (now Novartis) introduced
MRI into the pharmaceutical industry in 1983, and the
use of imaging biomarkers to accelerate drug discov-
ery and development has been well documented
(Chandra et al. 2005; Pien et al. 2005; Beckmann
et al. 2007). MRI has been successful in the pharma-
ceutical industry for the same reasons that it is popular
in clinical practice; it is a noninvasive imaging
technique with superb soft tissue contrast capable of
delivering quantitative 3D information on organ
anatomy and function (Beckmann et al. 2004;
P.D. Hockings
PHB Imaging AstraZeneca, Mo¨lndal, Sweden
H.G. Vogel et al. (eds.), Drug Discovery and Evaluation: Safety and Pharmacokinetic Assays,
DOI 10.1007/978-3-642-25240-2_19, # Springer-Verlag Berlin Heidelberg 2013
561
2. Maronpot et al. 2004). Because it is noninvasive, aside
from the need to anesthetize animals to immobilize
them during image acquisition, animals can be imaged
on multiple occasions and studies can be designed so
that each animal serves as its own control increasing
the statistical power of experiments and allowing
group sizes to be reduced. However, despite penetra-
tion into preclinical and clinical drug efficacy studies,
there are relatively few reports of the use of MRI in
drug safety studies. Toxicology accounts for approxi-
mately one third of attrition in development and is thus
a major cost in the pharmaceutical industry. An infor-
mal survey of a number of preclinical imaging groups
in the pharmaceutical industry showed that approxi-
mately 5% of effort (range 0–20%) was devoted to
safety imaging studies. This seems a disproportionally
small effort considering that MRI is a powerful tool
that could potentially be used to reduce attrition in the
late pipeline where it is most expensive. It is important
to understand why MRI has not been more widely used
in the drug safety arena before describing in detail
a few of the MRI assays appropriate for preclinical
safety studies.
There are three types of safety pharmacology stud-
ies conducted in the pharmaceutical industry: (1)
single-dose core portfolio preclinical safety studies
conducted to good laboratory practice (GLP), (2) sup-
plemental studies of compound specific effects after
chronic dosing that are conducted when results from
the core battery of tests raise concern, and (3) “front-
loading” safety studies conducted in the drug discov-
ery function with the aim of designing safety liabilities
out of the lead compound series.
The first type of study forms part of the legally
required activities toward the registration of
a pharmaceutical product. The International Confer-
ence on Harmonisation of Technical Requirements for
Registration of Pharmaceuticals for Human Use (ICH)
safety pharmacology guidelines recommend the use of
unanesthetized animals, which is incompatible with
the standard MRI experiment in which animals are
anesthetized to prevent motion interfering with image
quality. It is certainly feasible to habituate animals to
the MRI environment; however, in practice, the results
may not warrant the effort involved. In addition, it is
unlikely that MRI assays will replace conventional
endpoints or shorten the study duration. Thus, there is
little incentive to routinely incorporate MRI assays in
the core package.
The second type of study is investigational and is
conducted when results from the core battery of tests
raise concern (Ettlin et al. 2010). In almost all cases,
the pharmaceutical industry prepares a comprehensive
package of studies for the regulatory authorities that
include effects after chronic dosing. The chronic-
dosing regimen encourages the design of imaging
experiments in which each animal acts as its own
control, increasing statistical power with smaller
group sizes and allowing longitudinal studies without
the need to kill groups of animals at each time point;
two factors that both separately and combined offer
dramatic sparing of laboratory animals. In these inves-
tigational studies, there are no guidelines against anes-
thesia, although clearly one must consider the impact
of anesthesia on each individual experiment. One of
the most significant obstacles in incorporating MRI
assays into investigational safety studies is that these
studies are often on the critical path for drug develop-
ment, and therefore there is an urgency that leaves little
time to develop and evaluate sophisticated new assays.
Thus, MRI is most appropriate to investigate adverse
events that recur regularly in safety assessment depart-
ments so that the appropriate validation work with
positive and negative controls can be in place before
the technique is needed in earnest.
The third type of study is not designed with regula-
tors in mind or conducted within dedicated safety
assessment functions. It is now widely recognized
that the pharmaceutical industry can no longer afford
to start safety evaluation only after candidate selection,
knowing that many candidates will quickly fail due to
safety issues. The pressure is on to reduce attrition in
the late pipeline by introducing safety screens in the
early pipeline when it is still possible to design known
safety liabilities out of the lead series. In future, we
expect to see increased numbers of these early pipeline
non-GLP safety pharmacology studies of pre-
candidates conducted in the drug discovery functions
for purely internal decision-making purposes. These
“front-loading” studies are likely to be the most ame-
nable to MRI as the drug project lifetime is sufficient to
discover and develop the appropriate MRI assays.
Good laboratory practice is often considered
a major hurdle in the use of MRI in safety assessment
studies. GLP ensures that the data produced from
nonclinical studies are of high quality, reliable, and
valid. Since regulators use these data to authorize
clinical trials and marketing of the end product,
562 P.D. Hockings
3. it is important that they are correctly recorded and
reproducible. An experienced, multidisciplined, and
dedicated function is needed to ensure that such work
is in compliance with legal requirements. The current
generation of preclinical MRI scanners are not equipped
with GLP software tools that would guarantee consis-
tent spectrometer operation or data transfer in compli-
ance with GLP. In principle, there is no reason why
collaboration between MRI scanner manufacturers and
the pharmaceutical industry could not produce GLP
compliant MRI assays; however, the burden of GLP
documentation makes compliance for complex and
innovative assays impractical. In practice, regulatory
agencies do accept investigatory studies not to GLP if
the work is critical to a scientifically based risk assess-
ment and has been conducted to an acceptable standard.
In this case, there is still a definite advantage if pro-
tocols, data acquisition, transfer, archival, staff records,
and so on are in accord with GLP principles.
Despite the obstacles mentioned above, the advan-
tages of noninvasive imaging techniques to drug safety
studies are obvious. It is possible to design longitudinal
studies in which the same animal is studied at baseline
and then at several time points while on study. Changes
in individual animals can be quantitated and compared
with baseline measurements either in simple percent-
age terms or, for example, using more sophisticated
linear mixed-effect models (Brown and Prescott 1999),
leading to a reduction in group size and obviating the
need to sacrifice animals at each time point. Baseline
data can be used either to select or deselect animals to
be included in a study or as a basis for randomization
between groups. And, of course, at the end of the study,
the animal is still available for other, complimentary,
analysis techniques. In general, the readout time for
MRI endpoints is faster than that for histology leading
to faster management go/no-go decisions. Some bio-
markers are only amenable via MRI, for example,
quantitation of intramyocellular lipid (IMCL) is
straightforward with MR spectroscopy (MRS) but
time-consuming with traditional microdissection
techniques.
Further, the imaging biomarkers identified in pre-
clinical safety assessment studies can also be used in
clinical drug safety studies, as MRI is widely available
and safe to use in volunteer studies. This can be an
advantage for the preclinical safety assessment function
as it provides feedback on translation of animal safety
assessment studies to humans using the same endpoint.
Clearly, one would not run MRI on all clinical safety
studies but in those cases where there is no cheaper,
simpler safety biomarker available and there is doubt
about the degree of risk posed in man, for example,
because of species differences or because the effect
size in the placebo group is expected to be very high.
The conclusion is perhaps best put in a recent post-
ing on the FDA website, “Imaging technologies pro-
vide powerful insights into the distribution, binding,
and other biological effects of pharmaceuticals. As
part of its Critical Path initiative, FDA has joined the
National Cancer Institute (NCI), the pharmaceutical
industry, and academia in a number of activities that
will facilitate the development of new imaging agents
and the use of medical imaging during product devel-
opment. We believe that with a little effort on the part
of all of us, imaging agents and technologies can con-
tribute important biomarkers and surrogate endpoints
during disease progression and contribute to the devel-
opment of new therapies to treat disease” (http://www.
fda.gov/cder/regulatory/medImaging/default.htm).
17.2 Liver Volume Measurement
PURPOSE AND RATIONALE
Liver hypertrophy is a frequent side effect in drug
development caused by a wide variety of compounds.
Because it is often the first indication of the hepatocar-
cinogenic potential of a drug candidate, liver weight
is routinely monitored in safety assessment studies
(Ou et al. 2001; Shoda et al. 2000). This is necessarily
a terminal procedure so that longitudinal evaluation of
hypertrophy must involve serial kills of groups of ani-
mals at the time points of interest. Assuming that the
compound administered does not significantly change
liver density, liver volume changes should be at least as
sensitive as liver weight changes. Noninvasive serial
MRI measurements of liver volume can reduce animal
usage by following the same groups of animals over the
time points of interest. In addition, the ability to measure
difference from baseline instead of a single time-point
liver volume usually increases the precision of treat-
ment measurements, and the resulting increase in statis-
tical power can be used to reduce group sizes.
PROCEDURE
Rats are anesthetized with isoflurane (1.5–2%,
0.6–1 l/min), and then MR images are acquired.
17 Magnetic Resonance Imaging in Pharmaceutical Safety Assessment 563
4. A high-resolution 3D FISP scan is acquired (TE/TR
1.7/3.3 ms, FOV 50 Â 50 Â 50 mm, reconstruction size
256 Â 192 Â 192, NA 1, FA 20
). Individual 3D
images take approximately 6 min to acquire. Spec-
trometer triggering is set such that data acquisition
occurs during the expiratory phase of the respiratory
cycle.
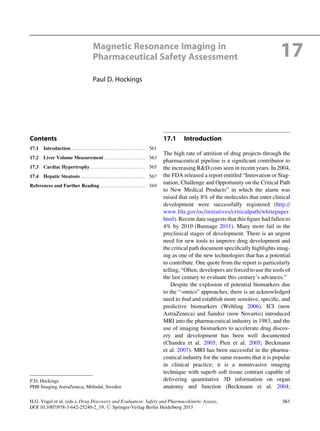
EVALUATION
Images can be evaluated with Analyze (Biomedical
Imaging Resource, MN, USA). Liver volume is deter-
mined by manual segmentation of each slice using the
ROI spline tool (Fig. 17.1). There is no loss in accuracy
in liver volume estimation if only a subset of at least 6
evenly spaced slices are segmented instead of the full
60 slices through the liver. To improve liver segmen-
tation at later time points, follow-up scans can be
registered to the baseline scans (Hajnal et al. 1995).
MODIFICATIONS OF THE METHOD
Cockman et al. (1993) used a multislice spin-echo
method and reported that respiratory triggering
increased the accuracy of rat liver volume measure-
ments. Hockings et al. (2002) and Hockings et al.
(2003a) reported rat liver volumes obtained with
a respiratory triggered segmented 3D fat suppressed
inversion recovery snapshot readout sequence at both
7 T and 2 T and reported a correlation coefficient
between in vivo MRI liver volume and post-mortem
liver wet weight of 0.96 and 0.99, respectively. Tang
et al. (2002) used a non-respiratory triggered multislice
spin-echo method in rats and reported a correlation
coefficient of 0.9 against liver wet weight with
a systematic overestimation of MRI liver volume.
The coefficient of variability of MRI precision was
2.3% and operator reliability for segmentation 2.9%.
Garbow et al. (2004a) measured liver volume in mice
with MRI at 4.7 T using an intraperitoneal injection of
contrast reagent to increase contrast between liver and
surrounding organs. The correlation coefficient
between MRI volume and wet weight was 0.94.
CRITICAL ASSESSMENT OF THE METHOD
The correlation between MRI liver volume and liver
weight has been established by a number of groups
using a variety of MRI methods indicating the robust-
ness of the technique. Its advantage over the direct
measurement of liver weight is the dramatic sparing
of animals as groups of animals no longer need to be
sacrificed at each time point and because the ability to
make within animal comparisons leads to greater pre-
cision and a reduction in group sizes. Hockings et al.
(2002) reported a reduction in animal usage from 120
to 6 with the same level of precision. In order to
measure liver volume with precision, it is necessary
to produce good contrast between liver and surround-
ing tissues such as intercostal muscle, fat, spleen,
stomach wall, and kidney. This can be done through
judicious optimization of the MRI pulse sequence and
timings. In addition, some researchers have used fat
suppression pulses to null the signal from fat to
enhance contrast to surrounding organs. Image
High resolution 3D MRI permits in vivo assessment of liver volume
High resolution 3D MRI image through
the rat abdomen allows easy delineation
of the liver
liver
a b
Correlation between post mortem liver
mass and in vivo MRI liver mass
r = 0.97 (p 0.0001)
5
5
10
10
15
15
Liver mass [g], ex vivo
Livermass[g],invivobyMRI
20
20
25
25
30
30
Fig. 17.1 MRI coronal
section through a rat liver
showing good contrast from
surrounding tissues (a) and
correlation with ex vivo wet
weight (b) (Abdel Wahad
Bidar, AstraZeneca, personal
communication 2007)
564 P.D. Hockings
5. acquisition normally takes several minutes so motion
from breathing and peristalsis in the GI tract can pro-
duce artifacts and blurring of the images. Fast imaging,
averaging, breath holding, or respiratory triggering
strategies can reduce motion artifacts from respiration.
The respiratory-triggering strategy synchronizes data
acquisition to the respiratory cycle and is the most
widely applied strategy for preclinical liver volume
determination. Peristaltic motility can be reduced by
overnight starvation or the application of antispas-
modics such as Buscopan; however, neither approach
is usually necessary.
One possible confound for this experiment is that
liver weight changes by up to 15% during the day as
glycogen levels drop (Latour et al. 1999), and so care
must be taken in longitudinal studies that animals are
always imaged at the same time of day to reduce within
animal variance. In addition, care must be exercised
with the choice of anesthetic as anesthetics such as
halothane are hepatotoxic and may influence the out-
come of the study when there are several imaging
sessions.
17.3 Cardiac Hypertrophy
PURPOSE AND RATIONALE
Measurement of cardiac function and morphology is
a key part of the preclinical evaluation of experimental
medicinal compounds. Blood pressure, heart rate, and
electrocardiogram evaluation are part of the core port-
folio of safety pharmacology studies carried out in
conscious telemetry dogs. If results from the core bat-
tery of tests raise concern, then supplemental studies
are conducted to measure endpoints such as left ven-
tricular pressure, pulmonary arterial pressure, heart
rate variability, baroreflex, cardiac output, ventricular
contractility, and vascular resistance. However, many
of these endpoints involve invasive surgery and so are
only appropriate for acute single time-point studies. To
date, there have been relatively few preclinical studies
using MRI to measure cardiovascular function, espe-
cially in the dog which is a large animal species widely
used in toxicology. MRI can be used to determine
myocardial volume, wall thickness, and left ventricular
(LV) and right ventricular (RV) end-diastolic and end-
systolic lumen volumes (EDV and ESV, respectively).
These parameters can be subsequently used to derive
functional indices such as wall stress, degree of
eccentric hypertrophy, stroke volume (SV), cardiac
output (CO), and ejection fraction (EF). MRI studies
are particularly suited to chronic-dosing regimen with
multiple imaging time points in the same animals.
PROCEDURE
Adult male beagle dogs (Harlan UK) weighing
between 9 and 14 kg are used. On days prior to scan-
ning, food is withheld from approximately 4 p.m. Dogs
are anesthetized with a bolus intravenous dose of
propofol (approx. 10 mg/kg) followed by propofol
(32–42 mg/kg/h) maintenance anesthesia and venti-
lated with medical air via an endotracheal tube. The
dorsal metatarsal or femoral artery is cannulated for
blood pressure measurements and to enable sampling
of arterial blood for monitoring blood gasses to ensure
adequate ventilation. ECG, capnography, pulse oxim-
etry, body temperature, and arterial blood pressure are
monitored throughout the scanning sessions on
a Bruker Maglife C (Wissembourg, France). Body
temperature is maintained with the aid of
a thermostatically controlled heating blanket.
MRI scanning is performed in a 1 meter bore 2 T
Bruker Medspec (Ettlingen, Germany) using a 28-cm
transmit/receive birdcage resonator. ECG triggered
segmented gradient-echo cine images are acquired
during the expiration phase of the respiratory cycle as
measured directly from the ventilator. An average of
16 frames per heart cine traverses approximately 80%
of the cardiac cycle starting from end diastole. Other
relevant imaging parameters are gradient-echo flip
angle 20
, TE 3 ms, TR 8 ms, 1–3 averages, SW
100 kHz, image matrix 128 Â 128, in-plane field of
view 200 mm, four phase-encoding steps per frame,
and linear traverse of k-space. Hence, the time resolu-
tion per cine frame is 32 ms. Each individual slice cine
is acquired in about one to one and a half minutes
depending on heart rate, so each set of multislice
cines takes about 15–20 min.
To obtain true short axis views, scout imaging com-
menced with a mid-ventricular coronal slice allowing
the vertical long axis (VLA) to be located by aligning
another scout through the apex and mid-mitral valve,
thus allowing for the leftward angle of the heart. From
the VLA, the downward inclination of the heart is
allowed for by taking a further scout lining up the
apex and mid-mitral valve to generate the horizontal
long axis plane (HLA). The scouts are acquired at end
diastole (0 ms delay after the QRS wave) so that the
17 Magnetic Resonance Imaging in Pharmaceutical Safety Assessment 565
6. atrioventricular (AV) ring, which descends apically in
systole, is in its most basal position. The first short-axis
cine is then placed just forward of the AV ring on the
HLA image, to cover the most basal portions of the
right and left ventricles. Approximately 15 contiguous
5-mm-thick segmented gradient echo cines with no
interslice gap are then sequentially acquired moving
toward the apex and including the apical tip. In this
way, the entire ventricle is imaged.
EVALUATION
Frames corresponding to end diastole and end systole
are identified from each cine sequence and regions-of-
interest (ROI) drawn around the left ventricular (LV)
epi- and endocardial borders using ParaVision soft-
ware (Bruker). The area of the ROIs is summed and
multiplied by the interslice distance (5 mm) to calcu-
late the end-diastolic and end-systolic volumes (EDV
and ESV) of the whole ventricle and lumen. Other
cardiac parameters are calculated as follows:
Stroke volume: SV ¼ EDVLumen À ESVLumen
Cardiac output: CO ¼ SV Â heart rate
Ejection fraction: EF ¼ SV=EDVLumenð Þ Â 100
Left ventricle myocardial mass at end systole is
calculated as:
MassLV ¼ ESVVentricle À ESVLumenð Þ Â D
where D is the density of the myocardium (1.05 g/mL)
(Hoffmann et al. 2001).
Left ventricle myocardial wall thickness in diastole
is calculated from the epi- and endocardial areas at the
slice where the epicardial area is maximum as follows:
LVwall thickness ¼
ffiffiffiffiffiffiffiffiffiffiffiffiffiffiffi
AreaLV
p
r
À
ffiffiffiffiffiffiffiffiffiffiffiffiffiffiffiffiffiffiffiffi
AreaLumen
p
r
The two ROIs used are assumed to be concentric
and circular.
MODIFICATIONS OF THE METHOD
Markiewicz et al. (1987) examined eight pentobarbital
anesthetized dogs and reported that cardiac output
and stroke volume measured by ECG-triggered
MRI correlated significantly with thermodilution mea-
surements (r ¼ 0.73 and 0.93, respectively). Shapiro
et al. (1989) also used ECG-triggered MRI in dogs
subjected to myocardial infarction and found excellent
correlation between MRI-derived myocardial mass
and wet weight (r ¼ 0.97) and that MRI-derived
myocardial mass measured in systole and diastole
correlated closely (r ¼ 0.95). Bambach et al. (1991)
examined carbon monoxide–induced ventricular
hypertrophy in rats using scan averaging instead of
triggering to reduce artifacts from cardiac motion.
They found that the mean outside diameter of the left
ventricle plus interventricular septum (LV + S) showed
a strong correlation with the duration of CO (r ¼ 0.73,
p 0.01) and to the hematocrit (r ¼ 0.72, p 0.05).
Rudin et al. (1991) used a dual respiratory-gated and
ECG-triggered approach in two models of cardiac
hypertrophy in rats. The correlation coefficient
between LV mass determined by MRI and post-
mortem LV weight was 0.99 and LV volume, SV,
and EF in control animals showed statistically signif-
icant differences from cardiac hypertrophy animals.
Siri et al. (1997) applied ECG-triggered MRI to murine
hearts and found LV mass determined by MRI corre-
lated well with LV weight (r ¼ 0.87). This data dem-
onstrated the dependence of LV mass estimates in the
mouse on the geometric model of the heart used and
show that MRI provides more accurate estimates of LV
mass in mice than does two-dimensional-directed
M-mode echocardiography. Slawson et al. (1998)
used a dual respiratory- and cardiac-gated MR
sequence in mice and obtained a correlation coefficient
of 0.99 between MRI and post-mortem heart weight.
Hockings et al. (2003b) used the method described
above to measure dobutamine- and minoxidil-induced
changes in cardiac function in dogs. They showed good
correlationbetweencardiacoutputmeasuredbyMRIand
cardiac output measured by thermodilution (r ¼ 0.94)
and that MRI could reliably detect acute changes in
cardiac output induced by dobutamine infusion
(p ¼ 0.01) in small groups of animals (n ¼ 7). Further-
more, they showed that MRI could detect LV enlarge-
ment induced by chronic administrationof minoxidil and
that the increase in EDV without an accompanying
change in LV wall thickness indicated a preload-induced
hypertrophy. Interestingly, the MRI technique was able
to detect small amounts of pericardial effusion.
CRITICAL ASSESSMENT OF THE METHOD
MRI has become the gold standard imaging technique
for the study of the human heart. The main advantages
are that it is noninvasive and has pronounced contrast
566 P.D. Hockings
7. between myocardium and blood and good temporal
resolution allowing images to be acquired at any
phase of the cardiac cycle. Thus, it is an accurate
technique for measuring ventricular volumes indepen-
dent of geometric assumptions, although clearly the
precision with which myocardial geometry can be
characterized depends on the number of image slices
acquired through the heart and on the in-plane resolu-
tion. Image acquisition during end diastole and end
systole allows the calculation of functional parameters
such as stroke volume, ejection fraction, and cardiac
output. One of the most important factors in the acqui-
sition of artifact-free images is the quality of the MRI
system’s ECG and respiratory triggering. Cardiac
exams in the clinic are usually conducted using
breathhold rather than with respiratory gating because
of the difficulty of obtaining a regular breathing cycle
in conscious volunteers and patients. However, in
anesthetized animals, breathing irregularities are not
usually a significant problem and complications due to
the increase in heart rate with hypercapnia during
breathhold usually outweigh the time penalty involved
in waiting for the respiratory gate. The studies
described above indicate that combined respiratory
gating and ECG triggering improve the precision of
measurements.
Alternatives to MRI include echocardiography to
measure LV wall thickness, lumen volume, and cardiac
output (Coatney 2001; Collins et al. 2003; de Simone
et al. 1990; Zhou et al. 2004), dye-dilution techniques
such as bolus thermodilution to measure cardiac output
(Siren and Feuerstein 1990), and implanted pressure
transducers and flow probes to measure left ventricular
pressure and blood flow parameters. Like MRI, echo-
cardiography is noninvasive and has the further advan-
tages that it provides low cost, real-time images with
structural, functional, and hemodynamic information.
Functional information is usually acquired in M-mode,
and hence it is necessary to make geometrical assump-
tions that may not be applicable if heart morphology
changes. In addition, the superior inter-study reproduc-
ibility of MRI in comparison with 2D echo leads to
better reliability of observed changes and thus greatly
reduced patient numbers in clinical trials (Grothues
et al. 2002). Both dye-dilution and implanted pressure
and flow probes are invasive techniques.
When planning functional studies, it is important to
consider that most anesthetics cause cardiac and respi-
ratory depression. For chronic studies, it may only be
important to ensure that the depth of anesthesia is
reproducible from imaging session to imaging session;
however, for acute studies, it is necessary to consider
interactions between the anesthetic and the test sub-
stance. The complexity of cardiac structure and func-
tion needs to be understood to devise a well-planned
imaging protocol.
17.4 Hepatic Steatosis
PURPOSE AND RATIONALE
Hepatic steatosis is a side effect associated with
a number of classes of compounds including some
metal compounds, cytostatic drugs, antibiotics, and
estrogens. In some cases, drug-induced hepatic
steatosis patients can present with a rapid evolution
of severe hepatic failure, lactic acidosis, and ultimately
death (Diehl 1999). The absence of predictable corre-
lation between abnormalities in liver enzymes and
histologic lesions led Clark et al. (2002) to conclude
that localized magnetic resonance spectroscopy
(MRS) was the best noninvasive way to quantify liver
fat in patients. This approach was favored because it
avoids the risks associated with invasive liver biopsy.
Lee et al. (1984) demonstrated that MRI can detect
fatty infiltration of the liver clinically, and Longo et al.
(1993) demonstrated that MRS is a reliable noninva-
sive method, comparable to computerized tomography
(CT), for quantifying clinical liver steatosis in humans.
Recently, Szczepaniak et al. (2005) used localized
MRS to show a strikingly high prevalence of hepatic
steatosis in the US population, and Cuchel et al. (2007)
showed that treatment with BMS-201038 was associ-
ated with hepatic fat accumulation, a potentially seri-
ous adverse event. A trend toward increased hepatic fat
was also seen by Visser et al. (2010) after treatment
with mipomersen.
For 20 years, localized MRS has been used in
medicine and biomedical research to obtain noninva-
sive biochemical information from living tissue
(Koretsky and Williams 1992). The spectra obtained
possess the very valuable property that the intensity
of a given peak is proportional to the number of nuclei
contributing to that peak provided that certain exper-
imental precautions are taken. This allows
a quantitative determination of a substance if there
is an appropriate internal or external reference. In the
case of localized in vivo 1 H spectroscopy, the water
17 Magnetic Resonance Imaging in Pharmaceutical Safety Assessment 567
8. signal is usually chosen as internal standard as the
proportion of body water to ash and protein is rela-
tively invariant. Single-voxel localized MRS allows
spectra to be obtained with spatial resolutions down
to 8 mL in some circumstances allowing localization
of a volume of interest entirely within the liver in
animals as small as mice (Fig. 17.2).
PROCEDURE
Isoflurane anesthetized mice or rats can be scanned in
a dedicated small animal MRI system with a transmit/
receive radiofrequency birdcage-design resonator. MRI
and MRS acquisition are synchronized with the respira-
tory cycle to minimize artifacts (Schwarz and Leach
2000; Wilson et al. 1993). Scout multislice spin-echo
images through the liver are used to determine voxel
placement. Localized 1 H PRESS spectra (Bottomley
1987) with, for example, TE/TR 6/3,000 ms and 64
averages can be obtained. For the mouse, a 2 Â 2 Â
2-mm cube in the right lateral lobe adjacent to the portal
vein and well removed from the surface of the liver and
distinct hyperintense fatty deposits is appropriate to
provide sufficient signal to noise.
EVALUATION
Quantification was accomplished by simulating the
water signal (which was used as a chemical shift ref-
erence) at 4.7 ppm, and the fat signals at 2.1, 1.3, and
0.9 ppm, with an 80:20 Gaussian–Lorentzian lineshape
using the Bruker XWINNMR package. Without know-
ing the average lipid chain length and degree of
unsaturation, it is impossible to calculate a valid
molar fat–water ratio, so the intrahepatocellular lipid
(IHCL) content is expressed as the percentage of the
sum of the fitted peak areas of the three fat peaks to the
fitted water peak area.
% IHCL ¼ 100 Ã
AðlipidÞ
AH2O þ AðlipidÞ
MODIFICATIONS OF THE METHOD
Hazle et al. (1991) used MRS to follow the time course
of ethanol-induced liver steatosis in rats. Spectra were
acquired without respiratory triggering, and lipid
signal was normalized to signal from an external ref-
erence sample. Correlation between MRS normalized
lipid signal and biochemically determined lipids
liver
voxel
kidney
A spectra is obtained from
a voxel placed in the right
liver lobe
Typical localized MR liver spectra from
mice showing different degree of IHCL.
The spectra contains peaks represen-
tative of water (4.7 ppm), lipid CH2(1.3
ppm), and lipid CH3 (0.9 ppm)
Correlation between in vivo MRS
IHCL and ex vivo liver triglyceride
content
Water
lipids
7
28%
12%
1.5%
6 5 4
ppm
a
b c
3 2 1 0
Localized MR spectroscopy (MRS) allows non-invasive
measurement of intrahepatocellular lipids (%IHCL) in vivo
gTG / 100g tissue
by biochemistry
40
%intrahepatocellularlipidcontent
byMRS
5 10
r = 0.97 (p 0.0001)
15 200
0
5
10
15
20
25
30
35
Fig. 17.2 (a) Coronal view through the liver of a Cafe´ diet
mouse showing the position of the 2 Â 2 Â 2-mm-localized MRS
voxel in the right lateral lobe of the liver, (b) in vivo–localized
PRESS spectrum from three mice with different degrees of
hepatic steatosis, and (c) correlation between in vivo MRS and
ex vivo triglyceride measurements (Abdel Wahad Bidar,
AstraZeneca, personal communication 2007)
568 P.D. Hockings
9. was moderate (r ¼ 0.52). Ling and Brauer (1992) used
respiratory-triggered MRS to examine the same model
and were able to show that a 5.5-fold increase in lipid
signal on treatment was matched by ex vivo analysis
although a correlation coefficient was not given.
Szczepaniak et al. (1999) used two animal models to
show a close correlation between hepatic triglyceride
measured by in vivo MRS and liver biopsy (r ¼ 0.93).
These researchers converted the MRS fat–water signal
ratio to micromoles triglyceride/gram wet tissue by
correcting for NMR relaxation and triglyceride proton
density relative to water. Daubioul et al. (2002) used
non-triggered localized MRS to show a reduction in
hepatic steatosis in Zucker rats fed a dietary supple-
ment with non-digestible carbohydrates. The spectra
presented showed artifacts consistent with respiratory
motion during acquisition. Hockings et al. (2003a)
measured the MRS fat–water ratio in the livers of
Zucker rats. They found a good correlation between
MRS fat–water ratio and the fractional volume of
intrahepatic fat determined by histology (r ¼ 0.89)
and were able to show that rosiglitazone treatment
reduced liver fat content. Kuhlmann et al. (2003)
reported similar findings in Zucker diabetic rats treated
with rosiglitazone. Liver lipid levels in mice were
examined by Garbow et al. (2004b). They reported
that respiratory-triggered acquisition of spectra was
important to remove the deleterious effects of respira-
tory motion and that the variation in MRS lipid content
across the liver was typically less than 10%. The cor-
relation coefficient between in vivo MRS and ex vivo
wet chemistry lipid measurements was 0.95. Zhang
et al. (2004) reported the use of a respiratory-triggered
3D three-point Dixon MRI method to determine liver
fat–water ratio in rats treated with a microsomal trans-
fer protein inhibitor known to produce hepatic
steatosis. They reported a high level of reproducibility
in in vivo measurements and were able to detect drug-
induced steatosis, but the correlation coefficient
against liver triglyceride and information on spatial
inhomogeneity of lipid accumulation in the liver
were not given.
CRITICAL ASSESSMENT OF THE METHOD
A number of both clinical and preclinical studies have
shown a robust correlation between liver fat–water
signal ratio measured by in vivo–localized MRS and
ex vivo analysis. Most groups have used a short echo
time PRESS sequence with respiratory triggering to
reduce motion artifacts and water as an internal stan-
dard. Both liver biopsy and single-voxel localized
MRS are hampered by sampling errors if fatty infiltra-
tions are inhomogeneously distributed in the liver. In
the clinical setting, alternative MRI or spectroscopic
imaging techniques have been used to measure lipid
content across the entire liver where there is a risk of
fatty infiltrations. Preclinically, Ling and Brauer (1992)
have shown that fat is distributed homogeneously
throughout the liver in rats with ethanol-induced
hepatic steatosis, and Garbow et al. (2004b) reported
similar findings for wild-type and two transgenic strains
of mice on low-fat or high-fat diets. Most researchers
avoided the problem of potential inhomogeneous lipid
distribution by selecting one region of the liver and
always returning to the same region in serial time-
point studies. For preclinical studies, it is clearly pos-
sible to kill groups of animals at each time point, but
particularly when the within group variability is large in
comparison to the measurement precision, the introduc-
tion of a noninvasive technology can result in
a dramatic sparing of animals.
References and Further Reading
Bambach GA, Penney DG, Negendank WG (1991) In situ
assessment of the rat heart during chronic carbon monoxide
exposure using nuclear magnetic resonance imaging. J Appl
Toxicol 11:43–49
Beckmann N, Laurent D, Tigani B, Panizzutti R, Rudin M
(2004) Magnetic resonance imaging in drug discovery: les-
sons from disease areas. Drug Discov Today 9:35–42
Beckmann N, Kneuer R, Gremlich HU et al (2007) In vivo
mouse imaging and spectroscopy in drug discovery. NMR
Biomed 20:154–185
Bottomley PA (1987) Spatial localization in NMR spectroscopy
in vivo. Annal N Y Acad Sci 508:333–348
Brown H, Prescott R (1999) Applied mixed models in medicine.
Wiley, Chichester
Bunnage ME (2011) Getting pharmaceutical RD back on
target. Nat Chem Biol 7:335–339
Chandra S, Muir C, Silva M et al (2005) Imaging biomarkers in
drug development: an overview of opportunities and open
issues. J Proteome Res 4:1134–1137
Clark JM, Brancati FL, Diehl AM (2002) Nonalcoholic fatty
liver disease. Gastroenterology 122:1649–1657
Coatney RW (2001) Ultrasound imaging: principles and appli-
cations in rodent research. ILAR J 42:233–247
Cockman MD, Hayes DA, Kuzmak BR (1993) Motion suppres-
sion improves quantification of rat liver volume in vivo by
magnetic resonance imaging. Magn Reson Med 30:355–360
Collins KA, Korcarz CE, Lang RM (2003) Use of echocardiog-
raphy for the phenotypic assessment of genetically altered
mice. Physiol Genomics 13:227–239
17 Magnetic Resonance Imaging in Pharmaceutical Safety Assessment 569
10. Cuchel M, Bloedon LT, Szapary PO et al (2007) Inhibition of
microsomal triglyceride transfer protein in familial hyper-
cholesterolemia. N Engl J Med 356:148–156
Daubioul C, Rousseau N, Demeure R, Gallez B, Taper H,
Declerck B, Delzenne N (2002) Dietary fructans, but not
cellulose, decrease triglyceride accumulation in the liver of
obese Zucker fa/fa rats. J Nutr 132:967–973
de Simone G, Wallerson DC, Volpe M, Devereux RB
(1990) Echocardiographic measurement of left ventricular
mass and volume in normotensive and hypertensive rats.
Necropsy validation. Am J Hypertens 3:688–696
Diehl AM (1999) Nonalcoholic steatohepatitis. Semin Liver Dis
19:221–229
Ettlin RA, Kuroda J, Plassmann S et al (2010) Successful drug
development despite adverse preclinical findings part 1:
processes to address issues and most important findings.
J Toxicol Pathol 23:189–211
Garbow JR, Kataoka M, Flye MW (2004a) MRI measurement of
liver regeneration in mice following partial hepatectomy.
Magn Reson Med 52:177–180
Garbow JR, Lin X, Sakata N, Chen Z, Koh D, Schonfeld G
(2004b) In vivo MRS measurement of liver lipid levels in
mice. J Lipid Res 45:1364–1371
Grothues F, Smith GC, Moon JCC et al (2002) Comparison of
interstudy reproducibility of cardiovascular magnetic reso-
nance with two-dimensional echocardiography in normal
subjects and in patients with heart failure or left ventricular
hypertrophy. Am J Cardiol 90:29–34
Hajnal JV, Saeed N, Soar EJ, Oatridge A, Young IR, Bydder GM
(1995) A registration and interpolation procedure for
subvoxel matching of serially acquired MR images.
J Comput Assist Tomogr 19:289–296
Hazle JD, Narayana PA, Dunsford HA (1991) In vivo NMR,
biochemical, and histologic evaluation of alcohol-induced
fatty liver in rat and a comparison with CCl4 hepatotoxicity.
Magn Reson Med 19:124–135
Hockings PD, Roberts T, Campbell SP, Reid DG, Greenhill RW,
Polley SR, Nelson P, Bertram TA, Kramer K (2002) Longi-
tudinal magnetic resonance imaging quantitation of rat liver
regeneration after partial hepatectomy. Toxicol Pathol
30:606–610
Hockings PD, Changani KK, Saeed N, Reid DG, Birmingham J,
O’Brien P, Osborne J, Toseland CN, Buckingham RE
(2003a) Rapid reversal of hepatic steatosis, and reduction
of muscle triglyceride, by rosiglitazone: MRI/S studies in
Zucker fatty rats. Diabetes Obes Metab 5:234–243
Hockings PD, Busza AL, Byrne J, Patel B, Smart SC, Reid DG,
Lloyd HL, White A, Pointing K, Farnfield BA, Criado-
Gonzalez A, Whelan GA, Taylor GL, Birmingham JM,
Slaughter MR, Osborne JA, Krebs-Brown A, Templeton D
(2003b) Validation of MRI measurement of cardiac output in
the dog: the effects of dobutamine and minoxidil. Toxicol
Mech Methods 13:39–43
Hoffmann U, Globits S, Stefenelli T, Loewe C, Kostner K,
Frank H (2001) The effects of ACE inhibitor therapy on
left ventricular myocardial mass and diastolic filling in pre-
viously untreated hypertensive patients: a cine MRI study.
J Magn Reson Imaging 14:16–22
Koretsky AP, Williams DS (1992) Application of localized
in vivo NMR to whole organ physiology in the animal.
Annu Rev Physiol 54:799–826
Kuhlmann J, Neumann-Haefelin C, Belz U, Kalisch J,
Juretschke HP, Stein M, Kleinschmidt E, Kramer W,
Herling AW (2003) Intramyocellular lipid and insulin resis-
tance: a longitudinal in vivo 1 H-spectroscopic study in
Zucker diabetic fatty rats. Diabetes 52:138–144
Latour MG, Brault A, Huet PM, Lavoie JM (1999) Effects of
acute physical exercise on hepatocyte volume and function in
rat. Am J Physiol 276:R1258–1264
LeeJK,DixonWT,LingD,LevittRG,MurphyWAJr(1984)Fatty
infiltration of the liver: demonstration by proton spectroscopic
imaging. Preliminary observations. Radiology 153:195–201
Ling M, Brauer M (1992) Ethanol-induced fatty liver in the rat
examined by in vivo 1 H chemical shift selective magnetic
resonance imaging and localized spectroscopic methods.
Magn Reson Imaging 10:663–677
Longo R, Ricci C, Masutti F, Vidimari R, Croce LS, Bercich L,
Tiribelli C, Dalla Palma L (1993) Fatty infiltration of the
liver. Quantification by 1 H localized magnetic resonance
spectroscopy and comparison with computed tomography.
Invest Radiol 28:297–302
Markiewicz W, Sechtem U, Kirby R, Derugin N, Caputo GC,
Higgins CB (1987) Measurement of ventricular volumes in
the dog by nuclear magnetic resonance imaging. J Am Coll
Cardiol 10:170–177
Maronpot RR, Sills RC, Johnson GA (2004) Applications of
magnetic resonance microscopy. Toxicol Pathol 32(Suppl 2):
42–48
Ou YC, Conolly RB, Thomas RS, Xu Y, Andersen ME, Chubb
LS, Pitot HC, Yang RS (2001) A clonal growth model: time-
course simulations of liver foci growth following penta- or
hexachlorobenzene treatment in a medium-term bioassay.
Cancer Res 61:1879–1889
Pien HH, Fischman AJ, Thrall JH et al (2005) Using imaging
biomarkers to accelerate drug development and clinical
trials. Drug Discov Today 10:259–266
Rudin M, Pedersen B, Umemura K, Zierhut W (1991) Determi-
nation of rat heart morphology and function in vivo in two
models of cardiac hypertrophy by means of magnetic reso-
nance imaging. Basic Res Cardiol 86:165–174
Schwarz AJ, Leach MO (2000) Implications of respiratory
motion for the quantification of 2D MR spectroscopic imag-
ing data in the abdomen. Phys Med Biol 45:2105–2116
Shapiro EP, Rogers WJ, Beyar R, Soulen RL, Zerhouni EA,
Lima JA, Weiss JL (1989) Determination of left ventricular
mass by magnetic resonance imaging in hearts deformed by
acute infarction. Circulation 79:706–711
Shoda T, Mitsumori K, Onodera H, Toyoda K, Uneyama C,
Takada K, Hirose M (2000) Liver tumor-promoting effect
of beta-naphthoflavone, a strong CYP 1A1/2 inducer, and the
relationship between CYP 1A1/2 induction and Cx32
decrease in its hepatocarcinogenesis in the rat. Toxicol
Pathol 28:540–547
Siren AL, Feuerstein G (1990) Cardiovascular effects of
anatoxin-A in the conscious rat. Toxicol Appl Pharmacol
102:91–100
Siri FM, Jelicks LA, Leinwand LA, Gardin JM (1997) Gated
magnetic resonance imaging of normal and hypertrophied
murine hearts. Am J Physiol 272:H2394–2402
Slawson SE, Roman BB, Williams DS, Koretsky AP (1998)
Cardiac MRI of the normal and hypertrophied mouse heart.
Magn Reson Med 39:980–987
570 P.D. Hockings
11. Szczepaniak LS, Babcock EE, Schick F, Dobbins RL, Garg A,
Burns DK, McGarry JD, Stein DT (1999) Measurement of
intracellular triglyceride stores by H spectroscopy: validation
in vivo. Am J Physiol 276:E977–989
Szczepaniak LS, Nurenberg P, Leonard D, Browning JD,
Reingold JS, Grundy S, Hobbs HH, Dobbins RL (2005)
Magnetic resonance spectroscopy to measure hepatic triglyc-
eride content: prevalence of hepatic steatosis in the general
population. Am J Physiol Endocrinol Metab 288:E462–468
Tang H, Vasselli JR, Wu EX, Boozer CN, Gallagher D (2002)
High-resolution magnetic resonance imaging tracks changes
in organ and tissue mass in obese and aging rats. Am
J Physiol Regul Integr Comp Physiol 282:R890–899
Visser ME, Akdim F, Tribble DL et al (2010) Effect of apolipo-
protein-B synthesis inhibition on liver triglyceride content in
patients with familial hypercholesterolemia. J Lipid Res
51:1057–1062
Wehling M (2006) Translational science in medicine: implica-
tions for the pharmaceutical industry. Int J Pharm Med
20:303–310
Wilson SJ, Brereton IM, Hockings P, Roffmann W, Doddrell
DM (1993) Respiratory triggered imaging with an optical
displacement sensor. Magn Reson Imaging 11:1027–1032
Zhang X, Tengowski M, Fasulo L, Botts S, Suddarth SA,
Johnson GA (2004) Measurement of fat/water ratios in rat
liver using 3D three-point Dixon MRI. Magn Reson Med
51:697–702
Zhou YQ, Foster FS, Nieman BJ, Davidson L, Chen XJ,
Henkelman RM (2004) Comprehensive transthoracic cardiac
imaging in mice using ultrasound biomicroscopy with ana-
tomical confirmation by magnetic resonance imaging.
Physiol Genomics 18:232–244
17 Magnetic Resonance Imaging in Pharmaceutical Safety Assessment 571