SlideShare une entreprise Scribd logo
1  sur  20
Télécharger pour lire hors ligne
Tobacco Prevention and Control in Utah
                                           Tenth Annual Report, August 2010


The Tobacco Prevention and Control Program protects Utah’s citizens from the harmful effects of cigarette
smoking and new tobacco products that perpetuate nicotine addiction. A sample of these products is shown
above along with candy in similar packaging.                                     For trademarks see back cover

Utah Department of Health
Tobacco Prevention and Control Program
TPCP Update
        Since Master Settlement                            2010 Highlights for TPCP Goals
        Agreement (MSA)
        funds were allocated                               The Tobacco Prevention and Control Program (TPCP) at the Utah
        to the TPCP in 1999,                               Department of Health and its partners use comprehensive strategies to
        Utah’s smoking rates                               reduce tobacco use and tobacco-related disease and death. Major program
        among adults, youth,                               outcomes are listed below:
        and pregnant women                                 Helping Tobacco Users Quit
        have declined by
        approximately one                                  With an age-adjusted adult smoking rate of 9.5% (2009), Utah continues to be
        third.1,3,5                                        the only state that has reached the national Healthy People 2010 objective of
                                                           reducing smoking to less than 12%.1 Still, more than 200,000 youth and adult
        Children’s exposure                                Utahns smoke and need help quitting.
        to secondhand smoke
        in their homes has                                 ●   The TRUTH campaign continued to reach adults with messages that encouraged
        declined by two thirds                                 quit attempts and informed about quit services. In 2010, 96% of Utah adult smokers
        since 2001.4                                           reported seeing anti-tobacco ads at least once a month during the past six months.2
                                                               Ninety-four percent were aware of the Utah Tobacco Quit Line and 65% knew about
        At 5% in 2008, the                                     the online quit service, Utah QuitNet. Adult smokers who were exposed to anti-
        smoking rate among                                     tobacco ads were more likely to know about quit services or be in the process of
        pregnant women is                                      quitting than smokers who were not exposed (combined data 2006-2010).2
        at its lowest recorded                             ●   During FY2010, nearly 11,000 Utahns used TPCP-funded tobacco cessation
                                                               services. Tailored services were offered for adults, teens, and pregnant women.
        level since 1989.5
                                                               These quit services greatly increased tobacco users’ quit success.
                                                           ●   Since the Utah Tobacco Quit Line began in 2001, more than 58,000 Utahns have
                                                               registered for services. In FY2010, the Quit Line served an average of 525 Utahns
                                                               per month with free counseling and tailored quit information.
                                                           ●   In FY2010, nearly 700 Utah youth tobacco users participated in the Utah-
                                                               developed teen cessation class, Ending Nicotine Dependence. Nearly 16% of
                                                               participants reported quitting tobacco by the last class and an additional 44%
                                                               reported reducing their tobacco use.

References:
                                                           Preventing Youth From Starting to Use Tobacco
1   Utah Department of Health. Behavioral Risk Factor
    Surveillance System (BRFSS). 1989-2009. Salt Lake
    City: Utah Department of Health. Center for Health
                                                           In 2009, 8.5% of Utah high school students (grades 9-12) reported that they had
    Data. (Note: These BRFSS data may underestimate        smoked in the past month. Utah’s youth smoking rate is less than half the national
    adult smoking prevalence because the samples did not
    include mobile phone numbers.)
                                                           rate of 19.5%.3
2 West, DR et al. (2009). 2009-2010 Evaluation of
  Utah’s Tobacco Prevention and Control Program.           ● In 2010, 93% of Utah youth ages 13 to 17 reported that they saw or heard
  Denver: University of Colorado Denver, Department
  of Family Medicine.
                                                             anti-tobacco ads at least once a month during the past six months, and 90%
3 YRBSS: Youth Risk Behavior Surveillance System.            said the TV ads made them think of the negative effects of tobacco use.2
  Youth Online: Comprehensive Results. Retrieved           ●   Since 2002, 19 of Utah’s 41 school districts worked with TPCP and local health
  August 2, 2010, from http://apps.nccd.cdc.gov/
  yrbss/.                                                      departments to strengthen school tobacco-free policies, tobacco education, and policy
4 Utah Department of Health. Utah Health Care Access           enforcement. These districts serve more than 216,000 students in 361 schools.
  Survey, 2001-2008. Salt Lake City: Utah Department of
  Health. Center for Health Data.
                                                           ●   Since 2001, illegal tobacco sales to underage youth during compliance checks
5 Utah Birth Certificate Database. Retrieved July 29,           declined by 61%. At 6.2%, the rate of non-compliance is at its lowest recorded level.
  2010 from Utah Department of Health, Center for
  Health Data, Indicator-Based Information System for
                                                               To decrease the rate of non-compliance, local health departments educated nearly
  Public Health web site: http://ibis.health.utah.gov.         1,000 Utah retail clerks about Utah’s tobacco access laws.
  These smoking rates are based on pregnancies that led    ●   The Phoenix Alliance, Utah’s statewide youth anti-tobacco advocacy group, educated
  to live births.
                                                               Utahns about new tobacco products and their packaging that is similar to candy.

    2
TPCP Update
    Protecting Utahns From Secondhand Smoke
    More than 93% of Utahns have established rules against smoking in their
    homes, and 98% of Utah children live in smoke-free homes (2008).1,4

    ●    In FY2010, TPCP’s partners assisted 22 worksites, nine health care entities,
         17 outdoor recreation venues, and two school districts with passing policies
         that protect Utahns from secondhand smoke exposure.
    ●    In the last year, the number of smoke-free apartment and condominium units
         in TPCP’s Smoke-free Apartment and Condominium Statewide Directory grew
         by 19% to nearly 16,000 in 11 Utah counties.
    ●    In addition to these private properties, two public housing authorities went
         smoke-free this year, encompassing 22 housing communities in Davis and
         Utah Counties.

    Eliminating Tobacco-related Disparities

    Utahns of lower socioeconomic status and in certain racial and ethnic
    populations smoke cigarettes at higher rates than the general population.
    For example, Utahns (age 25 and older) with less than a high school
    education were nearly 10 times more likely to report cigarette smoking than
    Utahns with a college degree.1

    ●    More than 1,500 low-income, uninsured, or Medicaid-insured Utahns,
         including 1,200 pregnant women, received free counseling and prescriptions        “Dear Me” television advertisements
         for medications to help them quit using tobacco in FY2010. More than 27%          from The TRUTH campaign motivated
         of participants in the TPCP-funded Medicaid program for pregnant women quit       Utah smokers to quit through real
         using tobacco and 24% reduced their tobacco use.                                  life stories of the struggles and
    ●    TPCP promoted tobacco cessation counseling and medications to Medicaid            successes with overcoming nicotine
         clients. Since 2006, the number of Medicaid clients who sought help quitting      addiction. In addition, the ads informed
         tripled, and totaled more than 3,000 in FY2010.                                   Utahns about local resources to quit
    ●    The four TPCP-funded Ethnic Tobacco and Health Networks worked on                 smoking. The “Dear Me” campaign
         tobacco prevention with unique strategies addressing the health, spiritual, and   was developed by the Washington
         social implications of tobacco use in their populations.                          State Department of Health Tobacco
                                                                                           Prevention and Control Program. After
                                                                                           reviewing Washington’s research on the
                                                                                           development and effectiveness of the
Looking Ahead to FY2011: TPCP Efforts Continue                                             “Dear Me” campaign, the Utah TPCP
Despite many successes, more must be done to help those at greatest risk for               formed a collaborative agreement with
tobacco-related disease and death, and to combat new tobacco products that                 Washington State to obtain the ads at
threaten public health.                                                                    minimal cost.

•       TPCP has partnered with the State Division of Substance Abuse and Mental
        Health to develop policies that will help Utahns with mental health and
        substance abuse problems to quit tobacco.
•       TPCP has launched efforts to educate the public about new tobacco and
        nicotine products that may lead to increased tobacco use among youth and
        perpetuate nicotine addiction among those who want to quit smoking.
•       TPCP and its partners will continue to assist community-based agencies to
        prevent and control tobacco use among racial, ethnic and sexual minorities in
        Utah, as well as the disabled population.                                                                              3
Tobacco Use in Utah
    Figure 1.                                                                                              Smoking Rates and Health Consequences
    Percent of Adults Who Reported Current
    Cigarette Smoking, Utah 1999-2009                                                                      Adult Smoking                                                            Exposure to Secondhand Smoke
    (Age-adjusted)
              25                                                                                           •      In 2009, Utah’s age-adjusted adult                                •     Since 2001, the percentage of
              20                                                                                                  smoking rate was 9.5% (Figure 1).                                       children (age 17 and younger)
                      13.5


                                         13.0


                                                                                                                                                                                          exposed to secondhand smoke at
                              12.5


                                                 12.5
 Percentage


                                                                                                                  Since 1999, the rate has declined by
                                                         11.9


                                                                        11.2


                                                                                      11.2
                                                                 10.1


              15
                                                                                9.5


                                                                                                    9.5
                                                                                              9.1                 30%.1 If rates had not declined since                                   home declined by 68% (from 6.0% in
              10
                  5                                                                                               1999, Utah would have approximately                                     2001 to 1.9% in 2008).5 If the rate
                  0                                                                                               80,000 additional adult smokers                                         had not declined, 35,000 additional
                                                                                                                  today.                                                                  Utah children would suffer from the
                      1999


                                     2001


                                                         2003


                                                                        2005


                                                                                      2007


                                                                                                    2009


                                                                                                                                                                                          consequences of secondhand smoke
                                                                Year                                       •      Smoking disproportionately impacts                                      today.
   Source: Utah BRFSS1                                                                                            Utahns with lower incomes. In 2009,
  Figure 2.                                                                                                       20% of Utah adults with a household                               •     Since 1999, the rate of Utah adults
  Percent of Pregnant Women Who                                                                                                                                                           who have a rule against smoking in
                                                                                                                  income of less than $25,000 reported
  Reported Cigarette Smoking, Utah
                                                                                                                  current smoking.1 In comparison, only                                   their homes has increased from 87%
  1999-2008
              25                                                                                                  6% of Utah adults with a household                                      to 93%.1
              20                                                                                                  income of $75,000 or higher
                                                                                                                                                                                    •     People living in rented homes are
Percentage


              15                                                                                                  reported current smoking.1
                                                                                                                                                                                          twice as likely to be exposed to
                      8.2
                              8.1
                                         7.6
                                                  7.1
                                                          6.5
                                                                   6.3
                                                                           5.9
                                                                                  5.9
                                                                                             5.8


              10
                                                                                                    5.4


                                                                                                           Smoking Among Pregnant Women                                                   secondhand smoke in their homes as
                  5
                                                                                                                                                                                          people living in owned homes (2008).5
                  0                                                                                        •      Since 1999, smoking among pregnant
                      1999


                                         2001


                                                          2003


                                                                           2005


                                                                                             2007


                                                                                                                  women decreased by 34% (Figure                                    Tobacco-related Disease and Death
                                                                Year                                              2). At 5.4%, the 2008 smoking rate
  Source: Utah Birth Certificates2                                                                                 for pregnant women is at its lowest                               •     Smoking is the leading cause of lung
                                                                                                                  recorded level.2                                                        cancer death in men and women.
   Figure 3.
   Percent of High School Students Who                                                                                                                                                    Other diseases caused by smoking
   Reported Current Cigarette Smoking,                                                                     •      Pregnant women in their teens and                                       include esophageal, laryngeal, oral,
   Utah 1999-2009 (Odd Years)                                                                                     pregnant women with less than a high                                    and throat cancers; cervical, bladder,
              25                                                                                                  school education continue to report                                     kidney, pancreatic, and stomach
              20                                                                                                  smoking rates of 10% or higher.2                                        cancers; acute myeloid leukemia;
 Percentage


                       11.9
              15
                                         8.3             7.3            7.4        7.9           8.5                                                                                      pneumonia; chronic lung disease;
              10                                                                                           Youth Smoking                                                                  cataracts; periodontitis; aortic
                  5                                                                                                                                                                       aneurysm; and coronary heart and
                  0                                                                                        •      Since 1991, the percentage of Utah
                                                                                                                                                                                          cardiovascular disease.
                                                                                                                  high school students who had ever
                        1999

                                          2001

                                                         2003

                                                                        2005

                                                                                   2007

                                                                                                 2009


                                                                                                                  tried cigarette smoking declined by                               •     Utah’s lung and bronchus cancer
                                                                Year                                              52%.3
   Source: Utah YRBS                 3                                                                                                                                                    incidence has decreased significantly
                                                                                                                                                                                          since 1999 (Figure 4).4
   Figure 4.                                                                                               •   Current smoking among high school
   Age-adjusted Cancer Incidence Rates for                                                                     students decreased from 12% in 1999                                  •     Despite this progress, more than
   Lung and Bronchus Cancer, Incidence per                                                                     to 8% in 2001. Since 2001, it has
   100,000 Population, Utah 1999-2007
                                                                                                                                                                                          1,200 Utahns age 35 or older die
                                                                                                               remained unchanged at 7 to 8%.3                                            each year as a result of tobacco use.6
              60
              50                                                                                           References:
                       34.6


                                                                 31.3
                                            31.1


                                                                                  30.1
                                                        29.0


                                                                         28.8


                                                                                                               Utah Department of Health. Behavioral Risk Factor Surveillance System (BRFSS). 1999-2009. Salt Lake City: Utah Department of
                                                                                          28.3
                               28.0
 Percentage


                                                                                                           1
                                                                                                    26.2


              40
                                                                                                               Health. Center for Health Data. (Note: These BRFSS data may underestimate adult smoking prevalence because the samples did not
              30                                                                                               include mobile phone numbers.)
              20                                                                                           2   Utah Birth Certificate Database. Retrieved July 29, 2010 from Utah Department of Health, Center for Health Data, Indicator-Based
              10                                                                                               Information System for Public Health web site: http://ibis.health.utah.gov. These smoking rates are based on pregnancies that led to
               0                                                                                               live births.
                                                                                                           3   YRBSS: Youth Risk Behavior Surveillance System. Youth Online: Comprehensive Results. Retrieved August 2, 2010, from http://apps.
                       1999


                                            2001


                                                                 2003


                                                                                  2005


                                                                                                    2007


                                                                                                               nccd.cdc.gov/yrbss/.
                                                                                                           4   Utah Cancer Registry. Retrieved July 12, 2010 from Utah Department of Health, Center for Health Data, Indicator-Based Information
                                                                Year                                           System for Public Health web site: http://ibis.health.utah.gov.
                                                          4
   Source: Utah Cancer Registry                                                                            5   Utah Department of Health. Utah Healthcare Access Survey, 2001-2008. Salt Lake City: Utah Department of Health. Center for Health Data.
                                                                                                           6   National Center for Chronic Disease Prevention and Health Promotion. (2010). Tobacco Control State Highlights 2010. Atlanta,

              4
                                                                                                               GA: U.S. Department of Health and Human Services. Retrieved August 19, 2010 from http://www.cdc.gov/tobacco/data_statistics/
                                                                                                               state_data/state_highlights/2010/supplement/index.htm.
Tobacco Use in Utah
Smoking Rates by Local Health Districts and Small Areas
Figure 5.
Current Cigarette Smoking by Local Health District, Small Area, Utah, and U.S. Adults,
2006-2009, (Aggregate Data, Age-adjusted)
                                         Utah State Rate 9.75%     U.S. Rate 19.04%
                   Bear River HD
         Other Box Elder Co. (2)
                        Logan (3)
       Other Cache/Rich Co. (4)
                Brigham City (1)
                Central Utah HD
 Juab/Millard/Sanpete Co. (54)
   Sevier/Piute/Wayne Co. (55)
               Davis County HD
 * Farmington/Centerville (14)
       * Syracuse/Kaysville (13)
                   Bountiful (16)
  * Woods Cross/North SL (15)                                              Local Health District
                      Layton (12)
         Clearfield/Hill AFB (11)
                                                                           Small Area
             Salt Lake Valley HD
       * Sandy, Southeast (38)
            * South Jordan (35)
          * Foothill/U of U (19)
           Riverton/Draper (39)
  West Jordan/Copperton (34)
                    Holladay (27)
        * Sandy, Northeast (37)
                   Millcreek (26)
               Cottonwood (28)
                    Avenues (18)
        West Jordan North (33)
              Sandy Center (36)
      Downtown Salt Lake (24)
                      Murray (31)
                      Kearns (29)                                                                              Note: Local health districts are represented by
                     Midvale (32)                                                                              tan bars. The green bars beneath indicate small
          West Valley West (22)
                 Taylorsville (30)
                                                                                                               areas within that district. For more details about
                    Glendale (21)                                                                              small area definitions, see the Utah Behavioral
            South Salt Lake (25)                                                                               Risk Factor Surveillance System Small Area
           West Valley East (23)
                   Rose Park (17)                                                                              Report 2001–2005, Appendix C: Small Area
                      Magna (20)                                                                               Definitions and Key Maps. The horizontal lines
         Southeastern Utah HD
       Grand/San Juan Co. (57)                                                                                 extending from the bars indicate 95% confidence
         Carbon/Emery Co. (56)                                                                                 intervals. Confidence intervals are used to show
            Southwest Utah HD
     Other Washington County
                                                                                                               the reliability of an estimate. A 95% confidence
                  St. George (58)                                                                              interval means that 95% of the time, the given
  Other Southwest District (61)                                                                                interval will contain the true parameter value.
                  Cedar City (60)
       Summit County HD (51)                                                                                   *These estimates have relative standard errors
         Tooele County HD (40)                                                                                 of >30% and do not meet UDOH standards for
              TriCounty HD (53)
                Utah County HD                                                                                 reliability.
                  East Orem (46)     **                                                                        **The estimates for Provo/BYU, and East and
                 Provo/BYU (47)      **                                                                        West Orem have been suppressed because the
   * American Fork/Alpine (42)
       * Lehi/Cedar Valley (41)                                                                                relative standard error was greater than 50%
                 West Orem (45)      **                                                                        or the relative standard error could not be
    Pleasant Grove/Lindon (43)
          * Utah Co. South (50)                                                                                determined. The combined adult smoking rate
  Springville/Spanish Fork (49)                                                                                for Provo/BYU, and East and West Orem (age-
               Provo South (48)
                North Orem (44)                                                                                adjusted, 2006-2009) was 2.4%.
       Wasatch County HD (52)
             Weber-Morgan HD
    Morgan/East Weber Co. (6)
                   Riverdale (10)
               South Ogden (8)
                 Roy/Hooper (9)
          Downtown Ogden (7)
                Ben Lomond (5)

                                     0        5     10     15       20     25      30      35      40
                                                                                                               Reference:
As shown in Figure 5, Utah’s adult                               identify and reach out to areas that are at   1
                                                                                                                Utah Department of Health. Behavioral Risk Factor
smoking rates vary considerably by                               higher risk for tobacco use. For example,     Surveillance System (BRFSS). 2006-2009. Salt Lake City:
                                                                                                               Utah Department of Health. Center for Health Data.
small area and local health district.                            in Salt Lake Valley Health District           (Note: These BRFSS data may underestimate adult
The small area with the highest rate of                          (overall prevalence 11.3%), the small         smoking prevalence because the samples did not include
                                                                                                               mobile phone numbers.)
cigarette smoking was Magna (25.6%);                             area rates range from a low of 2.6% in
Farmington/Centerville had the lowest                            Southeast Sandy to a high of 25.6% in
rate at 1.6%. Small area data are used to                        Magna.1                                                                                         5
Capacity and Infrastructure
                                     The TPCP Builds Local Capacity and Infrastructure
                                     To increase the capacity, effectiveness, and sustainability of local organizations to reduce
                                     tobacco use and improve the health of their communities, the TPCP provides statewide
                                     infrastructure, technical assistance, tobacco-related data, and program evaluation services.
                                     The state and local infrastructure coordinated and supported by the TPCP ensures that
                                     Utahns benefit from a comprehensive tobacco prevention and control program informed by
                                     national standards and tailored to meet local needs.

                                     Statewide Services
                                     The coordination of large-scale projects organized at a state level helps ensure
                                     consistency among local agencies and decreases costs. Some examples of statewide
                                     services are:
    "I am pleased with the           • Carrying out statewide strategic planning and completing required progress reporting
    progress we have made with            to state and federal funders.
    limiting access to tobacco and   • Implementing a statewide system and training for retailer compliance checks to enforce
    nicotine products. The PTA            underage tobacco sales laws that meet national accountability standards for the
                                          Division of Substance Abuse and Mental Health’s federal block grant funding.
    and TPCP are proud of their
                                     • Establishing and maintaining statewide tobacco cessation programs for youth, adults,
    record of protecting kids."
                                          and pregnant women.
                                     • Partnering with regional and statewide health systems that serve low-income Utahns to
    Liz Zentner, Utah PTA Health          provide tobacco cessation counseling and quit medications.
    Commissioner                     • Working with healthcare providers and insurance companies on statewide systems
                                          changes that increase access to tobacco cessation assistance.
                                     • Developing marketing materials and resources for local initiatives and high-risk groups.
                                     • Providing outreach to disparate populations and cultivating community partnerships.

                                     Training and Technical Assistance
                                     To ensure that local partners have access to information about best practices and regional
                                     and national innovations in tobacco prevention and control, as well as opportunities to
                                     network and share plans and experiences with each other, the TPCP offers a variety of
                                     training and technical assistance opportunities. These include:
                                     • Training and technical assistance for the public and partners regarding secondhand
                                          smoke, the Utah Indoor Clean Air Act and Secondhand Smoke Amendments.
                                     • Training for community members to facilitate youth cessation programs.
                                     • Resources and information for public distribution, such as policy guides and
                                          educational materials.
                                     • Tailored assistance for local partners through site visits and regular communication.

                                     Data and Evaluation
                                     To increase access to interventions and services for populations at greatest risk for
                                     tobacco use, the TPCP relies on a variety of tobacco-related data. In addition, the TPCP
                                     requires that its funded programs are rigorously and consistently evaluated. To encourage
                                     the development of data-driven local programs and build local capacity for conducting
                                     evaluations, the TPCP offers the following support to funded partners:
                                     • Statewide and local-level survey data that help identify population groups and
                                         geographic areas with the highest tobacco use prevalence, as well as rates of tobacco-
                                         related illnesses.
                                     • Local health district level data that include smoking rates for adults, youth, and
                                         pregnant women, rates of under-age tobacco sales, etc.
                                     • Technical assistance for planning evaluations, developing tailored surveys or focus
6                                        group guides, and conducting data analysis and writing reports.
Use of Funds FY2010
State TPCP Funding
Utah Tobacco Settlement Account: $3,997,400
Utah Cigarette Tax Restricted Account: $3,131,700
Draw Down of Federal Funds Through TPCP Activities
Federal and private revenues depend on matches with state funds.
•                        TPCP’s work with retailers to prevent underage tobacco sales protects $6.8 million
                         in Synar block grant funding for Utah’s Division of Substance Abuse and Mental
                         Health. The Synar amendment regulates youth access to tobacco products.
•                        TPCP state funds allow the program to secure $1,215,000 in funding from the
                         Centers for Disease Control and Prevention.
•                        The TRUTH marketing campaign draws down $1,540,942 in federal Medicaid                                                                                                                                                Members of TPCP-funded local
                         match.                                                                                                                                                                                                                organizations discuss best practices
                                                                                                                                                                                                                                               to reduce tobacco use in their
In-kind Revenue: Marketing Campaign Added Value
Media vendors donate approximately $2 for every $1 spent by TPCP                                                                                                                                                                               communities. In FY2010, the
on media.                                                                                                                                                                                                                                      TPCP funded more than 70 local
Donated airing of ads, news specials, and other media events: $5,254,526                                                                                                                                                                       partners to oversee and conduct
                                                                                                                                                                                                                                               tobacco prevention and control
Tobacco-related Expenditures                                                                                                                                                                                                                   initiatives. The TPCP’s partners
Tobacco use costs the Utah economy an estimated $663 million annually in smoking-                                                                                                                                                              included local health departments,
related medical costs and lost productivity.1 The tobacco industry spends nearly $60                                                                                                                                                           school districts, businesses, and
million every year to market tobacco products in Utah and recruit new tobacco users.2                                                                                                                                                          community organizations.
Net cigarette and tobacco tax revenue to Utah is estimated at $60 million annually.
Utah’s FY2010 estimated tobacco settlement payment was $45.7 million. The Centers
for Disease Control and Prevention recommends that Utah spend $23.6 million
annually to reduce tobacco use.3 At $8.3 million, the TPCP was funded at 36% of the
recommended level (Figure 6).

Figure 6.
Estimated Annual Cost of Smoking in Utah, Cigarette and Tobacco Tax Revenue,
Tobacco Industry Marketing Expenditures in Utah, Utah Tobacco Settlement Payment,
and CDC Recommended and Actual Annual Investment in Tobacco Prevention and
Control, Latest Available Data

                         400     369.0

                                                                  293.6
                         300                                                                                                                                                                                                                   References:
 Dollars (in millions)


                                                                                                                                                                                                                                               1 National Center for Chronic Disease Prevention and
                                                                                                                                                                                                                                                 Health Promotion. (2010). State Tobacco Activities
                         200                                                                                                                                                                                                                     Tracking and Evaluation (STATE) System. Atlanta, GA:
                                                                                                                                                                                                                                                 U.S. Department of Health and Human Services.
                                                                                                                                                                                                                                                 Retrieved August 9, 2010 from http://apps.nccd.cdc.
                         100                                                                           60.0                              58.7                            45.7                                                                    gov/statesystem/DetailedReport/DetailedReports.
                                                                                                                                                                                                  23.6                 8.3                       aspx.
                           0                                                                                                                                                                                                                   2 Campaign for Tobacco-Free Kids. (2008). The Toll
                                                                                                                                                                                                                                                 of Tobacco in Utah. Retrieved August 9, 2010 from
                                                                                                                                                                                                                       FY10 TPCP Budget
                                                                 Annual Lost Productivity Due to


                                                                                                   FY10 Utah Cigarette and Tobacco


                                                                                                                                                                      FY10 Estimated Utah MSA


                                                                                                                                                                                                CDC Recommended TPCP
                                Annual Direct Medical Expenses


                                                                                                                                     Estimated Annual Utah Tobacco
                                Due to Smoking in Utah (2004)


                                                                                                                                     Industry Marketing Expenditure
                                                                 Smoking in Utah (2000-2004)


                                                                                                                                                                                                                                                 http://www.tobaccofreekids.org/reports/settlements/
                                                                                                                                                                                                  Investment in Utah


                                                                                                                                                                                                                                                 toll.php?StateID=UT.
                                                                                                                                                                                                                                               3 National Center for Chronic Disease Prevention
                                                                                                                                                                              Payment
                                                                                                            Tax Revenue


                                                                                                                                                                                                                                                 and Health Promotion. (2007). Best Practices for
                                                                                                                                                                                                                                                 Comprehensive Tobacco Control Programs - 2007
                                                                                                                                                                                                                                                 Atlanta, GA: U.S. Department of Health and Human
                                                                                                                                                                                                                                                 Services. Retrieved August 9, 2010 from http://www.
                                                                                                                                                                                                                                                 cdc.gov/tobacco/stateandcommunity/best_practices/
                                                                                                                                                                                                                                                 index.htm.


                                                                                                                                                                                                                                                                                               7
Bear River Health Department (BRHD)
                                           Bear River Tobacco-related Trends
                                           • Since the late 1990s, the estimated age-
                                             adjusted adult smoking rate in Bear River
                                             Health District has decreased by 27%.1
                                           • Birth certificates indicate that since
                                             1999, smoking during pregnancy has
                                             decreased by 36%.2
                                           • The estimated rate of children exposed
                                             to secondhand smoke in their homes was
                                             2.8% in 2001 and 1.2%* in 2004-08
                                             (combined data).3
Madison Budge, 4th grade student           • During State Fiscal Year 2010, 7.2%
from Providence Elementary, won              of Bear River stores sold tobacco to
Bear River Health District’s local Truth     underage youth during compliance
From Youth Anti-tobacco Advertising          checks. Since 2001, the illegal sales rate
Contest. Her school principal, 4th           has decreased by 35%.4
grade teacher, the PTA Health and
                                             *This estimate has a relative standard error of >30% and does not meet UDOH standards for reliability.
Safety Commissioner, and staff from
the health department are shown             Tobacco Statistics
presenting her award. The Truth
                                                                                                                               BRHD                   State
from Youth Anti-tobacco Advertising
Contest educates 4th and 5th grade          Adult Cigarette Smoking (2009)1                                                       7.0%                   9.5%
students across the state about
tobacco-related risks and encourages        Youth Cigarette Smoking in Grades 8, 10, 12                                            4.9%                 6.4%
them to create effective anti-tobacco       (2009)5
messages for themselves and their           Pregnant Women Smoking (2008)2                                                         3.8%                 5.4%
peers.
                                            Homes with No Smoking Rule (2006-08)1                                                94.4%                 92.1%
                                            Number of Quit Line Registrations (FY2010)                                              269                6,305
                                            Number of QuitNet Registrations (FY2010)                                                 105               2,290
                                            Number of Participants in the Ending Nicotine                                            180                  689
                                            Dependence Teen Cessation Program (FY2010)
                                            Anti-tobacco Ad Recall in the Past Month (2009)1                                     83.2%                 88.1%


                                           References:
                                           1 Utah Department of Health. Behavioral Risk Factor Surveillance System (BRFSS). 1997-2009. Salt Lake City: Utah
                                             Department of Health. Center for Health Data. (Note: These BRFSS data may underestimate adult smoking
                                             prevalence because the samples did not include mobile phone numbers. Data from the late 1990s refer to
                                             combined BRFSS data from 1997-1999.)
                                           2 Utah Birth Certificate Database. Retrieved July 29, 2010 from Utah Department of Health, Center for Health Data,
                                             Indicator-Based Information System for Public Health web site: http://ibis.health.utah.gov/query/selection/birth/
                                             BirthSelection.html. These smoking rates are based on pregnancies that led to live births.
                                           3 Utah Department of Health. Utah Healthcare Access Survey, 2001-2008. Salt Lake City: Utah Department of
                                             Health. Center for Health Data.
                                           4 Tobacco Prevention and Control Program. (2010). Tobacco Compliance Check summary data, SFY2001-2010,
Bear River Health District Counties: Box     (provisional data). Salt Lake City: Utah Department of Health.
Elder, Cache, Rich                         5 Tobacco Prevention and Control Program. Prevention Needs Assessment Tobacco Questions, 2009. Salt Lake City:
                                             Utah Department of Health.


  8
Central Utah Public Health Department (CUPHD)
Central Utah Tobacco-related Trends
                                                       • Since the late 1990s, the estimated age-
                                                         adjusted adult smoking rate in Central
                                                         Utah Public Health District has decreased
                                                         by 32%.1
                                                       • Birth certificates indicate that since
                                                         1999, smoking during pregnancy has
                                                         remained unchanged.2
                                                       • The estimated rate of children exposed
                                                         to secondhand smoke in their homes
                                                         decreased from 7.4% in 2001 to 5.4%
                                                                                                                       Sheryse Linton won the 2010 Truth
                                                         in 2006-08 (combined data).3
                                                                                                                       from Youth Anti-Tobacco Advertising
                                                       • During State Fiscal Year 2010, 3.5%
                                                                                                                       Contest at Mona Elementary School
                                                         of Central Utah stores sold tobacco
                                                                                                                       in Juab School District. The Truth
                                                         to underage youth during compliance
                                                                                                                       from Youth Anti-tobacco Advertising
                                                         checks. Since 2001, the illegal sales rate
                                                                                                                       Contest educates 4th and 5th grade
                                                         has decreased by 75%.4                                        students across the state about
                                                                                                                       tobacco-related risks and encourages
 Tobacco Statistics                                                                                                    them to create effective anti-tobacco
                                                                                 CUPHD                     State       messages for themselves and their
                                                                                                                       peers.
 Adult Cigarette Smoking (2009)1                                                        11.1%                 9.5%
 Youth Cigarette Smoking in Grades 8, 10, 12                                           7.8%                  6.4%
 (2009)5
 Pregnant Women Smoking (2008)2                                                        9.8%                  5.4%
 Homes with No Smoking Rule (2006-08)1                                                 91.1%                92.1%
 Number of Quit Line Registrations (FY2010)                                               192               6,305
 Number of QuitNet Registrations (FY2010)                                                  64               2,290
 Number of Participants in the Ending Nicotine                                               2                 689
 Dependence Teen Cessation Program (FY2010)
 Anti-tobacco Ad Recall in the Past Month (2009)1                                     92.2%                 88.1%

References:
1 Utah Department of Health. Behavioral Risk Factor Surveillance System (BRFSS). 1997-2009. Salt Lake City: Utah
  Department of Health. Center for Health Data. (Note: These BRFSS data may underestimate adult smoking
  prevalence because the samples did not include mobile phone numbers. Data from the late 1990s refer to
  combined BRFSS data from 1997-1999.)
2 Utah Birth Certificate Database. Retrieved July 29, 2010 from Utah Department of Health, Center for Health Data,
  Indicator-Based Information System for Public Health web site: http://ibis.health.utah.gov/query/selection/birth/
  BirthSelection.html. These smoking rates are based on pregnancies that led to live births.
3 Utah Department of Health. Utah Healthcare Access Survey, 2001-2008. Salt Lake City: Utah Department of
  Health. Center for Health Data.
4 Tobacco Prevention and Control Program. (2010). Tobacco Compliance Check summary data, SFY2001-2010,
  (provisional data). Salt Lake City: Utah Department of Health.                                                      Central Utah Public Health District
5 Tobacco Prevention and Control Program. Prevention Needs Assessment Tobacco Questions, 2009. Salt Lake City:        Counties: Juab, Millard, Piute, Sanpete,
  Utah Department of Health.                                                                                          Sevier, Wayne

                                                                                                                                                             9
Davis County Health Department (DCHD)
                                            Davis County Tobacco-related Trends
                                            • Since the late 1990s, the estimated
                                              age-adjusted adult smoking rate in
                                              Davis County has decreased by 49%.1
                                            • Birth certificates indicate that since
                                              1999, smoking during pregnancy has
                                              decreased by 40%.2
                                            • The estimated rate of children exposed
                                              to secondhand smoke in their homes
                                              has decreased from 4.2% in 2001 to
                                              1.5% in 2006-08 (combined data).3
                                            • During State Fiscal Year 2010, 9.2%
                                              of Davis County stores sold tobacco
Laura York, mother of seven and               to underage youth during compliance
grandmother of seven, smoked for 25           checks. Since 2001, the illegal sales
years before quitting earlier this year.      rate has decreased by 44%.4
In charge of raising her five-year-old
granddaughter, Laura determined, “I
had to make sure I did everything in my      Tobacco Statistics
power to be there for her. She believes                                                                                         DCHD                   State
in me.”
As a volunteer for her granddaughter’s       Adult Cigarette Smoking (2009)1                                                        5.6%                  9.5%
Head Start preschool class, Laura            Youth Cigarette Smoking in Grades 8, 10, 12                                            4.2%                 6.4%
learned about a Davis County Head            (2009)5
Start program that helps families reduce
secondhand smoke exposure and quit           Pregnant Women Smoking (2008)2                                                        4.4%                   5.4%
tobacco use.                                 Homes with No Smoking Rule (2006-08)1                                                93.2%                 92.1%
In August, Laura celebrated being            Number of Quit Line Registrations (FY2010)                                              448                 6,305
smoke-free for nine months. “With the
                                             Number of QuitNet Registrations (FY2010)                                                270                2,290
help and support of both Head Start
and the Utah Tobacco Quit Line, I quit       Number of Participants in the Ending Nicotine                                             111                 689
smoking within about three months and        Dependence Teen Cessation Program (FY2010)
my husband quit five days later! Without
their help, support and encouragement,       Anti-tobacco Ad Recall in the Past Month (2009)1                                     94.0%                 88.1%
I may have never quit.”
                                            References:
Laura is offering help to Head Start        1 Utah Department of Health. Behavioral Risk Factor Surveillance System (BRFSS). 1997-2009. Salt Lake City: Utah
parents who use tobacco and want to           Department of Health. Center for Health Data. (Note: These BRFSS data may underestimate adult smoking
                                              prevalence because the samples did not include mobile phone numbers. Data from the late 1990s refer to
quit. She says, “Now I am part of a           combined BRFSS data from 1997-1999.)
healthier, happier, smoke-free life. My     2 Utah Birth Certificate Database. Retrieved July 29, 2010 from Utah Department of Health, Center for Health Data,
                                              Indicator-Based Information System for Public Health web site: http://ibis.health.utah.gov/query/selection/birth/
life is also a little wealthier! With the     BirthSelection.html. These smoking rates are based on pregnancies that led to live births.
money we are saving, we were able to        3 Utah Department of Health. Utah Healthcare Access Survey, 2001-2008. Salt Lake City: Utah Department of
buy a new car!”                               Health. Center for Health Data.
                                            4 Tobacco Prevention and Control Program. (2010). Tobacco Compliance Check summary data, SFY2001-2010,
                                              (provisional data). Salt Lake City: Utah Department of Health.
       Laura York, Participant in Davis     5 Tobacco Prevention and Control Program. Prevention Needs Assessment Tobacco Questions, 2009. Salt Lake City:
 County Head Start Initiative to Reduce       Utah Department of Health.

         Secondhand Smoke Exposure
10
Salt Lake Valley Health Department (SLVHD)
Salt Lake Valley Tobacco-related Trends
                                                       • Since the late 1990s, the estimated age-
                                                         adjusted adult smoking rate in Salt Lake
                                                         County has decreased by 35%.1
                                                       • Birth certificates indicate that since
                                                         1999, smoking during pregnancy has
                                                         decreased by 39%.2
                                                       • The estimated rate of children exposed
                                                         to secondhand smoke in their homes has
                                                         decreased from 7.6% in 2001 to 2.1%
                                                         in 2006-08 (combined data).3
                                                       • During State Fiscal Year 2010, 5.7%
                                                         of Salt Lake Valley stores sold tobacco
                                                         to underage youth during compliance
                                                         checks. Since 2001, the illegal sales
                                                         rate has decreased by 65%.4
                                                                                                                      South Main Public Health Center,
                                                                                                                      Salt Lake Valley Health Department
 Tobacco Statistics
                                                                                                                      SLVHD’s six Public Health Centers
                                                                                  SLVHD                    State      and the Sanitation and Safety
                                                                                                                      Building (Environmental Health)
 Adult Cigarette Smoking (2009)1                                                      10.9%                   9.5%
                                                                                                                      went tobacco-free on November
 Youth Cigarette Smoking in Grades 8, 10, 12                                            8.5%                 6.4%     20, 2009. SLVHD’s Tobacco-Free
 (2009)5                                                                                                              Health Centers include: South Main
                                                                                                                      Public Health Center (PHC), Ellis R
 Pregnant Women Smoking (2008)2                                                         5.8%                  5.4%
                                                                                                                      Shipp PHC, Rose Park PHC, West
 Homes with No Smoking Rule (2006-08)1                                                90.5%                 92.1%     Jordan PHC, Salt Lake City PHC,
 Number of Quit Line Registrations (FY2010)                                            2,405                 6,305    and South East PHC. Tobacco-free
                                                                                                                      policies protect patrons and visitors
 Number of QuitNet Registrations (FY2010)                                               1,011               2,290     from the negative health effects of
 Number of Participants in the Ending Nicotine                                             90                  689    secondhand smoke.
 Dependence Teen Cessation Program (FY2010)
 Anti-tobacco Ad Recall in the Past Month (2009)1                                     87.9%                 88.1%

References:
1 Utah Department of Health. Behavioral Risk Factor Surveillance System (BRFSS). 1997-2009. Salt Lake City: Utah
  Department of Health. Center for Health Data. (Note: These BRFSS data may underestimate adult smoking
  prevalence because the samples did not include mobile phone numbers. Data from the late 1990s refer to
  combined BRFSS data from 1997-1999.)
2 Utah Birth Certificate Database. Retrieved July 29, 2010 from Utah Department of Health, Center for Health Data,
  Indicator-Based Information System for Public Health web site: http://ibis.health.utah.gov/query/selection/birth/
  BirthSelection.html. These smoking rates are based on pregnancies that led to live births.
3 Utah Department of Health. Utah Healthcare Access Survey, 2001-2008. Salt Lake City: Utah Department of
  Health. Center for Health Data.
4 Tobacco Prevention and Control Program. (2010). Tobacco Compliance Check summary data, SFY2001-2010,
  (provisional data). Salt Lake City: Utah Department of Health.
5 Tobacco Prevention and Control Program. Prevention Needs Assessment Tobacco Questions, 2009. Salt Lake City:
  Utah Department of Health.


                                                                                                                                                      11
Southeastern Utah District Health Department (SEUDHD)
“Thanks to the great efforts of               Southeastern Utah Tobacco-related Trends
SEUDHD, Emery County Sheriff,
and Four Corners Behavior Health              • Since the late 1990s, the estimated
Center, we have drastically reduced             age-adjusted adult smoking rate in
the illegal sale of tobacco products            Southeastern Utah Health District has
to underage youth in Emery County“              decreased by 17%.1
                                              • Birth certificates indicate that since 1999,
Shaun Bell,                                     smoking during pregnancy has decreased
Sheriff Deputy, Emery County                    by 17%.2
                                              • The estimated rate of children exposed
                                                to secondhand smoke in their homes has
                                                decreased from 17.6% in 2001 to 7.1%
                                                in 2006-08 (combined data).3
                                              • During State Fiscal Year 2010, 7.2% of
                                                Southeastern Utah stores sold tobacco
                                                to underage youth during compliance
                                                checks. Since 2001, the illegal sales rate
                                                has decreased by 42%.4
                                               Tobacco Statistics
                                                                                                                            SEUDHD                       State

                                               Adult Cigarette Smoking (2009)1                                                      18.0%                   9.5%
                                               Youth Cigarette Smoking in Grades 8, 10, 12                                            8.3%                 6.4%
                                               (2009)5
                                               Pregnant Women Smoking (2008)2                                                       14.0%                   5.4%
                                               Homes with No Smoking Rule (2006-08)1                                                85.9%                 92.1%
                                               Number of Quit Line Registrations (FY2010)                                               148                6,305
                                               Number of QuitNet Registrations (FY2010)                                                  66               2,290
                                               Number of Participants in the Ending Nicotine                                             24                  689
                                               Dependence Teen Cessation Program (FY2010)
                                               Anti-tobacco Ad Recall in the Past Month (2009)1                                     89.1%                 88.1%

                                              References:
                                              1 Utah Department of Health. Behavioral Risk Factor Surveillance System (BRFSS). 1997-2009. Salt Lake City: Utah
                                                Department of Health. Center for Health Data. (Note: These BRFSS data may underestimate adult smoking
                                                prevalence because the samples did not include mobile phone numbers. Data from the late 1990s refer to
                                                combined BRFSS data from 1997-1999.)
                                              2 Utah Birth Certificate Database. Retrieved July 29, 2010 from Utah Department of Health, Center for Health Data,
                                                Indicator-Based Information System for Public Health web site: http://ibis.health.utah.gov/query/selection/birth/
                                                BirthSelection.html. These smoking rates are based on pregnancies that led to live births.
                                              3 Utah Department of Health. Utah Healthcare Access Survey, 2001-2008. Salt Lake City: Utah Department of
                                                Health. Center for Health Data.
                                              4 Tobacco Prevention and Control Program. (2010). Tobacco Compliance Check summary data, SFY2001-2010,
Southeastern Utah Health District Counties:     (provisional data). Salt Lake City: Utah Department of Health.
                                              5 Tobacco Prevention and Control Program. Prevention Needs Assessment Tobacco Questions, 2009. Salt Lake City:
Carbon, Emery, Grand, San Juan                  Utah Department of Health.


12
Southwest Utah Public Health Department (SWUPHD)
Southwest Utah Tobacco-related Trends
                                                       • Since the late 1990s, the estimated age-
                                                         adjusted adult smoking rate in Southwest
                                                         Utah Public Health District has remained
                                                         unchanged.1
                                                       • Birth certificates indicate that since
                                                         1999, smoking during pregnancy has
                                                         decreased by 26%.2
                                                       • The estimated rate of children exposed
                                                         to secondhand smoke in their homes
                                                         decreased from 3.5% in 2001 to1.9% in
                                                         2006-08 (combined data).3
                                                       • During State Fiscal Year 2010, 6.8%
                                                         of Southwest Utah stores sold tobacco
                                                         to underage youth during compliance
                                                         checks. Since 2001, the illegal sales
                                                         rate has decreased by 71%.4

 Tobacco Statistics
                                                                              SWUPHD              State

 Adult Cigarette Smoking (2009)1                                                       12.3%       9.5%
 Youth Cigarette Smoking in Grades 8, 10, 12                                               6.6%    6.4%
 (2009)5                                                                                                   SWUPHD has been working with
 Pregnant Women Smoking (2008)                     2
                                                                                           5.0%    5.4%    local healthcare providers to address
                                                                                                           tobacco use with their patients.
 Homes with No Smoking Rule (2006-08)1                                                94.6%       92.1%    After participating in tobacco
 Number of Quit Line Registrations (FY2010)                                                388    6,305    policy-related assessments and
                                                                                                           training, Enterprise Valley Medical
 Number of QuitNet Registrations (FY2010)                                                   133   2,290    Clinic (shown below) is working
 Number of Participants in the Ending Nicotine                                              82      689    on improving its tobacco cessation
 Dependence Teen Cessation Program (FY2010)                                                                policies to ensure that patients who
                                                                                                           smoke have easy access to quit
 Anti-tobacco Ad Recall in the Past Month (2009)1                                     84.7%       88.1%    counseling and medications.

References:
1 Utah Department of Health. Behavioral Risk Factor Surveillance System (BRFSS). 1997-
  2009. Salt Lake City: Utah Department of Health. Center for Health Data. (Note: These
  BRFSS data may underestimate adult smoking prevalence because the samples did not
  include mobile phone numbers. Data from the late 1990s refer to combined BRFSS data
  from 1997-1999.)
2 Utah Birth Certificate Database. Retrieved July 29, 2010 from Utah Department of
  Health, Center for Health Data, Indicator-Based Information System for Public Health
  web site: http://ibis.health.utah.gov/query/selection/birth/BirthSelection.html. These
  smoking rates are based on pregnancies that led to live births.
3 Utah Department of Health. Utah Healthcare Access Survey, 2001-2008. Salt Lake City:
  Utah Department of Health. Center for Health Data.
4 Tobacco Prevention and Control Program. (2010). Tobacco Compliance Check summary
  data, SFY2001-2010, (provisional data). Salt Lake City: Utah Department of Health.                      Southwest Utah Public Health District
5 Tobacco Prevention and Control Program. Prevention Needs Assessment Tobacco
  Questions, 2009. Salt Lake City: Utah Department of Health.
                                                                                                          Counties: Beaver, Garfield, Iron, Kane,
                                                                                                          Washington
                                                                                                                                               13
Summit County Public Health Department (SCPHD)
                                            Summit County Tobacco-related Trends
                    1 OF 50
       This body represents one of the 50   • Since the late 1990s, the estimated age-
                  people who                  adjusted adult smoking rate in Summit
               DIE EVERY HOUR                 County Health District has decreased by
               from tobacco use!              22%.1
              Don’t be 1 of the 50!         • Birth certificates indicate that since
                                              1999, smoking during pregnancy has
                                              declined by 40%.2
                                            • The estimated rate of children exposed
                                              to secondhand smoke in their homes has
                                              decreased from 7.5% in 2001 to 2.4% in
                                              2006-08 (combined data).3
                                            • During State Fiscal Year 2010, 3.2%
                                              of Summit County stores sold tobacco
                                              to underage youth during compliance
                                              checks. Since 2001, the illegal sales
                                              rate has decreased by 87%.4

                                             Tobacco Statistics
                                                                                                                             SCPHD                     State

                                             Adult Cigarette Smoking (2009)1                                                        6.9%                  9.5%
The Summit County Health
                                             Youth Cigarette Smoking in Grades 8, 10, 12                                          10.4%                  6.4%
Department and South Summit Peer
                                             (2009)5
Leaders raised awareness of the
harmful effects of tobacco through           Pregnant Women Smoking (2008)2                                                       2.2%*                   5.4%
a school-wide campaign at South              Homes with No Smoking Rule (2006-08)1                                                 92.1%                92.1%
Summit High School. Outlines of
bodies were placed throughout the            Number of Quit Line Registrations (FY2010)                                                 25               6,305
school to represent the number of            Number of QuitNet Registrations (FY2010)                                                    11             2,290
people who die from tobacco use
every hour in the United States. They        Number of Participants in the Ending Nicotine                                                -                689
also placed 1,200 brightly colored           Dependence Teen Cessation Program (FY2010)
lawn flags in the grass at the front of      Anti-tobacco Ad Recall in the Past Month (2009)1                                     84.9%                 88.1%
the school to show how many people
                                            *This estimate has a relative standard error of >30% and does not meet UDOH standards for reliability.
die each day.
                                            References:
                                            1 Utah Department of Health. Behavioral Risk Factor Surveillance System (BRFSS). 1997-2009. Salt Lake City: Utah
                                              Department of Health. Center for Health Data. (Note: These BRFSS data may underestimate adult smoking
                                              prevalence because the samples did not include mobile phone numbers. Data from the late 1990s refer to
                                              combined BRFSS data from 1997-1999.)
                                            2 Utah Birth Certificate Database. Retrieved July 29, 2010 from Utah Department of Health, Center for Health Data,
                                              Indicator-Based Information System for Public Health web site: http://ibis.health.utah.gov/query/selection/birth/
                                              BirthSelection.html. These smoking rates are based on pregnancies that led to live births.
                                            3 Utah Department of Health. Utah Healthcare Access Survey, 2001-2008. Salt Lake City: Utah Department of
                                              Health. Center for Health Data.
                                            4 Tobacco Prevention and Control Program. (2010). Tobacco Compliance Check summary data, SFY2001-2010,
                                              (provisional data). Salt Lake City: Utah Department of Health.
                                            5 Tobacco Prevention and Control Program. Prevention Needs Assessment Tobacco Questions, 2009. Salt Lake City:
                                              Utah Department of Health.


14
Tooele County Health Department (TCHD)
Tooele County Tobacco-related Trends
                                                       • Since the late 1990s, the estimated age-
                                                         adjusted adult smoking rate in Tooele
                                                         County has decreased by 39%.1
                                                       • Birth certificates indicate that since 1999,
                                                         smoking during pregnancy has remained
                                                         unchanged.2
                                                       • The estimated rate of children exposed
                                                         to secondhand smoke in their homes has
                                                         decreased from 9.2% in 2001 to 4.2%
                                                         in 2006-08 (combined data).3
                                                       • During State Fiscal Year 2010, 2.3%
                                                         of Tooele County stores sold tobacco
                                                         to underage youth during compliance
                                                         checks. Since 2001, the illegal sales rate
                                                         has decreased by 90%.4

                                                                                                                      The TRUTH Fairy (Gayle Parker)
 Tobacco Statistics                                                                                                   showed up during prom week at
                                                                                    TCHD                   State      Tooele, Grantsville, and Stansbury
                                                                                                                      High Schools. The TRUTH Fairy
 Adult Cigarette Smoking (2009)1                                                      12.2%                   9.5%    stood outside the schools and
 Youth Cigarette Smoking in Grades 8, 10, 12                                           11.3%                 6.4%     educated students about the
 (2009)5                                                                                                              risks of tobacco use by asking
                                                                                                                      them tobacco-related questions.
 Pregnant Women Smoking (2008)2                                                         9.7%                  5.4%    Prevention education is part of
 Homes with No Smoking Rule (2006-08)1                                                87.5%                 92.1%     the Tooele school district’s efforts
                                                                                                                      to reduce tobacco use through
 Number of Quit Line Registrations (FY2010)                                               141               6,305     a comprehensive, district-wide
 Number of QuitNet Registrations (FY2010)                                                  68               2,290     tobacco-free policy.
 Number of Participants in the Ending Nicotine                                             76                  689
 Dependence Teen Cessation Program (FY2010)
 Anti-tobacco Ad Recall in the Past Month (2009)1                                    88.3%                  88.1%

References:
1 Utah Department of Health. Behavioral Risk Factor Surveillance System (BRFSS). 1997-2009. Salt Lake City: Utah
  Department of Health. Center for Health Data. (Note: These BRFSS data may underestimate adult smoking
  prevalence because the samples did not include mobile phone numbers. Data from the late 1990s refer to
  combined BRFSS data from 1997-1999.)
2 Utah Birth Certificate Database. Retrieved July 29, 2010 from Utah Department of Health, Center for Health Data,
  Indicator-Based Information System for Public Health web site: http://ibis.health.utah.gov/query/selection/birth/
  BirthSelection.html. These smoking rates are based on pregnancies that led to live births.
3 Utah Department of Health. Utah Healthcare Access Survey, 2001-2008. Salt Lake City: Utah Department of
  Health. Center for Health Data.
4 Tobacco Prevention and Control Program. (2010). Tobacco Compliance Check summary data, SFY2001-2010,
  (provisional data). Salt Lake City: Utah Department of Health.
5 Tobacco Prevention and Control Program. Prevention Needs Assessment Tobacco Questions, 2009. Salt Lake City:
  Utah Department of Health.


                                                                                                                                                       15
TriCounty Health Department (TRCHD)
                                      TriCounty Tobacco-related Trends
                                      • Since the late 1990s, the estimated age-
                                        adjusted adult smoking rate in TriCounty
                                        has increased by 11%.1
                                      • Birth certificates indicate that since 1999,
                                        smoking during pregnancy has remained
                                        unchanged.2
                                      • The estimated rate of children exposed
                                        to secondhand smoke in their homes has
                                        decreased from 16.8% in 2001 to 5.9%
   Sarah Howell from Naples             in 2006-08 (combined data).3
   Elementary School was chosen       • During State Fiscal Year 2009, 12.7%
   as the second place winner in        of TriCounty stores sold tobacco to
   the statewide billboard category     underage youth during compliance
   of the Truth from Youth Anti-        checks. Since 2001, the illegal sales rate
   Tobacco Advertising Contest.         has decreased by 31%.4
   The Truth from Youth Anti-
   tobacco Advertising Contest
   educates 4th and 5th grade          Tobacco Statistics
   students across the state about
                                                                                                                       TRCHD                     State
   tobacco-related risks and
   encourages them to create anti-     Adult Cigarette Smoking (2009)1                                                       17.1%                  9.5%
   tobacco messages for themselves
   and their peers.                    Youth Cigarette Smoking in Grades 8, 10, 12                                            6.2%                 6.4%
                                       (2009)5
                                       Pregnant Women Smoking (2008)2                                                        15.3%                  5.4%
                                       Homes with No Smoking Rule (2006-08)1                                                81.8%                 92.1%
                                       Number of Quit Line Registrations (FY2010)                                               123               6,305
                                       Number of QuitNet Registrations (FY2010)                                                  60               2,290
                                       Number of Participants in the Ending Nicotine                                             22                  689
                                       Dependence Teen Cessation Program (FY2010)
                                       Anti-tobacco Ad Recall in the Past Month (2009)1                                     85.3%                 88.1%

                                      References:
                                      1 Utah Department of Health. Behavioral Risk Factor Surveillance System (BRFSS). 1997-2009. Salt Lake City: Utah
                                        Department of Health. Center for Health Data. (Note: These BRFSS data may underestimate adult smoking
                                        prevalence because the samples did not include mobile phone numbers. Data from the late 1990s refer to
                                        combined BRFSS data from 1997-1999.)
                                      2 Utah Birth Certificate Database. Retrieved July 29, 2010 from Utah Department of Health, Center for Health Data,
                                        Indicator-Based Information System for Public Health web site: http://ibis.health.utah.gov/query/selection/birth/
                                        BirthSelection.html. These smoking rates are based on pregnancies that led to live births.
                                      3 Utah Department of Health. Utah Healthcare Access Survey, 2001-2008. Salt Lake City: Utah Department of
                                        Health. Center for Health Data.
                                      4 Tobacco Prevention and Control Program. (2010). Tobacco Compliance Check summary data, SFY2001-2010,
TriCounty Health District Counties:     (provisional data). Salt Lake City: Utah Department of Health.
Daggett, Duchesne, Uintah             5 Tobacco Prevention and Control Program. Prevention Needs Assessment Tobacco Questions, 2009. Salt Lake City:
                                        Utah Department of Health.


16
FY 2010 Annual Report-Tobacco Prevention and Control  Program

Contenu connexe

Similaire à FY 2010 Annual Report-Tobacco Prevention and Control Program

NUR 512: Community Health Program Evaluation
NUR 512: Community Health Program Evaluation NUR 512: Community Health Program Evaluation
NUR 512: Community Health Program Evaluation Julmiste35
 
CDC Update: Joining Forces to Reduce Tobacco and Cancer Among Behavioral Heal...
CDC Update: Joining Forces to Reduce Tobacco and Cancer Among Behavioral Heal...CDC Update: Joining Forces to Reduce Tobacco and Cancer Among Behavioral Heal...
CDC Update: Joining Forces to Reduce Tobacco and Cancer Among Behavioral Heal...sfary
 
Burden ppt final for stakeholder group
Burden ppt final for stakeholder groupBurden ppt final for stakeholder group
Burden ppt final for stakeholder groupBrandon Williams
 
Smoking cessation
Smoking cessation Smoking cessation
Smoking cessation Nimra zaman
 
Fact sheet helping smokers quit saves lives and money 2013 02-13-1
Fact sheet helping smokers quit saves lives and money 2013 02-13-1Fact sheet helping smokers quit saves lives and money 2013 02-13-1
Fact sheet helping smokers quit saves lives and money 2013 02-13-1Tim Feeley
 
Gebrewold_Economics of Tobacco Control_ Final Paper
Gebrewold_Economics of Tobacco Control_ Final PaperGebrewold_Economics of Tobacco Control_ Final Paper
Gebrewold_Economics of Tobacco Control_ Final PaperBineyam Gebrewold
 
Nur512 tobacco prevention and control (1)
Nur512 tobacco prevention and control (1)Nur512 tobacco prevention and control (1)
Nur512 tobacco prevention and control (1)Lynne Mahaffey
 
Gallatin County Healthy Lungs Program
Gallatin County Healthy Lungs ProgramGallatin County Healthy Lungs Program
Gallatin County Healthy Lungs ProgramKaylon L. Peck
 
Impact of the 2009 Tobacco Act on the access and consumption of it
Impact of the 2009 Tobacco Act on the access and consumption of itImpact of the 2009 Tobacco Act on the access and consumption of it
Impact of the 2009 Tobacco Act on the access and consumption of itMalikPinckney86
 
163409237 the-effect-of-cigarette-prices
163409237 the-effect-of-cigarette-prices163409237 the-effect-of-cigarette-prices
163409237 the-effect-of-cigarette-priceshomeworkping7
 
Primary Care Interventions for Prevention and Cessation of Tob.docx
Primary Care Interventions for Prevention and Cessation of Tob.docxPrimary Care Interventions for Prevention and Cessation of Tob.docx
Primary Care Interventions for Prevention and Cessation of Tob.docxLacieKlineeb
 
Rb ll etal cessation assistance in 15 countries
Rb ll etal cessation assistance in 15 countriesRb ll etal cessation assistance in 15 countries
Rb ll etal cessation assistance in 15 countriesAlexander Li
 
FDA Tobacco Slide Presentation
FDA Tobacco Slide PresentationFDA Tobacco Slide Presentation
FDA Tobacco Slide PresentationRobin Bauman
 

Similaire à FY 2010 Annual Report-Tobacco Prevention and Control Program (20)

Control tobacco
Control tobaccoControl tobacco
Control tobacco
 
Tobacco Winnable Battle presentation
Tobacco Winnable Battle presentationTobacco Winnable Battle presentation
Tobacco Winnable Battle presentation
 
NUR 512: Community Health Program Evaluation
NUR 512: Community Health Program Evaluation NUR 512: Community Health Program Evaluation
NUR 512: Community Health Program Evaluation
 
CDC Update: Joining Forces to Reduce Tobacco and Cancer Among Behavioral Heal...
CDC Update: Joining Forces to Reduce Tobacco and Cancer Among Behavioral Heal...CDC Update: Joining Forces to Reduce Tobacco and Cancer Among Behavioral Heal...
CDC Update: Joining Forces to Reduce Tobacco and Cancer Among Behavioral Heal...
 
Tobaccoprogress2012
Tobaccoprogress2012Tobaccoprogress2012
Tobaccoprogress2012
 
Why states should fund comprehensive tc programs
Why states should fund comprehensive tc programsWhy states should fund comprehensive tc programs
Why states should fund comprehensive tc programs
 
Burden ppt final for stakeholder group
Burden ppt final for stakeholder groupBurden ppt final for stakeholder group
Burden ppt final for stakeholder group
 
Smoking cessation
Smoking cessation Smoking cessation
Smoking cessation
 
Jay Collum Tobacco Control & Prevention
Jay Collum Tobacco Control & PreventionJay Collum Tobacco Control & Prevention
Jay Collum Tobacco Control & Prevention
 
BreatheEasy020811
BreatheEasy020811BreatheEasy020811
BreatheEasy020811
 
Fact sheet helping smokers quit saves lives and money 2013 02-13-1
Fact sheet helping smokers quit saves lives and money 2013 02-13-1Fact sheet helping smokers quit saves lives and money 2013 02-13-1
Fact sheet helping smokers quit saves lives and money 2013 02-13-1
 
Gebrewold_Economics of Tobacco Control_ Final Paper
Gebrewold_Economics of Tobacco Control_ Final PaperGebrewold_Economics of Tobacco Control_ Final Paper
Gebrewold_Economics of Tobacco Control_ Final Paper
 
Nur512 tobacco prevention and control (1)
Nur512 tobacco prevention and control (1)Nur512 tobacco prevention and control (1)
Nur512 tobacco prevention and control (1)
 
Gallatin County Healthy Lungs Program
Gallatin County Healthy Lungs ProgramGallatin County Healthy Lungs Program
Gallatin County Healthy Lungs Program
 
Impact of the 2009 Tobacco Act on the access and consumption of it
Impact of the 2009 Tobacco Act on the access and consumption of itImpact of the 2009 Tobacco Act on the access and consumption of it
Impact of the 2009 Tobacco Act on the access and consumption of it
 
163409237 the-effect-of-cigarette-prices
163409237 the-effect-of-cigarette-prices163409237 the-effect-of-cigarette-prices
163409237 the-effect-of-cigarette-prices
 
Primary Care Interventions for Prevention and Cessation of Tob.docx
Primary Care Interventions for Prevention and Cessation of Tob.docxPrimary Care Interventions for Prevention and Cessation of Tob.docx
Primary Care Interventions for Prevention and Cessation of Tob.docx
 
Rb ll etal cessation assistance in 15 countries
Rb ll etal cessation assistance in 15 countriesRb ll etal cessation assistance in 15 countries
Rb ll etal cessation assistance in 15 countries
 
Resources for Health Care Professionals
Resources for Health Care ProfessionalsResources for Health Care Professionals
Resources for Health Care Professionals
 
FDA Tobacco Slide Presentation
FDA Tobacco Slide PresentationFDA Tobacco Slide Presentation
FDA Tobacco Slide Presentation
 

Plus de State of Utah, Salt Lake City

Health Data Transparency: Utah’s All Payer Claims Database
Health Data Transparency: Utah’s All Payer Claims DatabaseHealth Data Transparency: Utah’s All Payer Claims Database
Health Data Transparency: Utah’s All Payer Claims DatabaseState of Utah, Salt Lake City
 
Health Disparities by Utah Legislative District 2019
Health Disparities by Utah Legislative District 2019Health Disparities by Utah Legislative District 2019
Health Disparities by Utah Legislative District 2019State of Utah, Salt Lake City
 
The Utah Geological Survey provides timely scientific information about Utah’...
The Utah Geological Survey provides timely scientific information about Utah’...The Utah Geological Survey provides timely scientific information about Utah’...
The Utah Geological Survey provides timely scientific information about Utah’...State of Utah, Salt Lake City
 
Utah Division of Wildlife Resources Presentation to 2019 Legislature
Utah Division of Wildlife Resources Presentation to 2019 LegislatureUtah Division of Wildlife Resources Presentation to 2019 Legislature
Utah Division of Wildlife Resources Presentation to 2019 LegislatureState of Utah, Salt Lake City
 
Utah Division of Aeronautics Annual Needs and Accomplishments
Utah Division of Aeronautics Annual Needs and AccomplishmentsUtah Division of Aeronautics Annual Needs and Accomplishments
Utah Division of Aeronautics Annual Needs and AccomplishmentsState of Utah, Salt Lake City
 
Fourth Quarter FY2018 Quarterly Report from Utah DCFS
Fourth Quarter FY2018 Quarterly Report from Utah DCFSFourth Quarter FY2018 Quarterly Report from Utah DCFS
Fourth Quarter FY2018 Quarterly Report from Utah DCFSState of Utah, Salt Lake City
 
Transportation Policy and Funding: Historical and Emerging Trends
Transportation Policy and Funding: Historical and Emerging TrendsTransportation Policy and Funding: Historical and Emerging Trends
Transportation Policy and Funding: Historical and Emerging TrendsState of Utah, Salt Lake City
 

Plus de State of Utah, Salt Lake City (20)

Utah Veterinary Diagnostic Laboratory
Utah Veterinary Diagnostic LaboratoryUtah Veterinary Diagnostic Laboratory
Utah Veterinary Diagnostic Laboratory
 
Health Data Transparency: Utah’s All Payer Claims Database
Health Data Transparency: Utah’s All Payer Claims DatabaseHealth Data Transparency: Utah’s All Payer Claims Database
Health Data Transparency: Utah’s All Payer Claims Database
 
Utah Division of Juvenile and Justice Services
Utah Division of Juvenile and Justice ServicesUtah Division of Juvenile and Justice Services
Utah Division of Juvenile and Justice Services
 
Health Disparities by Utah Legislative District 2019
Health Disparities by Utah Legislative District 2019Health Disparities by Utah Legislative District 2019
Health Disparities by Utah Legislative District 2019
 
Localscapes
LocalscapesLocalscapes
Localscapes
 
Status of Translocated Tortoises in Southwest Utah
Status of Translocated Tortoises in Southwest UtahStatus of Translocated Tortoises in Southwest Utah
Status of Translocated Tortoises in Southwest Utah
 
The Logan River Observatory
The Logan River ObservatoryThe Logan River Observatory
The Logan River Observatory
 
Utah Strategic Workforce Presentation
Utah Strategic Workforce PresentationUtah Strategic Workforce Presentation
Utah Strategic Workforce Presentation
 
The Utah Geological Survey provides timely scientific information about Utah’...
The Utah Geological Survey provides timely scientific information about Utah’...The Utah Geological Survey provides timely scientific information about Utah’...
The Utah Geological Survey provides timely scientific information about Utah’...
 
Utah Forestry, Fire and State Lands 2019
Utah Forestry, Fire and State Lands 2019Utah Forestry, Fire and State Lands 2019
Utah Forestry, Fire and State Lands 2019
 
Utah Division of Wildlife Resources Presentation to 2019 Legislature
Utah Division of Wildlife Resources Presentation to 2019 LegislatureUtah Division of Wildlife Resources Presentation to 2019 Legislature
Utah Division of Wildlife Resources Presentation to 2019 Legislature
 
UDOT Presentation to 2019 Legislature
UDOT Presentation to 2019 LegislatureUDOT Presentation to 2019 Legislature
UDOT Presentation to 2019 Legislature
 
Utah System of Technical Colleges
Utah System of Technical CollegesUtah System of Technical Colleges
Utah System of Technical Colleges
 
Public Water System Identification in Utah
Public Water System Identification in UtahPublic Water System Identification in Utah
Public Water System Identification in Utah
 
State of Utah Suicide Prevention
State of Utah Suicide PreventionState of Utah Suicide Prevention
State of Utah Suicide Prevention
 
Utah Division of Aeronautics Annual Needs and Accomplishments
Utah Division of Aeronautics Annual Needs and AccomplishmentsUtah Division of Aeronautics Annual Needs and Accomplishments
Utah Division of Aeronautics Annual Needs and Accomplishments
 
Fourth Quarter FY2018 Quarterly Report from Utah DCFS
Fourth Quarter FY2018 Quarterly Report from Utah DCFSFourth Quarter FY2018 Quarterly Report from Utah DCFS
Fourth Quarter FY2018 Quarterly Report from Utah DCFS
 
Update on FirstNet in Utah
Update on FirstNet in UtahUpdate on FirstNet in Utah
Update on FirstNet in Utah
 
Energy Incentives in Utah - 2018 Audit
Energy Incentives in Utah - 2018 AuditEnergy Incentives in Utah - 2018 Audit
Energy Incentives in Utah - 2018 Audit
 
Transportation Policy and Funding: Historical and Emerging Trends
Transportation Policy and Funding: Historical and Emerging TrendsTransportation Policy and Funding: Historical and Emerging Trends
Transportation Policy and Funding: Historical and Emerging Trends
 

FY 2010 Annual Report-Tobacco Prevention and Control Program

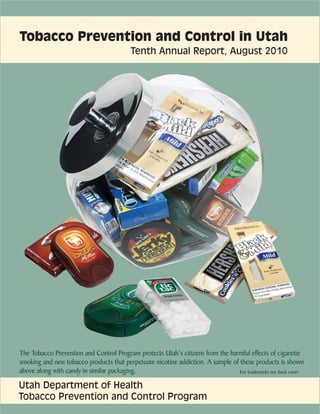
  • 1. Tobacco Prevention and Control in Utah Tenth Annual Report, August 2010 The Tobacco Prevention and Control Program protects Utah’s citizens from the harmful effects of cigarette smoking and new tobacco products that perpetuate nicotine addiction. A sample of these products is shown above along with candy in similar packaging. For trademarks see back cover Utah Department of Health Tobacco Prevention and Control Program
  • 2. TPCP Update Since Master Settlement 2010 Highlights for TPCP Goals Agreement (MSA) funds were allocated The Tobacco Prevention and Control Program (TPCP) at the Utah to the TPCP in 1999, Department of Health and its partners use comprehensive strategies to Utah’s smoking rates reduce tobacco use and tobacco-related disease and death. Major program among adults, youth, outcomes are listed below: and pregnant women Helping Tobacco Users Quit have declined by approximately one With an age-adjusted adult smoking rate of 9.5% (2009), Utah continues to be third.1,3,5 the only state that has reached the national Healthy People 2010 objective of reducing smoking to less than 12%.1 Still, more than 200,000 youth and adult Children’s exposure Utahns smoke and need help quitting. to secondhand smoke in their homes has ● The TRUTH campaign continued to reach adults with messages that encouraged declined by two thirds quit attempts and informed about quit services. In 2010, 96% of Utah adult smokers since 2001.4 reported seeing anti-tobacco ads at least once a month during the past six months.2 Ninety-four percent were aware of the Utah Tobacco Quit Line and 65% knew about At 5% in 2008, the the online quit service, Utah QuitNet. Adult smokers who were exposed to anti- smoking rate among tobacco ads were more likely to know about quit services or be in the process of pregnant women is quitting than smokers who were not exposed (combined data 2006-2010).2 at its lowest recorded ● During FY2010, nearly 11,000 Utahns used TPCP-funded tobacco cessation services. Tailored services were offered for adults, teens, and pregnant women. level since 1989.5 These quit services greatly increased tobacco users’ quit success. ● Since the Utah Tobacco Quit Line began in 2001, more than 58,000 Utahns have registered for services. In FY2010, the Quit Line served an average of 525 Utahns per month with free counseling and tailored quit information. ● In FY2010, nearly 700 Utah youth tobacco users participated in the Utah- developed teen cessation class, Ending Nicotine Dependence. Nearly 16% of participants reported quitting tobacco by the last class and an additional 44% reported reducing their tobacco use. References: Preventing Youth From Starting to Use Tobacco 1 Utah Department of Health. Behavioral Risk Factor Surveillance System (BRFSS). 1989-2009. Salt Lake City: Utah Department of Health. Center for Health In 2009, 8.5% of Utah high school students (grades 9-12) reported that they had Data. (Note: These BRFSS data may underestimate smoked in the past month. Utah’s youth smoking rate is less than half the national adult smoking prevalence because the samples did not include mobile phone numbers.) rate of 19.5%.3 2 West, DR et al. (2009). 2009-2010 Evaluation of Utah’s Tobacco Prevention and Control Program. ● In 2010, 93% of Utah youth ages 13 to 17 reported that they saw or heard Denver: University of Colorado Denver, Department of Family Medicine. anti-tobacco ads at least once a month during the past six months, and 90% 3 YRBSS: Youth Risk Behavior Surveillance System. said the TV ads made them think of the negative effects of tobacco use.2 Youth Online: Comprehensive Results. Retrieved ● Since 2002, 19 of Utah’s 41 school districts worked with TPCP and local health August 2, 2010, from http://apps.nccd.cdc.gov/ yrbss/. departments to strengthen school tobacco-free policies, tobacco education, and policy 4 Utah Department of Health. Utah Health Care Access enforcement. These districts serve more than 216,000 students in 361 schools. Survey, 2001-2008. Salt Lake City: Utah Department of Health. Center for Health Data. ● Since 2001, illegal tobacco sales to underage youth during compliance checks 5 Utah Birth Certificate Database. Retrieved July 29, declined by 61%. At 6.2%, the rate of non-compliance is at its lowest recorded level. 2010 from Utah Department of Health, Center for Health Data, Indicator-Based Information System for To decrease the rate of non-compliance, local health departments educated nearly Public Health web site: http://ibis.health.utah.gov. 1,000 Utah retail clerks about Utah’s tobacco access laws. These smoking rates are based on pregnancies that led ● The Phoenix Alliance, Utah’s statewide youth anti-tobacco advocacy group, educated to live births. Utahns about new tobacco products and their packaging that is similar to candy. 2
  • 3. TPCP Update Protecting Utahns From Secondhand Smoke More than 93% of Utahns have established rules against smoking in their homes, and 98% of Utah children live in smoke-free homes (2008).1,4 ● In FY2010, TPCP’s partners assisted 22 worksites, nine health care entities, 17 outdoor recreation venues, and two school districts with passing policies that protect Utahns from secondhand smoke exposure. ● In the last year, the number of smoke-free apartment and condominium units in TPCP’s Smoke-free Apartment and Condominium Statewide Directory grew by 19% to nearly 16,000 in 11 Utah counties. ● In addition to these private properties, two public housing authorities went smoke-free this year, encompassing 22 housing communities in Davis and Utah Counties. Eliminating Tobacco-related Disparities Utahns of lower socioeconomic status and in certain racial and ethnic populations smoke cigarettes at higher rates than the general population. For example, Utahns (age 25 and older) with less than a high school education were nearly 10 times more likely to report cigarette smoking than Utahns with a college degree.1 ● More than 1,500 low-income, uninsured, or Medicaid-insured Utahns, including 1,200 pregnant women, received free counseling and prescriptions “Dear Me” television advertisements for medications to help them quit using tobacco in FY2010. More than 27% from The TRUTH campaign motivated of participants in the TPCP-funded Medicaid program for pregnant women quit Utah smokers to quit through real using tobacco and 24% reduced their tobacco use. life stories of the struggles and ● TPCP promoted tobacco cessation counseling and medications to Medicaid successes with overcoming nicotine clients. Since 2006, the number of Medicaid clients who sought help quitting addiction. In addition, the ads informed tripled, and totaled more than 3,000 in FY2010. Utahns about local resources to quit ● The four TPCP-funded Ethnic Tobacco and Health Networks worked on smoking. The “Dear Me” campaign tobacco prevention with unique strategies addressing the health, spiritual, and was developed by the Washington social implications of tobacco use in their populations. State Department of Health Tobacco Prevention and Control Program. After reviewing Washington’s research on the development and effectiveness of the Looking Ahead to FY2011: TPCP Efforts Continue “Dear Me” campaign, the Utah TPCP Despite many successes, more must be done to help those at greatest risk for formed a collaborative agreement with tobacco-related disease and death, and to combat new tobacco products that Washington State to obtain the ads at threaten public health. minimal cost. • TPCP has partnered with the State Division of Substance Abuse and Mental Health to develop policies that will help Utahns with mental health and substance abuse problems to quit tobacco. • TPCP has launched efforts to educate the public about new tobacco and nicotine products that may lead to increased tobacco use among youth and perpetuate nicotine addiction among those who want to quit smoking. • TPCP and its partners will continue to assist community-based agencies to prevent and control tobacco use among racial, ethnic and sexual minorities in Utah, as well as the disabled population. 3
  • 4. Tobacco Use in Utah Figure 1. Smoking Rates and Health Consequences Percent of Adults Who Reported Current Cigarette Smoking, Utah 1999-2009 Adult Smoking Exposure to Secondhand Smoke (Age-adjusted) 25 • In 2009, Utah’s age-adjusted adult • Since 2001, the percentage of 20 smoking rate was 9.5% (Figure 1). children (age 17 and younger) 13.5 13.0 exposed to secondhand smoke at 12.5 12.5 Percentage Since 1999, the rate has declined by 11.9 11.2 11.2 10.1 15 9.5 9.5 9.1 30%.1 If rates had not declined since home declined by 68% (from 6.0% in 10 5 1999, Utah would have approximately 2001 to 1.9% in 2008).5 If the rate 0 80,000 additional adult smokers had not declined, 35,000 additional today. Utah children would suffer from the 1999 2001 2003 2005 2007 2009 consequences of secondhand smoke Year • Smoking disproportionately impacts today. Source: Utah BRFSS1 Utahns with lower incomes. In 2009, Figure 2. 20% of Utah adults with a household • Since 1999, the rate of Utah adults Percent of Pregnant Women Who who have a rule against smoking in income of less than $25,000 reported Reported Cigarette Smoking, Utah current smoking.1 In comparison, only their homes has increased from 87% 1999-2008 25 6% of Utah adults with a household to 93%.1 20 income of $75,000 or higher • People living in rented homes are Percentage 15 reported current smoking.1 twice as likely to be exposed to 8.2 8.1 7.6 7.1 6.5 6.3 5.9 5.9 5.8 10 5.4 Smoking Among Pregnant Women secondhand smoke in their homes as 5 people living in owned homes (2008).5 0 • Since 1999, smoking among pregnant 1999 2001 2003 2005 2007 women decreased by 34% (Figure Tobacco-related Disease and Death Year 2). At 5.4%, the 2008 smoking rate Source: Utah Birth Certificates2 for pregnant women is at its lowest • Smoking is the leading cause of lung recorded level.2 cancer death in men and women. Figure 3. Percent of High School Students Who Other diseases caused by smoking Reported Current Cigarette Smoking, • Pregnant women in their teens and include esophageal, laryngeal, oral, Utah 1999-2009 (Odd Years) pregnant women with less than a high and throat cancers; cervical, bladder, 25 school education continue to report kidney, pancreatic, and stomach 20 smoking rates of 10% or higher.2 cancers; acute myeloid leukemia; Percentage 11.9 15 8.3 7.3 7.4 7.9 8.5 pneumonia; chronic lung disease; 10 Youth Smoking cataracts; periodontitis; aortic 5 aneurysm; and coronary heart and 0 • Since 1991, the percentage of Utah cardiovascular disease. high school students who had ever 1999 2001 2003 2005 2007 2009 tried cigarette smoking declined by • Utah’s lung and bronchus cancer Year 52%.3 Source: Utah YRBS 3 incidence has decreased significantly since 1999 (Figure 4).4 Figure 4. • Current smoking among high school Age-adjusted Cancer Incidence Rates for students decreased from 12% in 1999 • Despite this progress, more than Lung and Bronchus Cancer, Incidence per to 8% in 2001. Since 2001, it has 100,000 Population, Utah 1999-2007 1,200 Utahns age 35 or older die remained unchanged at 7 to 8%.3 each year as a result of tobacco use.6 60 50 References: 34.6 31.3 31.1 30.1 29.0 28.8 Utah Department of Health. Behavioral Risk Factor Surveillance System (BRFSS). 1999-2009. Salt Lake City: Utah Department of 28.3 28.0 Percentage 1 26.2 40 Health. Center for Health Data. (Note: These BRFSS data may underestimate adult smoking prevalence because the samples did not 30 include mobile phone numbers.) 20 2 Utah Birth Certificate Database. Retrieved July 29, 2010 from Utah Department of Health, Center for Health Data, Indicator-Based 10 Information System for Public Health web site: http://ibis.health.utah.gov. These smoking rates are based on pregnancies that led to 0 live births. 3 YRBSS: Youth Risk Behavior Surveillance System. Youth Online: Comprehensive Results. Retrieved August 2, 2010, from http://apps. 1999 2001 2003 2005 2007 nccd.cdc.gov/yrbss/. 4 Utah Cancer Registry. Retrieved July 12, 2010 from Utah Department of Health, Center for Health Data, Indicator-Based Information Year System for Public Health web site: http://ibis.health.utah.gov. 4 Source: Utah Cancer Registry 5 Utah Department of Health. Utah Healthcare Access Survey, 2001-2008. Salt Lake City: Utah Department of Health. Center for Health Data. 6 National Center for Chronic Disease Prevention and Health Promotion. (2010). Tobacco Control State Highlights 2010. Atlanta, 4 GA: U.S. Department of Health and Human Services. Retrieved August 19, 2010 from http://www.cdc.gov/tobacco/data_statistics/ state_data/state_highlights/2010/supplement/index.htm.
  • 5. Tobacco Use in Utah Smoking Rates by Local Health Districts and Small Areas Figure 5. Current Cigarette Smoking by Local Health District, Small Area, Utah, and U.S. Adults, 2006-2009, (Aggregate Data, Age-adjusted) Utah State Rate 9.75% U.S. Rate 19.04% Bear River HD Other Box Elder Co. (2) Logan (3) Other Cache/Rich Co. (4) Brigham City (1) Central Utah HD Juab/Millard/Sanpete Co. (54) Sevier/Piute/Wayne Co. (55) Davis County HD * Farmington/Centerville (14) * Syracuse/Kaysville (13) Bountiful (16) * Woods Cross/North SL (15) Local Health District Layton (12) Clearfield/Hill AFB (11) Small Area Salt Lake Valley HD * Sandy, Southeast (38) * South Jordan (35) * Foothill/U of U (19) Riverton/Draper (39) West Jordan/Copperton (34) Holladay (27) * Sandy, Northeast (37) Millcreek (26) Cottonwood (28) Avenues (18) West Jordan North (33) Sandy Center (36) Downtown Salt Lake (24) Murray (31) Kearns (29) Note: Local health districts are represented by Midvale (32) tan bars. The green bars beneath indicate small West Valley West (22) Taylorsville (30) areas within that district. For more details about Glendale (21) small area definitions, see the Utah Behavioral South Salt Lake (25) Risk Factor Surveillance System Small Area West Valley East (23) Rose Park (17) Report 2001–2005, Appendix C: Small Area Magna (20) Definitions and Key Maps. The horizontal lines Southeastern Utah HD Grand/San Juan Co. (57) extending from the bars indicate 95% confidence Carbon/Emery Co. (56) intervals. Confidence intervals are used to show Southwest Utah HD Other Washington County the reliability of an estimate. A 95% confidence St. George (58) interval means that 95% of the time, the given Other Southwest District (61) interval will contain the true parameter value. Cedar City (60) Summit County HD (51) *These estimates have relative standard errors Tooele County HD (40) of >30% and do not meet UDOH standards for TriCounty HD (53) Utah County HD reliability. East Orem (46) ** **The estimates for Provo/BYU, and East and Provo/BYU (47) ** West Orem have been suppressed because the * American Fork/Alpine (42) * Lehi/Cedar Valley (41) relative standard error was greater than 50% West Orem (45) ** or the relative standard error could not be Pleasant Grove/Lindon (43) * Utah Co. South (50) determined. The combined adult smoking rate Springville/Spanish Fork (49) for Provo/BYU, and East and West Orem (age- Provo South (48) North Orem (44) adjusted, 2006-2009) was 2.4%. Wasatch County HD (52) Weber-Morgan HD Morgan/East Weber Co. (6) Riverdale (10) South Ogden (8) Roy/Hooper (9) Downtown Ogden (7) Ben Lomond (5) 0 5 10 15 20 25 30 35 40 Reference: As shown in Figure 5, Utah’s adult identify and reach out to areas that are at 1 Utah Department of Health. Behavioral Risk Factor smoking rates vary considerably by higher risk for tobacco use. For example, Surveillance System (BRFSS). 2006-2009. Salt Lake City: Utah Department of Health. Center for Health Data. small area and local health district. in Salt Lake Valley Health District (Note: These BRFSS data may underestimate adult The small area with the highest rate of (overall prevalence 11.3%), the small smoking prevalence because the samples did not include mobile phone numbers.) cigarette smoking was Magna (25.6%); area rates range from a low of 2.6% in Farmington/Centerville had the lowest Southeast Sandy to a high of 25.6% in rate at 1.6%. Small area data are used to Magna.1 5
  • 6. Capacity and Infrastructure The TPCP Builds Local Capacity and Infrastructure To increase the capacity, effectiveness, and sustainability of local organizations to reduce tobacco use and improve the health of their communities, the TPCP provides statewide infrastructure, technical assistance, tobacco-related data, and program evaluation services. The state and local infrastructure coordinated and supported by the TPCP ensures that Utahns benefit from a comprehensive tobacco prevention and control program informed by national standards and tailored to meet local needs. Statewide Services The coordination of large-scale projects organized at a state level helps ensure consistency among local agencies and decreases costs. Some examples of statewide services are: "I am pleased with the • Carrying out statewide strategic planning and completing required progress reporting progress we have made with to state and federal funders. limiting access to tobacco and • Implementing a statewide system and training for retailer compliance checks to enforce nicotine products. The PTA underage tobacco sales laws that meet national accountability standards for the Division of Substance Abuse and Mental Health’s federal block grant funding. and TPCP are proud of their • Establishing and maintaining statewide tobacco cessation programs for youth, adults, record of protecting kids." and pregnant women. • Partnering with regional and statewide health systems that serve low-income Utahns to Liz Zentner, Utah PTA Health provide tobacco cessation counseling and quit medications. Commissioner • Working with healthcare providers and insurance companies on statewide systems changes that increase access to tobacco cessation assistance. • Developing marketing materials and resources for local initiatives and high-risk groups. • Providing outreach to disparate populations and cultivating community partnerships. Training and Technical Assistance To ensure that local partners have access to information about best practices and regional and national innovations in tobacco prevention and control, as well as opportunities to network and share plans and experiences with each other, the TPCP offers a variety of training and technical assistance opportunities. These include: • Training and technical assistance for the public and partners regarding secondhand smoke, the Utah Indoor Clean Air Act and Secondhand Smoke Amendments. • Training for community members to facilitate youth cessation programs. • Resources and information for public distribution, such as policy guides and educational materials. • Tailored assistance for local partners through site visits and regular communication. Data and Evaluation To increase access to interventions and services for populations at greatest risk for tobacco use, the TPCP relies on a variety of tobacco-related data. In addition, the TPCP requires that its funded programs are rigorously and consistently evaluated. To encourage the development of data-driven local programs and build local capacity for conducting evaluations, the TPCP offers the following support to funded partners: • Statewide and local-level survey data that help identify population groups and geographic areas with the highest tobacco use prevalence, as well as rates of tobacco- related illnesses. • Local health district level data that include smoking rates for adults, youth, and pregnant women, rates of under-age tobacco sales, etc. • Technical assistance for planning evaluations, developing tailored surveys or focus 6 group guides, and conducting data analysis and writing reports.
  • 7. Use of Funds FY2010 State TPCP Funding Utah Tobacco Settlement Account: $3,997,400 Utah Cigarette Tax Restricted Account: $3,131,700 Draw Down of Federal Funds Through TPCP Activities Federal and private revenues depend on matches with state funds. • TPCP’s work with retailers to prevent underage tobacco sales protects $6.8 million in Synar block grant funding for Utah’s Division of Substance Abuse and Mental Health. The Synar amendment regulates youth access to tobacco products. • TPCP state funds allow the program to secure $1,215,000 in funding from the Centers for Disease Control and Prevention. • The TRUTH marketing campaign draws down $1,540,942 in federal Medicaid Members of TPCP-funded local match. organizations discuss best practices to reduce tobacco use in their In-kind Revenue: Marketing Campaign Added Value Media vendors donate approximately $2 for every $1 spent by TPCP communities. In FY2010, the on media. TPCP funded more than 70 local Donated airing of ads, news specials, and other media events: $5,254,526 partners to oversee and conduct tobacco prevention and control Tobacco-related Expenditures initiatives. The TPCP’s partners Tobacco use costs the Utah economy an estimated $663 million annually in smoking- included local health departments, related medical costs and lost productivity.1 The tobacco industry spends nearly $60 school districts, businesses, and million every year to market tobacco products in Utah and recruit new tobacco users.2 community organizations. Net cigarette and tobacco tax revenue to Utah is estimated at $60 million annually. Utah’s FY2010 estimated tobacco settlement payment was $45.7 million. The Centers for Disease Control and Prevention recommends that Utah spend $23.6 million annually to reduce tobacco use.3 At $8.3 million, the TPCP was funded at 36% of the recommended level (Figure 6). Figure 6. Estimated Annual Cost of Smoking in Utah, Cigarette and Tobacco Tax Revenue, Tobacco Industry Marketing Expenditures in Utah, Utah Tobacco Settlement Payment, and CDC Recommended and Actual Annual Investment in Tobacco Prevention and Control, Latest Available Data 400 369.0 293.6 300 References: Dollars (in millions) 1 National Center for Chronic Disease Prevention and Health Promotion. (2010). State Tobacco Activities 200 Tracking and Evaluation (STATE) System. Atlanta, GA: U.S. Department of Health and Human Services. Retrieved August 9, 2010 from http://apps.nccd.cdc. 100 60.0 58.7 45.7 gov/statesystem/DetailedReport/DetailedReports. 23.6 8.3 aspx. 0 2 Campaign for Tobacco-Free Kids. (2008). The Toll of Tobacco in Utah. Retrieved August 9, 2010 from FY10 TPCP Budget Annual Lost Productivity Due to FY10 Utah Cigarette and Tobacco FY10 Estimated Utah MSA CDC Recommended TPCP Annual Direct Medical Expenses Estimated Annual Utah Tobacco Due to Smoking in Utah (2004) Industry Marketing Expenditure Smoking in Utah (2000-2004) http://www.tobaccofreekids.org/reports/settlements/ Investment in Utah toll.php?StateID=UT. 3 National Center for Chronic Disease Prevention Payment Tax Revenue and Health Promotion. (2007). Best Practices for Comprehensive Tobacco Control Programs - 2007 Atlanta, GA: U.S. Department of Health and Human Services. Retrieved August 9, 2010 from http://www. cdc.gov/tobacco/stateandcommunity/best_practices/ index.htm. 7
  • 8. Bear River Health Department (BRHD) Bear River Tobacco-related Trends • Since the late 1990s, the estimated age- adjusted adult smoking rate in Bear River Health District has decreased by 27%.1 • Birth certificates indicate that since 1999, smoking during pregnancy has decreased by 36%.2 • The estimated rate of children exposed to secondhand smoke in their homes was 2.8% in 2001 and 1.2%* in 2004-08 (combined data).3 Madison Budge, 4th grade student • During State Fiscal Year 2010, 7.2% from Providence Elementary, won of Bear River stores sold tobacco to Bear River Health District’s local Truth underage youth during compliance From Youth Anti-tobacco Advertising checks. Since 2001, the illegal sales rate Contest. Her school principal, 4th has decreased by 35%.4 grade teacher, the PTA Health and *This estimate has a relative standard error of >30% and does not meet UDOH standards for reliability. Safety Commissioner, and staff from the health department are shown Tobacco Statistics presenting her award. The Truth BRHD State from Youth Anti-tobacco Advertising Contest educates 4th and 5th grade Adult Cigarette Smoking (2009)1 7.0% 9.5% students across the state about tobacco-related risks and encourages Youth Cigarette Smoking in Grades 8, 10, 12 4.9% 6.4% them to create effective anti-tobacco (2009)5 messages for themselves and their Pregnant Women Smoking (2008)2 3.8% 5.4% peers. Homes with No Smoking Rule (2006-08)1 94.4% 92.1% Number of Quit Line Registrations (FY2010) 269 6,305 Number of QuitNet Registrations (FY2010) 105 2,290 Number of Participants in the Ending Nicotine 180 689 Dependence Teen Cessation Program (FY2010) Anti-tobacco Ad Recall in the Past Month (2009)1 83.2% 88.1% References: 1 Utah Department of Health. Behavioral Risk Factor Surveillance System (BRFSS). 1997-2009. Salt Lake City: Utah Department of Health. Center for Health Data. (Note: These BRFSS data may underestimate adult smoking prevalence because the samples did not include mobile phone numbers. Data from the late 1990s refer to combined BRFSS data from 1997-1999.) 2 Utah Birth Certificate Database. Retrieved July 29, 2010 from Utah Department of Health, Center for Health Data, Indicator-Based Information System for Public Health web site: http://ibis.health.utah.gov/query/selection/birth/ BirthSelection.html. These smoking rates are based on pregnancies that led to live births. 3 Utah Department of Health. Utah Healthcare Access Survey, 2001-2008. Salt Lake City: Utah Department of Health. Center for Health Data. 4 Tobacco Prevention and Control Program. (2010). Tobacco Compliance Check summary data, SFY2001-2010, Bear River Health District Counties: Box (provisional data). Salt Lake City: Utah Department of Health. Elder, Cache, Rich 5 Tobacco Prevention and Control Program. Prevention Needs Assessment Tobacco Questions, 2009. Salt Lake City: Utah Department of Health. 8
  • 9. Central Utah Public Health Department (CUPHD) Central Utah Tobacco-related Trends • Since the late 1990s, the estimated age- adjusted adult smoking rate in Central Utah Public Health District has decreased by 32%.1 • Birth certificates indicate that since 1999, smoking during pregnancy has remained unchanged.2 • The estimated rate of children exposed to secondhand smoke in their homes decreased from 7.4% in 2001 to 5.4% Sheryse Linton won the 2010 Truth in 2006-08 (combined data).3 from Youth Anti-Tobacco Advertising • During State Fiscal Year 2010, 3.5% Contest at Mona Elementary School of Central Utah stores sold tobacco in Juab School District. The Truth to underage youth during compliance from Youth Anti-tobacco Advertising checks. Since 2001, the illegal sales rate Contest educates 4th and 5th grade has decreased by 75%.4 students across the state about tobacco-related risks and encourages Tobacco Statistics them to create effective anti-tobacco CUPHD State messages for themselves and their peers. Adult Cigarette Smoking (2009)1 11.1% 9.5% Youth Cigarette Smoking in Grades 8, 10, 12 7.8% 6.4% (2009)5 Pregnant Women Smoking (2008)2 9.8% 5.4% Homes with No Smoking Rule (2006-08)1 91.1% 92.1% Number of Quit Line Registrations (FY2010) 192 6,305 Number of QuitNet Registrations (FY2010) 64 2,290 Number of Participants in the Ending Nicotine 2 689 Dependence Teen Cessation Program (FY2010) Anti-tobacco Ad Recall in the Past Month (2009)1 92.2% 88.1% References: 1 Utah Department of Health. Behavioral Risk Factor Surveillance System (BRFSS). 1997-2009. Salt Lake City: Utah Department of Health. Center for Health Data. (Note: These BRFSS data may underestimate adult smoking prevalence because the samples did not include mobile phone numbers. Data from the late 1990s refer to combined BRFSS data from 1997-1999.) 2 Utah Birth Certificate Database. Retrieved July 29, 2010 from Utah Department of Health, Center for Health Data, Indicator-Based Information System for Public Health web site: http://ibis.health.utah.gov/query/selection/birth/ BirthSelection.html. These smoking rates are based on pregnancies that led to live births. 3 Utah Department of Health. Utah Healthcare Access Survey, 2001-2008. Salt Lake City: Utah Department of Health. Center for Health Data. 4 Tobacco Prevention and Control Program. (2010). Tobacco Compliance Check summary data, SFY2001-2010, (provisional data). Salt Lake City: Utah Department of Health. Central Utah Public Health District 5 Tobacco Prevention and Control Program. Prevention Needs Assessment Tobacco Questions, 2009. Salt Lake City: Counties: Juab, Millard, Piute, Sanpete, Utah Department of Health. Sevier, Wayne 9
  • 10. Davis County Health Department (DCHD) Davis County Tobacco-related Trends • Since the late 1990s, the estimated age-adjusted adult smoking rate in Davis County has decreased by 49%.1 • Birth certificates indicate that since 1999, smoking during pregnancy has decreased by 40%.2 • The estimated rate of children exposed to secondhand smoke in their homes has decreased from 4.2% in 2001 to 1.5% in 2006-08 (combined data).3 • During State Fiscal Year 2010, 9.2% of Davis County stores sold tobacco Laura York, mother of seven and to underage youth during compliance grandmother of seven, smoked for 25 checks. Since 2001, the illegal sales years before quitting earlier this year. rate has decreased by 44%.4 In charge of raising her five-year-old granddaughter, Laura determined, “I had to make sure I did everything in my Tobacco Statistics power to be there for her. She believes DCHD State in me.” As a volunteer for her granddaughter’s Adult Cigarette Smoking (2009)1 5.6% 9.5% Head Start preschool class, Laura Youth Cigarette Smoking in Grades 8, 10, 12 4.2% 6.4% learned about a Davis County Head (2009)5 Start program that helps families reduce secondhand smoke exposure and quit Pregnant Women Smoking (2008)2 4.4% 5.4% tobacco use. Homes with No Smoking Rule (2006-08)1 93.2% 92.1% In August, Laura celebrated being Number of Quit Line Registrations (FY2010) 448 6,305 smoke-free for nine months. “With the Number of QuitNet Registrations (FY2010) 270 2,290 help and support of both Head Start and the Utah Tobacco Quit Line, I quit Number of Participants in the Ending Nicotine 111 689 smoking within about three months and Dependence Teen Cessation Program (FY2010) my husband quit five days later! Without their help, support and encouragement, Anti-tobacco Ad Recall in the Past Month (2009)1 94.0% 88.1% I may have never quit.” References: Laura is offering help to Head Start 1 Utah Department of Health. Behavioral Risk Factor Surveillance System (BRFSS). 1997-2009. Salt Lake City: Utah parents who use tobacco and want to Department of Health. Center for Health Data. (Note: These BRFSS data may underestimate adult smoking prevalence because the samples did not include mobile phone numbers. Data from the late 1990s refer to quit. She says, “Now I am part of a combined BRFSS data from 1997-1999.) healthier, happier, smoke-free life. My 2 Utah Birth Certificate Database. Retrieved July 29, 2010 from Utah Department of Health, Center for Health Data, Indicator-Based Information System for Public Health web site: http://ibis.health.utah.gov/query/selection/birth/ life is also a little wealthier! With the BirthSelection.html. These smoking rates are based on pregnancies that led to live births. money we are saving, we were able to 3 Utah Department of Health. Utah Healthcare Access Survey, 2001-2008. Salt Lake City: Utah Department of buy a new car!” Health. Center for Health Data. 4 Tobacco Prevention and Control Program. (2010). Tobacco Compliance Check summary data, SFY2001-2010, (provisional data). Salt Lake City: Utah Department of Health. Laura York, Participant in Davis 5 Tobacco Prevention and Control Program. Prevention Needs Assessment Tobacco Questions, 2009. Salt Lake City: County Head Start Initiative to Reduce Utah Department of Health. Secondhand Smoke Exposure 10
  • 11. Salt Lake Valley Health Department (SLVHD) Salt Lake Valley Tobacco-related Trends • Since the late 1990s, the estimated age- adjusted adult smoking rate in Salt Lake County has decreased by 35%.1 • Birth certificates indicate that since 1999, smoking during pregnancy has decreased by 39%.2 • The estimated rate of children exposed to secondhand smoke in their homes has decreased from 7.6% in 2001 to 2.1% in 2006-08 (combined data).3 • During State Fiscal Year 2010, 5.7% of Salt Lake Valley stores sold tobacco to underage youth during compliance checks. Since 2001, the illegal sales rate has decreased by 65%.4 South Main Public Health Center, Salt Lake Valley Health Department Tobacco Statistics SLVHD’s six Public Health Centers SLVHD State and the Sanitation and Safety Building (Environmental Health) Adult Cigarette Smoking (2009)1 10.9% 9.5% went tobacco-free on November Youth Cigarette Smoking in Grades 8, 10, 12 8.5% 6.4% 20, 2009. SLVHD’s Tobacco-Free (2009)5 Health Centers include: South Main Public Health Center (PHC), Ellis R Pregnant Women Smoking (2008)2 5.8% 5.4% Shipp PHC, Rose Park PHC, West Homes with No Smoking Rule (2006-08)1 90.5% 92.1% Jordan PHC, Salt Lake City PHC, Number of Quit Line Registrations (FY2010) 2,405 6,305 and South East PHC. Tobacco-free policies protect patrons and visitors Number of QuitNet Registrations (FY2010) 1,011 2,290 from the negative health effects of Number of Participants in the Ending Nicotine 90 689 secondhand smoke. Dependence Teen Cessation Program (FY2010) Anti-tobacco Ad Recall in the Past Month (2009)1 87.9% 88.1% References: 1 Utah Department of Health. Behavioral Risk Factor Surveillance System (BRFSS). 1997-2009. Salt Lake City: Utah Department of Health. Center for Health Data. (Note: These BRFSS data may underestimate adult smoking prevalence because the samples did not include mobile phone numbers. Data from the late 1990s refer to combined BRFSS data from 1997-1999.) 2 Utah Birth Certificate Database. Retrieved July 29, 2010 from Utah Department of Health, Center for Health Data, Indicator-Based Information System for Public Health web site: http://ibis.health.utah.gov/query/selection/birth/ BirthSelection.html. These smoking rates are based on pregnancies that led to live births. 3 Utah Department of Health. Utah Healthcare Access Survey, 2001-2008. Salt Lake City: Utah Department of Health. Center for Health Data. 4 Tobacco Prevention and Control Program. (2010). Tobacco Compliance Check summary data, SFY2001-2010, (provisional data). Salt Lake City: Utah Department of Health. 5 Tobacco Prevention and Control Program. Prevention Needs Assessment Tobacco Questions, 2009. Salt Lake City: Utah Department of Health. 11
  • 12. Southeastern Utah District Health Department (SEUDHD) “Thanks to the great efforts of Southeastern Utah Tobacco-related Trends SEUDHD, Emery County Sheriff, and Four Corners Behavior Health • Since the late 1990s, the estimated Center, we have drastically reduced age-adjusted adult smoking rate in the illegal sale of tobacco products Southeastern Utah Health District has to underage youth in Emery County“ decreased by 17%.1 • Birth certificates indicate that since 1999, Shaun Bell, smoking during pregnancy has decreased Sheriff Deputy, Emery County by 17%.2 • The estimated rate of children exposed to secondhand smoke in their homes has decreased from 17.6% in 2001 to 7.1% in 2006-08 (combined data).3 • During State Fiscal Year 2010, 7.2% of Southeastern Utah stores sold tobacco to underage youth during compliance checks. Since 2001, the illegal sales rate has decreased by 42%.4 Tobacco Statistics SEUDHD State Adult Cigarette Smoking (2009)1 18.0% 9.5% Youth Cigarette Smoking in Grades 8, 10, 12 8.3% 6.4% (2009)5 Pregnant Women Smoking (2008)2 14.0% 5.4% Homes with No Smoking Rule (2006-08)1 85.9% 92.1% Number of Quit Line Registrations (FY2010) 148 6,305 Number of QuitNet Registrations (FY2010) 66 2,290 Number of Participants in the Ending Nicotine 24 689 Dependence Teen Cessation Program (FY2010) Anti-tobacco Ad Recall in the Past Month (2009)1 89.1% 88.1% References: 1 Utah Department of Health. Behavioral Risk Factor Surveillance System (BRFSS). 1997-2009. Salt Lake City: Utah Department of Health. Center for Health Data. (Note: These BRFSS data may underestimate adult smoking prevalence because the samples did not include mobile phone numbers. Data from the late 1990s refer to combined BRFSS data from 1997-1999.) 2 Utah Birth Certificate Database. Retrieved July 29, 2010 from Utah Department of Health, Center for Health Data, Indicator-Based Information System for Public Health web site: http://ibis.health.utah.gov/query/selection/birth/ BirthSelection.html. These smoking rates are based on pregnancies that led to live births. 3 Utah Department of Health. Utah Healthcare Access Survey, 2001-2008. Salt Lake City: Utah Department of Health. Center for Health Data. 4 Tobacco Prevention and Control Program. (2010). Tobacco Compliance Check summary data, SFY2001-2010, Southeastern Utah Health District Counties: (provisional data). Salt Lake City: Utah Department of Health. 5 Tobacco Prevention and Control Program. Prevention Needs Assessment Tobacco Questions, 2009. Salt Lake City: Carbon, Emery, Grand, San Juan Utah Department of Health. 12
  • 13. Southwest Utah Public Health Department (SWUPHD) Southwest Utah Tobacco-related Trends • Since the late 1990s, the estimated age- adjusted adult smoking rate in Southwest Utah Public Health District has remained unchanged.1 • Birth certificates indicate that since 1999, smoking during pregnancy has decreased by 26%.2 • The estimated rate of children exposed to secondhand smoke in their homes decreased from 3.5% in 2001 to1.9% in 2006-08 (combined data).3 • During State Fiscal Year 2010, 6.8% of Southwest Utah stores sold tobacco to underage youth during compliance checks. Since 2001, the illegal sales rate has decreased by 71%.4 Tobacco Statistics SWUPHD State Adult Cigarette Smoking (2009)1 12.3% 9.5% Youth Cigarette Smoking in Grades 8, 10, 12 6.6% 6.4% (2009)5 SWUPHD has been working with Pregnant Women Smoking (2008) 2 5.0% 5.4% local healthcare providers to address tobacco use with their patients. Homes with No Smoking Rule (2006-08)1 94.6% 92.1% After participating in tobacco Number of Quit Line Registrations (FY2010) 388 6,305 policy-related assessments and training, Enterprise Valley Medical Number of QuitNet Registrations (FY2010) 133 2,290 Clinic (shown below) is working Number of Participants in the Ending Nicotine 82 689 on improving its tobacco cessation Dependence Teen Cessation Program (FY2010) policies to ensure that patients who smoke have easy access to quit Anti-tobacco Ad Recall in the Past Month (2009)1 84.7% 88.1% counseling and medications. References: 1 Utah Department of Health. Behavioral Risk Factor Surveillance System (BRFSS). 1997- 2009. Salt Lake City: Utah Department of Health. Center for Health Data. (Note: These BRFSS data may underestimate adult smoking prevalence because the samples did not include mobile phone numbers. Data from the late 1990s refer to combined BRFSS data from 1997-1999.) 2 Utah Birth Certificate Database. Retrieved July 29, 2010 from Utah Department of Health, Center for Health Data, Indicator-Based Information System for Public Health web site: http://ibis.health.utah.gov/query/selection/birth/BirthSelection.html. These smoking rates are based on pregnancies that led to live births. 3 Utah Department of Health. Utah Healthcare Access Survey, 2001-2008. Salt Lake City: Utah Department of Health. Center for Health Data. 4 Tobacco Prevention and Control Program. (2010). Tobacco Compliance Check summary data, SFY2001-2010, (provisional data). Salt Lake City: Utah Department of Health. Southwest Utah Public Health District 5 Tobacco Prevention and Control Program. Prevention Needs Assessment Tobacco Questions, 2009. Salt Lake City: Utah Department of Health. Counties: Beaver, Garfield, Iron, Kane, Washington 13
  • 14. Summit County Public Health Department (SCPHD) Summit County Tobacco-related Trends 1 OF 50 This body represents one of the 50 • Since the late 1990s, the estimated age- people who adjusted adult smoking rate in Summit DIE EVERY HOUR County Health District has decreased by from tobacco use! 22%.1 Don’t be 1 of the 50! • Birth certificates indicate that since 1999, smoking during pregnancy has declined by 40%.2 • The estimated rate of children exposed to secondhand smoke in their homes has decreased from 7.5% in 2001 to 2.4% in 2006-08 (combined data).3 • During State Fiscal Year 2010, 3.2% of Summit County stores sold tobacco to underage youth during compliance checks. Since 2001, the illegal sales rate has decreased by 87%.4 Tobacco Statistics SCPHD State Adult Cigarette Smoking (2009)1 6.9% 9.5% The Summit County Health Youth Cigarette Smoking in Grades 8, 10, 12 10.4% 6.4% Department and South Summit Peer (2009)5 Leaders raised awareness of the harmful effects of tobacco through Pregnant Women Smoking (2008)2 2.2%* 5.4% a school-wide campaign at South Homes with No Smoking Rule (2006-08)1 92.1% 92.1% Summit High School. Outlines of bodies were placed throughout the Number of Quit Line Registrations (FY2010) 25 6,305 school to represent the number of Number of QuitNet Registrations (FY2010) 11 2,290 people who die from tobacco use every hour in the United States. They Number of Participants in the Ending Nicotine - 689 also placed 1,200 brightly colored Dependence Teen Cessation Program (FY2010) lawn flags in the grass at the front of Anti-tobacco Ad Recall in the Past Month (2009)1 84.9% 88.1% the school to show how many people *This estimate has a relative standard error of >30% and does not meet UDOH standards for reliability. die each day. References: 1 Utah Department of Health. Behavioral Risk Factor Surveillance System (BRFSS). 1997-2009. Salt Lake City: Utah Department of Health. Center for Health Data. (Note: These BRFSS data may underestimate adult smoking prevalence because the samples did not include mobile phone numbers. Data from the late 1990s refer to combined BRFSS data from 1997-1999.) 2 Utah Birth Certificate Database. Retrieved July 29, 2010 from Utah Department of Health, Center for Health Data, Indicator-Based Information System for Public Health web site: http://ibis.health.utah.gov/query/selection/birth/ BirthSelection.html. These smoking rates are based on pregnancies that led to live births. 3 Utah Department of Health. Utah Healthcare Access Survey, 2001-2008. Salt Lake City: Utah Department of Health. Center for Health Data. 4 Tobacco Prevention and Control Program. (2010). Tobacco Compliance Check summary data, SFY2001-2010, (provisional data). Salt Lake City: Utah Department of Health. 5 Tobacco Prevention and Control Program. Prevention Needs Assessment Tobacco Questions, 2009. Salt Lake City: Utah Department of Health. 14
  • 15. Tooele County Health Department (TCHD) Tooele County Tobacco-related Trends • Since the late 1990s, the estimated age- adjusted adult smoking rate in Tooele County has decreased by 39%.1 • Birth certificates indicate that since 1999, smoking during pregnancy has remained unchanged.2 • The estimated rate of children exposed to secondhand smoke in their homes has decreased from 9.2% in 2001 to 4.2% in 2006-08 (combined data).3 • During State Fiscal Year 2010, 2.3% of Tooele County stores sold tobacco to underage youth during compliance checks. Since 2001, the illegal sales rate has decreased by 90%.4 The TRUTH Fairy (Gayle Parker) Tobacco Statistics showed up during prom week at TCHD State Tooele, Grantsville, and Stansbury High Schools. The TRUTH Fairy Adult Cigarette Smoking (2009)1 12.2% 9.5% stood outside the schools and Youth Cigarette Smoking in Grades 8, 10, 12 11.3% 6.4% educated students about the (2009)5 risks of tobacco use by asking them tobacco-related questions. Pregnant Women Smoking (2008)2 9.7% 5.4% Prevention education is part of Homes with No Smoking Rule (2006-08)1 87.5% 92.1% the Tooele school district’s efforts to reduce tobacco use through Number of Quit Line Registrations (FY2010) 141 6,305 a comprehensive, district-wide Number of QuitNet Registrations (FY2010) 68 2,290 tobacco-free policy. Number of Participants in the Ending Nicotine 76 689 Dependence Teen Cessation Program (FY2010) Anti-tobacco Ad Recall in the Past Month (2009)1 88.3% 88.1% References: 1 Utah Department of Health. Behavioral Risk Factor Surveillance System (BRFSS). 1997-2009. Salt Lake City: Utah Department of Health. Center for Health Data. (Note: These BRFSS data may underestimate adult smoking prevalence because the samples did not include mobile phone numbers. Data from the late 1990s refer to combined BRFSS data from 1997-1999.) 2 Utah Birth Certificate Database. Retrieved July 29, 2010 from Utah Department of Health, Center for Health Data, Indicator-Based Information System for Public Health web site: http://ibis.health.utah.gov/query/selection/birth/ BirthSelection.html. These smoking rates are based on pregnancies that led to live births. 3 Utah Department of Health. Utah Healthcare Access Survey, 2001-2008. Salt Lake City: Utah Department of Health. Center for Health Data. 4 Tobacco Prevention and Control Program. (2010). Tobacco Compliance Check summary data, SFY2001-2010, (provisional data). Salt Lake City: Utah Department of Health. 5 Tobacco Prevention and Control Program. Prevention Needs Assessment Tobacco Questions, 2009. Salt Lake City: Utah Department of Health. 15
  • 16. TriCounty Health Department (TRCHD) TriCounty Tobacco-related Trends • Since the late 1990s, the estimated age- adjusted adult smoking rate in TriCounty has increased by 11%.1 • Birth certificates indicate that since 1999, smoking during pregnancy has remained unchanged.2 • The estimated rate of children exposed to secondhand smoke in their homes has decreased from 16.8% in 2001 to 5.9% Sarah Howell from Naples in 2006-08 (combined data).3 Elementary School was chosen • During State Fiscal Year 2009, 12.7% as the second place winner in of TriCounty stores sold tobacco to the statewide billboard category underage youth during compliance of the Truth from Youth Anti- checks. Since 2001, the illegal sales rate Tobacco Advertising Contest. has decreased by 31%.4 The Truth from Youth Anti- tobacco Advertising Contest educates 4th and 5th grade Tobacco Statistics students across the state about TRCHD State tobacco-related risks and encourages them to create anti- Adult Cigarette Smoking (2009)1 17.1% 9.5% tobacco messages for themselves and their peers. Youth Cigarette Smoking in Grades 8, 10, 12 6.2% 6.4% (2009)5 Pregnant Women Smoking (2008)2 15.3% 5.4% Homes with No Smoking Rule (2006-08)1 81.8% 92.1% Number of Quit Line Registrations (FY2010) 123 6,305 Number of QuitNet Registrations (FY2010) 60 2,290 Number of Participants in the Ending Nicotine 22 689 Dependence Teen Cessation Program (FY2010) Anti-tobacco Ad Recall in the Past Month (2009)1 85.3% 88.1% References: 1 Utah Department of Health. Behavioral Risk Factor Surveillance System (BRFSS). 1997-2009. Salt Lake City: Utah Department of Health. Center for Health Data. (Note: These BRFSS data may underestimate adult smoking prevalence because the samples did not include mobile phone numbers. Data from the late 1990s refer to combined BRFSS data from 1997-1999.) 2 Utah Birth Certificate Database. Retrieved July 29, 2010 from Utah Department of Health, Center for Health Data, Indicator-Based Information System for Public Health web site: http://ibis.health.utah.gov/query/selection/birth/ BirthSelection.html. These smoking rates are based on pregnancies that led to live births. 3 Utah Department of Health. Utah Healthcare Access Survey, 2001-2008. Salt Lake City: Utah Department of Health. Center for Health Data. 4 Tobacco Prevention and Control Program. (2010). Tobacco Compliance Check summary data, SFY2001-2010, TriCounty Health District Counties: (provisional data). Salt Lake City: Utah Department of Health. Daggett, Duchesne, Uintah 5 Tobacco Prevention and Control Program. Prevention Needs Assessment Tobacco Questions, 2009. Salt Lake City: Utah Department of Health. 16