Pedestrian Crash Facts 2007
•
0 likes•152 views

The latest crash facts in Utah related to pedestrians.

Recommended
More Related Content
Viewers also liked
Similar to Pedestrian Crash Facts 2007
Similar to Pedestrian Crash Facts 2007 (12)
More from State of Utah, Salt Lake City
More from State of Utah, Salt Lake City (20)
Recently uploaded
Recently uploaded (16)
Pedestrian Crash Facts 2007
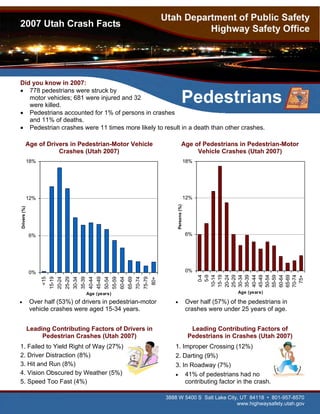
- 1. 2007 Utah Crash Facts Did you know in 2007: • 778 pedestrians were struck by motor vehicles; 681 were injured and 32 were killed. Pedestrians • Pedestrians accounted for 1% of persons in crashes and 11% of deaths. • Pedestrian crashes were 11 times more likely to result in a death than other crashes. Age of Drivers in Pedestrian-Motor Vehicle Age of Pedestrians in Pedestrian-Motor Crashes (Utah 2007) Vehicle Crashes (Utah 2007) 18% 18% 12% 12% Persons (%) Drivers (%) 6% 6% 0% 0% 0-4 5-9 10-14 15-19 20-24 25-29 30-34 35-39 40-44 45-49 50-54 55-59 60-64 65-69 70-74 75+ <15 15-19 20-24 25-29 30-34 35-39 40-44 45-49 50-54 55-59 60-64 65-69 70-74 75-79 80+ Age (years) Age (years) • Over half (53%) of drivers in pedestrian-motor • Over half (57%) of the pedestrians in vehicle crashes were aged 15-34 years. crashes were under 25 years of age. Leading Contributing Factors of Drivers in Leading Contributing Factors of Pedestrian Crashes (Utah 2007) Pedestrians in Crashes (Utah 2007) 1. Failed to Yield Right of Way (27%) 1. Improper Crossing (12%) 2. Driver Distraction (8%) 2. Darting (9%) 3. Hit and Run (8%) 3. In Roadway (7%) 4. Vision Obscured by Weather (5%) • 41% of pedestrians had no 5. Speed Too Fast (4%) contributing factor in the crash. 3888 W 5400 S Salt Lake City, UT 84118 • 801-957-8570 www.highwaysafety.utah.gov
- 2. 2007 Utah Crash Facts One-fourth (28%) of drivers who hit pedestrians were turning. Drivers need to watch for pedestrians Pedestrians before turning. Pedestrian-Motor Vehicle Crashes by Vehicle Travel Speed (Utah 2007) Pedestrian-Motor Vehicle Crashes by Hour 30% (Utah 2007) Total Crashes 10% Fatal Crashes 8% 20% Vehicles (%) 6% Crashes (%) 10% 4% 0% 1-9 MPH 10-19 MPH 20-29 MPH 30-39 MPH 40-49 MPH 50-59 MPH 60-69 MPH 70+ MPH Stopped Vehicle 2% Travel Speed 0% • The higher the speed of the vehicle the 12 am 1 am 2 am 3 am 4 am 5 am 6 am 7 am 8 am 9 am 10 am 11 am 12 pm 1 pm 2 pm 3 pm 4 pm 5 pm 6 pm 7 pm 8 pm 9 pm 10 pm 11 pm more likely the pedestrian was injured Hour of Day or killed in a crash. • Pedestrians hit by a vehicle traveling • Pedestrian-motor vehicle crashes occurred 30 MPH or higher were 4.4 times more most often between 2:00 p.m.-6:59 p.m. likely to die. Location of Pedestrians in Crashes Motor Vehicle Action Prior to Crash (Utah 2007) (Utah 2007) 1. Marked Crosswalk (36%) 1. Straight Ahead (55%) 2. In Roadway Not at Intersection/Crosswalk (34%) 2. Turning Left (14%) 3. Shoulder (11%) 3. Turning Right (14%) 4. Unmarked Crosswalk (8%) 4. Parked (7%) 5. Sidewalk (4%) 5. Backing (4%) 3888 W 5400 S Salt Lake City, UT 84118 • 801-957-8570 www.highwaysafety.utah.gov