1. Analysis on propensity to be bankrupt: Pharmaceuticals Industry Bangladesh
1
Title: “Analysis on propensity to be bankrupt: Pharmaceuticals
Industry Bangladesh‖
Abstract:
The purpose of this study is to learn about financial distress identify
the causes of financial distress, internal and external factors of
financial distress, what are the symptoms of financial distress and the
remedies of financial distress. This report will also cover a detail
about bankruptcy, the common causes of being failure of a firm. We
also discuss the popular Z-Score model which renowned for
calculating the possibility of being bankrupt. And last this report will
present the practical application of Z-Score model on ten
pharmaceuticals companies which are operate their business in
Bangladesh.
Key words:
Bankruptcy, Financial distress, Pharmaceuticals industries, Z-Score model.
2. Analysis on propensity to be bankrupt: Pharmaceuticals Industry Bangladesh
2
Chapter: 1
Introduction
3. Analysis on propensity to be bankrupt: Pharmaceuticals Industry Bangladesh
3
1.1.Introduction:
Companies are never protected against bankruptcy. Either in an economic expansion or in a
recession, firms are likely to go bankrupt. An important competitive advantage is to
understand the factors which lead to bankrupt a firm and to calculate the propensity of being
bankrupt of a firm earlier.
The purpose of this study is to assess the issue propensity of being bankrupt. This is
attempted by studying ten companies of Bangladesh pharmaceutical Industry. This study
combines both theoretical and investigational interest. From a theoretical perspective this
study discusses about the financial distress, bankruptcy and well-known Z-score model, and
from an investigational perspective it will provide the data of ten pharmaceutical companies
of Bangladesh this part also concrete on the implication of well-known Z-Score model to take
decision about the propensity of being bankrupt of the investigated firm.
1.2.Objective of the study:
The study mainly focuses on the analysis of the possibility of being bankrupt of a firm. The
other specific objectives are as follows:
1. To explore what is financial distress and causes of financial distress.
2. To identify the symptoms of financial distress and remedies for financial distress.
3. To explore the causes of bankruptcy. and
4. To know the application of the Altman Z-Score model.
1.3.Limitation of the study:
In order to structure this study, three major limitations are set. The first one concerns the
model. Previous knowledge regarding this topic is very low. It is totally new to us and we
didn‘t work with this model before. However; the model used will apply only quantitative
data. Specifically, only financial statement data will be selected as they are available.
Second, Data Constraint, as secondary and processed data has been used to prepare the
report, deep and diversified insights cannot be brought down in several cases.
4. Analysis on propensity to be bankrupt: Pharmaceuticals Industry Bangladesh
4
Finally the Time constraint, the period spent to prepare the report was not sufficient to have
effective insight,
1.4.Methodology of the study:
It is an exploratory research. Here we tried to explore the propensity of being bankrupt. We
take nine pharmaceuticals company as sample size. We analyze their financial statements and
annual reports to collect the essential information to conduct the study. In this study we used
both Primary & Secondary data. Primary data collected from analyzing company‘s financial
statement and visiting Dhaka Stock Exchange Commission. Secondary data were collected
from different articles of recognized journals, from surfing internet and other related sources.
It took almost two month to prepare this report.
In this report we mainly tried to analyze the possibility of bankruptcy through using Z-Score
model. The ingredients of Z-Score model of this model is mentioned below.
X 1 = Working Capital / Total Assets, X 2 = Retained Earnings / Total Assets,
X 3 = Earnings Before Interest and Taxes / Total Assets, X 4 = Market Value of Equity /
Total Liabilities, X 5 = Sales/ Total Assets.
The Z score bankruptcy model is: Z = 1.2X 1 + 1.4X 2 + 3.3X 3 + 0.6X 4 + .999X 5.
The Discrimination zones are as follows:
Z > 2.99 -―Safe‖ Zones, 1.81 < Z < 2.99 -―Grey‖ Zones, Z < 1.81 -―Distress‖ Zones
We also analyze the liquidity ratio and debt management ratio to predict the possibility of
bankruptcy. We tried to represents the data or information by different tables and graph.
Theoretical discussion chapter we tried to show what is financial distress , causes of financial
distress, cost of financial distress and a brief discussion about bankruptcy ,Z-Score model and
etc.
5. Analysis on propensity to be bankrupt: Pharmaceuticals Industry Bangladesh
5
Chapter 2
Theoretical framework
6. Analysis on propensity to be bankrupt: Pharmaceuticals Industry Bangladesh
6
2.1. Bangladesh Pharmaceutical Industry:
In Bangladesh Pharmaceutical sector is one of the most developed hi tech sector which is
contributing in the country's economy. After the promulgation of Drug Control Ordinance -
1982, the development of this sector was accelerated. The professional knowledge, thoughts
and innovative ideas of the pharmacists working in this sector are the key factors for this
development. Due to recent development of this sector we are exporting medicines to global
market including European market. This sector is also providing 95% of the total medicine
requirement of the local market. Leading Pharmaceutical Companies are expanding their
business with the aim to expand export market. Recently few new industries have been
established with hi tech equipments and professionals which will enhance the strength of this
sector.
2.2. Contribution to the economy of Bangladesh:
The pharmaceutical industries in Bangladesh are gifted with unparalleled potential to grow in
the days ahead as they enjoy a number of competitive advantages, industry insiders said. The
$700 million sector with more than 230 manufacturers is continuously expanding with new
products to new international destinations. Among all the 50 LDC countries Bangladesh is
the only country having quality pharmaceutical manufacturing base with marketing potential,
and exporting to at least 80 destinations of the world. Almost all companies are equipped
with World Health Organization (WHO) Good Manufacturing Practice (GMP) standards.
It has the ability to face competition from developing countries like India, China, Brazil and
Turkey in its export markets due to strict quality compliance, The export value of
pharmaceuticals is small but growing at 50 percent per year. Exports increased from $8.2
million in 2004 to $28.3 million in 2007, while export destinations climbed from 37 countries
to 72 during the period.
7. Analysis on propensity to be bankrupt: Pharmaceuticals Industry Bangladesh
7
2.3 .Financial Distress:
Financial distress is a term in corporate finance used to indicate a condition when promises to
creditors of a company are broken or honored with difficulty. If financial distress cannot be
relieved, it can lead to bankruptcy. Financial distress is usually associated with some costs to
the company; these are known as costs of financial distress.
A company under financial distress can incur costs related to the situation, such as more
expensive financing, opportunity costs of projects and less productive employees. The firm's
cost of borrowing additional capital will usually increase, making it more difficult and
expensive to raise the much needed funds. In an effort to satisfy short-term obligations,
management might pass on profitable longer-term projects. Employees of a distressed firm
usually have lower morale and higher stress caused by the increased chance of bankruptcy,
which would force them out of their jobs. Such workers can be less productive when under
such a burden.
Simply, financial distress means severe liquidity problems that cannot be resolved without a
sizable rescaling of the entity‘s operations or structure.
2.3.1.Causes of financial distress:
I. Inadequate financing: the business didn‘t start with enough finance and has
struggled from day one.
II. Missing of essential skill: The management team is unbalanced and there are
essential skill missing.
III. Making wrong decisions: A small number of big decisions have been made which
were wrong.
IV. Nasty economy: The economy has turned nasty, reducing demand, increasing interest
rates and a worsening foreign exchange rate.
V. Inadequate financial control: There is inadequate financial control and the senior
managers are not aware of how badly the business is performing.
VI. Lack of idea generation: Innovative products from competitors or from substitute
solutions reduce the attractiveness of the company‘s products and services.
VII. Competitive market: The business is in a price war.
8. Analysis on propensity to be bankrupt: Pharmaceuticals Industry Bangladesh
8
VIII. Absence of management succession: The owner/CEO suffers severe ill health or dies
and there is no management succession.
IX. Catastrophic loss: The business suffers a catastrophic loss e.g. the factory burns down
, a major customer is bankrupt creating a major bad debt or the business has massive
legal claim against it.
There are some other reasons of financial distress and Broadly these reasons can be classified
into internal causes and external causes
2.3.2.Internal causes:
The internal causes of financial distress are many. Some of the main internal causes are
discussed following:
The managerial incompetency can leads a firm to financial distress. Wrong capital structure,
wrong investment decision lack of financial discipline heavy debt burden also can leads a
firm to the way of financial distress. Over investment in fixed asset raise the firms cost to a
great extent which may bring financial crisis for a firm. Bad cash planning and control,
Ineffective leadership, inadequate sales promotion, irrational price structure may also cause
financial distress. Lack expenditure control may also create crisis of working capital.
Sometimes excessive borrowing may causes the debt to asset ratios to much high this may
also bring financial distress for a firm etc..
2.3.3.External Environment:
The external environment may also affect the operations of a company adversely. Some of
the major issues, which are generated by the external environment, are:
1. Government policies regarding taxation, power tariff, power supply, customs duties
and import duties, restrictions on imports and exports etc.
2. Quota system imposed by the government on raw materials/ finished goods
3. Development of new technology
4. Sudden withdrawal by some of the major customers resulting into decline in orders
5. A change in the consumers‘ tastes and preferences
9. Analysis on propensity to be bankrupt: Pharmaceuticals Industry Bangladesh
9
6. Strained relationship with the external government
7. A change in the lending policies of the financial institutions
2.3.4.Warning signs of financial distress:
We have all heard the saying, ‗cash is king‘, but when it comes to running a business,
ensuring the business have sufficient cash to pay staff, GST obligations, debtors and other
operational expenses is crucial to maintaining the ongoing viability of your business. Despite
the importance of preserving strong cash flow, many business owners fail to monitor their
cash position, often ignoring the warning signs, which if left unchecked, could sound the
death knell of their business. The following are some important signs for financial distress:
I. Desperate short of cash. Borrowing capacity exhausted.
II. Pressure of suppliers for faster payment.
III. Loss of capital in the market.
IV. High leverage because of over borrowings.
V. Lack of proper maintenance of plant, machinery and equipments.
VI. Poor asset turnover.
VII. Large accumulation of inventories.
VIII. Suppliers showing reluctance to offer trade discounts.
2.3.5. Cost of financial distress:
The distress condition involves costs. The primary cost is the bankruptcy or insolvency costs.
When the company is declared as insolvent/ bankrupt, it has to meet legal costs by way of
reimbursement of expenses incurred by the receiver, his salaries and allowances. The cost of
financial distress depends on the probability of distress and management of the distress costs
(Brealey and Myers –2000). The bankruptcy cost to the owners depends on the type of
organization. In a sole proprietorship or partnership form of organization, the
proprietor/partners have to bear the costs. But in a joint stock company, where the liability of
members is limited, the shareholders can walk off leaving the burden on the creditors. The
loss to the shareholders depends on the value of the firm. A firm which was enjoying high
market value, if suddenly turn to bankrupt, the shareholders may feel the loss heavy because
10. Analysis on propensity to be bankrupt: Pharmaceuticals Industry Bangladesh
10
of the sudden decline in the value of shares and thereby the decrease in their wealth. Now the
question is whether the losses are for the shareholders alone. What about the other
stakeholders like employees, suppliers of raw materials and spares, ancillary units and their
employees, the shops and establishments in and around the company, retail outlets of the
company, the state and the central governments, local administration etc. In a broader sense,
the distress cost has to be born be the whole village or township or the area where the
company is located. A distressed firm will always look for more funds and start borrowing
heavily. This increases their leverage pushing them to a debt trap. Apart from the normal
interest cost; a distressed firm has to pay overdue interest for the default too. Besides since
the firm may be defaulting submission of essential financial and other information to the
lenders, they may have to face penalty as well. The distressed firm will find it difficult to
raise funds due to poor credit rating. Such firms may have to pay higher interest charges on
their borrowings. This is in addition to the sacrifices they have to make by way of wage cut,
cost reduction, expenditure cut etc.
2.4.Bankruptcy:
The word bankruptcy is derived from Italian banca rotta, meaning "broken bench", which
may stem from a custom of breaking a moneychanger's bench or counter to signify his
insolvency, or which may be only a figure of speech. Bankruptcy is a legal status of a person
or other entity that cannot repay the debts it owes to creditors. In most jurisdictions,
bankruptcy is imposed by a court order, often initiated by the debtor.
Legal procedure for liquidating a business (or property owned by an individual ) which
cannot fully pay its debts out of its current assets . Bankruptcy can be brought upon itself by
an insolvent debtor (called 'voluntary bankruptcy ') or it can be forced on court orders issued
on creditors ' petition (called 'involuntary bankruptcy'). Two major objectives of a bankruptcy
are (1) fair settlement of the legal claims of the creditors through an equitable distribution of
debtor's assets, and (2) to provide the debtor an opportunity for fresh start. Bankruptcy
amounts to a business-failure, but voluntary winding up does not.
11. Analysis on propensity to be bankrupt: Pharmaceuticals Industry Bangladesh
11
2.4.1. Common Causes of failure or being bankrupt:
1. Choosing a business that isn't very profitable: Even though the company generates
lots of activity, the profits never materialize to the extent necessary to sustain an on-
going company.
2. Inadequate cash reserve: If a company don't have enough cash to carry itself through
the first six months or so before the business starts making money, its prospects for
Success are not good
3. Failure to clearly define and understand market, customers, and customers' buying
habits: Who are the target customers? The company should be able to clearly identify
them in one or two sentences. How is it going to reach them? Is its product or service
seasonal? What will it do in the off- season? How loyal are its potential customers to
their current supplier? Do customers keep coming back or do they just purchase one
time.
4. Failure to price your product or service correctly: The company must clearly define
its pricing strategy. It can be the cheapest or can be the best, but if it try to do both,
it'll fail.
5. Overgeneralization: Trying to do everything for everyone is a sure road to ruin.
Spreading the activity too thin diminishes quality. The market pays excellent rewards
for excellent results, average rewards for average results, and below average rewards
for below average results.
6. Overdependence on a single customer: At first, it looks great. But then the company
will realize the company is at their mercy. Whenever it have one customer so big that
losing them would mean closing up shop, watch out. Having a large base of small
customers is much preferred.
7. Putting up with inadequate management: A common problem faced by Successful
companies is growing beyond management resources or skills. As the company
grows, the company may surpass certain individuals' ability to manage and plan. If a
change becomes necessary, don't lower its standards just to fill vacant positions or to
accommodate someone within the organization. Decide on the skills necessary for the
position and insist the individual has them.
12. Analysis on propensity to be bankrupt: Pharmaceuticals Industry Bangladesh
12
2.5.Financial Ratios used for Calculating Z-Score:
The ratios used for calculating Z-Score are giveown bel
2.5.1.Working Capital to Total Asset
Working capital is the difference between current assets and liabilities. Current assets are
those assets that will be converted to cash within one year. Examples include accounts
receivable and inventory. Current liabilities are those liabilities that are due in less than one
year. Examples include accounts payable and other short-term debts. Together, the two items
represent working capital, where working refers to those assets and liabilities that are closest
to being used or paid off. The ratio of working capital to total assets is a ratio that helps
analysts and investors to gauge the operational efficiency of a company's management.
Working capital to Total Asset calculation is given below:
2.5.2.Retained Earnings to Total Asset:
The retained earnings of a company are the percentage of net earnings not paid out as
dividends; they are ―retained‖ to be reinvested in the firm or used to pay down debt. Retained
earnings are calculated as follows:
Beginning retained earnings + net income (net loss) – dividends paid
The ratio of retained earnings to total assets helps measure the extent to which a company
relies on debt, or leverage. The lower the ratio, the more a company is funding assets by
borrowing instead of through retained earnings which, again, increases the risk of bankruptcy
if the firm cannot meet its debt obligations.
Retained Earnings to Total Asset calculation formula is following:
13. Analysis on propensity to be bankrupt: Pharmaceuticals Industry Bangladesh
13
2.5.3.EBIT to Total Asset:
Earnings before interest and tax (EBIT) to total assets ratio indicates a proportion between the
measure that shows company‘s profitability and company‘s assets. In short, it represents
general profitability of the company‘s assets. Data to calculate this ratio is collected from the
income statement and balance sheet.
Calculation formula is following:
This ratio is similar to ROA ratio. The only difference if that when calculating ROA, we use
net earnings (net income), whereas in EBIT/TA ratio we use earnings before interest and tax.
2.5.4.Market value of Equity to Total Liability
The ratio of market value of equity to total liabilities shows how much a company‘s market
value (as measured by market capitalization, or share price times shares outstanding) could
decline before liabilities exceeded assets.
Calculation formula is :
Unlike the other ratio components used by the Z-Score, market value isn‘t based purely on
fundamentals—the market capitalization of a firm is an indication of the market‘s confidence
in a company‘s financial position. Generally speaking, the higher the market capitalization of
a company, the higher the likelihood that the firm can survive going forward.
2.5.5. Sales to Total asset:
The ratio of sales to total assets, more commonly referred to as asset turnover, measures the
amount of sales generated by a company for every money‗s worth of its assets.
14. Analysis on propensity to be bankrupt: Pharmaceuticals Industry Bangladesh
14
In other words, asset turnover is an indication of how efficiently a company is as using its
assets to generate sales. The higher the number the better, while low or falling asset turnover
can signal a failure by the company to expand its market share.
.2.6.Liquidity ratio:
The degree to which an asset or security can be bought or sold in the market without affecting
the asset's price. Liquidity is characterized by a high level of trading activity. Assets that can
be easily bought or sold are known as liquid assets.
Common liquidity ratios include the current ratio, the quick ratio and the operating cash flow
ratio. Different analysts consider different assets to be relevant in calculating liquidity. Some
analysts will calculate only the sum of cash and equivalents divided by current liabilities
because they feel that they are the most liquid assets, and would be the most likely to be used
to cover short-term debts in an emergency.
A company's ability to turn short-term assets into cash to cover debts is of the utmost
importance when creditors are seeking payment. Bankruptcy analysts and mortgage
originators frequently use the liquidity ratios to determine whether a company will be able to
continue as a going concern.
2.6.1.Current ratio:
The ratio is mainly used to give an idea of the company's ability to pay back its short-term
liabilities (debt and payables) with its short-term assets (cash, inventory, receivables). The
higher the current ratio, the more capable the company is of paying its obligations. A ratio
under 1 suggests that the company would be unable to pay off its obligations if they came due
at that point. While this shows the company is not in good financial health, it does not
necessarily mean that it will go bankrupt - as there are many ways to access financing - but it
is definitely not a good sign
Calculation Formula is
;The current ratio can give a sense of the efficiency of a company's operating cycle or its
ability to turn its product into cash. Companies that have trouble getting paid on their
receivables or have long inventory turnover can run into liquidity problems because they are
15. Analysis on propensity to be bankrupt: Pharmaceuticals Industry Bangladesh
15
unable to alleviate their obligations. Because business operations differ in each industry, it is
always more useful to compare companies within the same industry.
2.6.2Quick Ratio:
An indicator of a company‗s short-term liquidity. The quick ratio measures a company‗s
ability to meet its short-term obligations with its most liquid assets. For this reason, the ratio
excludes inventories from current assets, and is calculated as follows:
Quick ratio = (current ask ets – inventories) / current liabilities, or = (cash and equivalents +
marketable securities + accounts receivable) / current liabilities
The quick ratio measures the dollar amount of liquid assets available for each dollar of
current liabilities. Thus, a quick ratio of 1.5 means that a company has Tk. 1.50 of liquid
assets available to cover each Tk.1 of current liabilities. The higher the quick ratio, the better
the company's liquidity position. Also known as the ―acid-test ratio" or "quick assets ratio."
2.7.Debt Management Ratio:
Debt Management Ratios attempt to measure the firm's use of Financial Leverage and ability
to avoid financial distress in the long run. These ratios are also known as Long-Term
Solvency Ratios.
Debt is called Financial Leverage because the use of debt can improve returns to stockholders
in good years and increase their losses in bad years. Debt generally represents a fixed cost of
financing to a firm. Thus, if the firm can earn more on assets which are financed with debt
than the cost of servicing the debt then these additional earnings will flow through to the
stockholders. Moreover, our tax law favors debt as a source of financing since interest
expense is tax deductible.
With the use of debt also comes the possibility of financial distress and bankruptcy.The
amount of debt that a firm can utilize is said to a great extent by the characteristics of the
firm's industry. Firms which are in industries with volatile sales and cash flows cannot utilize
debt to the same extent as firms in industries with stable sales and cash flows. Thus, the
optimal mix of debt for a firm involves a tradeoff between the benefits of leverage and
possibility of financial distress.
16. Analysis on propensity to be bankrupt: Pharmaceuticals Industry Bangladesh
16
2.7.1.Debt to Total Assets Ratio:
Debt to Total Assets Ratio:
A financial ratio that measures the extent of a company‘s or consumer‘s leverage. The debt
ratio is defined as the ratio of total debt to total assets, expressed in percentage, and can be
interpreted as the proportion of a company‘s assets that are financed by debt.
The higher this ratio, the more leveraged the company and the greater its financial risk. Debt
ratios vary widely across industries, with capital-intensive businesses such as utilities and
pipelines having much higher debt ratios than other industries like technology. In the
consumer lending and mortgage businesses, debt ratio is defined as the ratio of total debt
service obligations to gross annual income.
2.7.2.The times interest earned:
The times interest earned ratio indicates the extent of which earnings are available to meet
interest payments.
A lower times interest earned ratio means less earnings are available to meet interest
payments and that the business is more vulnerable to increases in interest rates. It may be
calculated as either EBIT by the total interest payable.
Interest Charges = Traditionally "charges" refers to interest expense found on the income
statement.
Times Interest Earned or Interest Coverage is a great tool when measuring a company's
ability to meet its debt obligations. When the interest coverage ratio is smaller than 1, the
company is not generating enough cash from its operations EBIT to meet its interest
obligations. The Company would then have to either use cash on hand to make up the
difference or borrow funds. Typically, it is a warning sign when interest coverage falls below
2.5xs.
17. Analysis on propensity to be bankrupt: Pharmaceuticals Industry Bangladesh
17
2.8.Z-Score Model:
The Altman Z-Score (named after Edward Altman, the New York University professor who
devised it) is a statistical tool used to measure the likelihood that a company will go bankrupt.
The formula may be used to predict the probability that a firm will go into bankruptcy within
two years. Z-scores are used to predict corporate defaults and an easy-to-calculate control
measure for the financial distress status of companies in academic studies. The Z-score uses
multiple corporate income and balance sheet values to measure the financial health of a
company.
2.8.1.The Z-Score Ingredients
The Z-Score is calculated by multiplying each of several financial ratios by an appropriate
coefficient and then summing the results. The ratios rely on these financial measures:
1. Working Capital is equal to Current Assets minus Current Liabilities.
2. Total Assets is the total of the Assets section of the Balance Sheet.
3. Retained Earnings is found in the Equity section of the Balance Sheet.
4. EBIT (Earnings Before Interest and Taxes) includes the income or loss from
operations and from any unusual or extraordinary items but not the tax effects of
these items. It can be calculated as follows: Find Net Income; add back any
income tax expenses and subtract any income tax benefits; then add back any
interest expenses.
5. Market Value of Equity is the total value of all shares of common and preferred
stock. The dates these values are chosen need not correspond exactly with the
dates of the financial statements to which the market value is compared.
6. Net Worth is also known as Shareholders' Equity or, simply, Equity. It is equalto
Total Assets minus Total Liabilities. Book Value of Total Liabilities is the sum of
all current and long-term liabilities from the Balance Sheet.
7. Sales include other income normally categorized as revenues in the firm's Income
Statement.
18. Analysis on propensity to be bankrupt: Pharmaceuticals Industry Bangladesh
18
2.8.2.Interpretation of The Z-Score:
The Z-Score is not intended to predict when a firm will file a formal declaration of
bankruptcy in a federal district court. It is instead a measure of how closely a firm resembles
other firms that have filed for bankruptcy. It is a measure of corporate financial distress, a
measure of economic bankruptcy.
The Z Score model is a tool that can complement your other analytical tools. Seldom,
however, should you use any of the Z Score measures as your only means of analysis.
The original Z-score formula was as follows:
Z = 1.2X 1 + 1.4X 2 + 3.3X 3 + 0.6X 4 + 0.999X 5.
X 1 = Working Capital / Total Assets. Measures liquid assets in relation to the size of the
company.
X 2 = Retained Earnings / Total Assets. Measures profitability that reflects the company's age
and earning power.
X 3 = Earnings Before Interest and Taxes / Total Assets. Measures operating efficiency apart
from tax and leveraging factors. It recognizes operating earnings as being important to long-
term viability.
X 4 = Market Value of Equity / Book Value of Total Liabilities. Adds market dimension that
can show up security price fluctuation as a possible red flag.
X 5 = Sales/ Total Assets. Standard measure for total asset turnover (varies greatly from
industry to industry)
Z score bankruptcy model :m
Z = 1.2X 1 + 1.4X 2 + 3.3X 3 + 0.6X 4 + .999X 5
Zones of Discrimination:
Z > 2.99 -―Safe‖ Zones, 1.81 < Z < 2.99 -―Grey‖ Zones, Z < 1.81 -―Distress‖ Zones
19. Analysis on propensity to be bankrupt: Pharmaceuticals Industry Bangladesh
19
Chapter 3
Data Analysis
20. Analysis on propensity to be bankrupt: Pharmaceuticals Industry Bangladesh
20
3.1. Z-Score Data Analysis:
In this chapter we analyze the Z-Score model on ten Pharmaceuticals Company which are
operating their business in our country. But, first we briefly discussed about the overview of
the Bangladesh Pharmaceuticals Industries and its contribution to the economic development
of Bangladesh
3.2.Tabulation of Data:
In this segment the data which are collected from Dhaka Stock Exchange and analyzing
company‘s financial report are presented in tabular form under the particular company‘s
head. Then Z-score is calculated the values of Z-Score getting from different years are
presented in a graph named Z-Score tendency of respective company.
3.2.1. Working Capital to Total Asset:
Working capital is a company‘s current assets less its current liabilities and measures a
company‘s efficiency and its short-term financial health. Positive working capital means that
the company is able to meet its short-term obligations. Negative working capital means that a
company‘s current assets cannot meet its short-term liabilities; it could have problems paying
back creditors in the short term, ultimately forcing it into bankruptcy. Companies with
healthy, positive working capital shouldn‘t have problems paying their bills.
21. Analysis on propensity to be bankrupt: Pharmaceuticals Industry Bangladesh
21
The following represents the Working capital to total asset ratio of assigned nine
Pharmaceuticals Company.
Sl.
No.
Company name Year Average
2012 2011 2010 2009 2008
1. ACI Limited 0.09336 0.147687 0.176947 0.157987 0.085086 0.132214
2. Ambee Pharmaceuticals 0.03095 0.017319 0.001343 -0.0007 -0.01224 0.007336
3. Beximco Pharmaceuticals 0.20872 0.195382 0.17211 0.23101 0.02171 0.021710
4. Glaxo Smithkline 0.36959 0.417691 0.51124 0.34634 0.66009 0.460993
5. IBN Sina 0.04125 0.012950 -0.02222 -0.1184 -0.08662 -0.03461
6. Libra infusion 0.02306 0.017556 -0.05224 -0.1498 -0.06873 -0.04603
7. Pharma Aids 0.28500 0.237353 0.160043 0.07475 -0.78798 -0.00616
8. Reneta pharma ltd. 0.04443 -0.11983 -0.02594 0.10568 0.891605 0.179189
9. Square Pharma ltd. 0.00158 0.116183 0.12106 0.17016 0.090757 0.099951
10. Industry average 0.12199 1.225481 0.11581 0.09077 0.088185 0.106518
Table no. 1: Working Capital to Total asset of nine Pharmaceuticals company
By analyzing the above table we can said that almost all the company have working capital
shortage. It could have problems paying back creditors in the short term, ultimately forcing it
into bankruptcy. Some of the company has negative results for example in 2009 and 2008
Ambee Pharma. has negative working capital to total asset ratio . Libra infusion and IBN
Sina have faced same problem like Ambee pharma in 2008,2009 and 2010. Their average
performance of last five years was also negative. Pharma Aids and Reneta Pharma ltd. was
Also faced the same problem in 2008 and 2010, 2011 respectively.
22. Analysis on propensity to be bankrupt: Pharmaceuticals Industry Bangladesh
22
The following graph shows the Working Capital to Total Asset ratio of nine Pharmaceuticals
company:
Graph no. 1: Working Capital to total asset of nine Pharmaceuticals company
-1.00 -0.50 0.00 0.50 1.00 1.50
ACI Limited
Ambee Pharmaceuticals
Beximco Pharmaceuticals
Glaxo Smithkline
IBN Sina
Libra infusion
Pharma Aids
Reneta pharma ltd.
Square Pharma ltd.
Industry average
ACI
Limited
Ambee
Pharmac
euticals
Beximco
Pharmac
euticals
Glaxo
Smithklin
e
IBN Sina
Libra
infusion
Pharma
Aids
Reneta
pharma
ltd.
Square
Pharma
ltd.
Industry
average
Average 0.13 0.01 0.02 0.46 -0.03 -0.05 -0.01 0.18 0.10 0.11
2008 0.09 -0.01 0.02 0.66 -0.09 -0.07 -0.79 0.89 0.09 0.09
2009 0.16 0.00 0.23 0.35 -0.12 -0.15 0.07 0.11 0.17 0.09
2010 0.18 0.00 0.17 0.51 -0.02 -0.05 0.16 -0.03 0.12 0.12
2011 0.15 0.02 0.20 0.42 0.01 0.02 0.24 -0.12 0.12 1.23
2012 0.09 0.03 0.21 0.37 0.04 0.02 0.29 0.04 0.00 0.12
Working Capital to total asset of nine
Pharmaceuticals company
23. Analysis on propensity to be bankrupt: Pharmaceuticals Industry Bangladesh
23
The graph above represents the condition of working capital to total asset ratio of nine listed
pharmaceuticals companies. The graph shows that Libra infusion, Reneta Pharma Ltd,
Pharma Aids and IBN Sina have some negative Working capital to Total Asset ratio. The
other companies have not a satisfactory performance all most all the company have a working
capital ratio bellow one. This can create a problem to satisfy the day to day business activities
and ultimately can lead to the bankruptcy.
3.2.2. Retained Earnings to Total Asset:
The ratio of retained earnings to total assets helps measure the extent to which a company
relies on debt, or leverage. The lower the ratio, the more a company is funding assets by
borrowing instead of through retained earnings which, again, increases the risk of bankruptcy
if the firm cannot meet its debt obligations.
The following represents the Retained Earnings to Total Asset ratio of assigned nine
Pharmaceuticals Company.
Sl.
No.
Company
name
Year Average
2012 2011 2010 2009 2008
1. Aci limited 0.263848 0.282643 0.277821 0.306039 0.215949 0.26926
2. Ambee pharma 0.097352 0.009114 0.08261 0.07714 0.076565 0.06855
3. Beximco Pharma 0.272518 0.255706 0.23803 0.21528 0.270256 0.25036
4. Glaxo Smithkline 0.424400 0.475572 0.54556 0.57508 0.533639 0.51085
5. IBN Sina 0.157527 0.280730 0.24989 0.17187 0.183435 0.20869
6. Libra infusion 0.017269 0.017242 0.01595 0.07659 0.099301 0.04527
7. Pharma Aids 0.351693 0.353767 0.58912 0.54350 0.503229 0.46826
8. Reneta Pharma 0.453548 0.447604 0.82358 0.82632 0.423263 0.59486
9. Square pharma ltd 0.541537 0.516355 0.42959 0.45258 0.414972 0.47100
10. Industry average 0.286633 0.300909 0.36144 0.358051 0.309922 0.323391
Table no. 2: Retained Earnings to Total asset Ratio of nine Pharmaceuticals Company
The table above shows the retained earnings to total asset ratio of nine listed pharmaceuticals
company. The table shows that all the company have the retained earnings to total asset ratio
bellow one. What does it mean? It means all the firm chooses borrowing rather than retained
24. Analysis on propensity to be bankrupt: Pharmaceuticals Industry Bangladesh
24
earnings to finance their project which, again, increases the risk of bankruptcy if the firm cannot
meet its debt obligations.
The following graph represents the Retained Earnings to Total Asset of Respective Nine Listed
Pharmaceuticals Company
Graph no. 2: Retained Earnings to Total asset Ratio of nine Pharmaceuticals Company
The graph shows that the retained earnings to total asset ratios of nine Pharmaceuticals Company
listed in DSE from the graph shows that all the companies have the ratio bellow one which, indicates
0.00 0.10 0.20 0.30 0.40 0.50 0.60 0.70 0.80 0.90
Aci limited
Ambee pharma
Beximco Pharma
Glaxo Smithkline
IBN Sina
Libra infusion
Pharma Aids
Reneta Pharma
Square pharma ltd
Industry average
Aci
limited
Ambee
pharma
Beximco
Pharma
Glaxo
Smithklin
e
IBN Sina
Libra
infusion
Pharma
Aids
Reneta
Pharma
Square
pharma
ltd
Industry
average
Average 0.27 0.07 0.25 0.51 0.21 0.05 0.47 0.59 0.47 0.32
2008 0.22 0.08 0.27 0.53 0.18 0.10 0.50 0.42 0.41 0.31
2009 0.31 0.08 0.22 0.58 0.17 0.08 0.54 0.83 0.45 0.36
2010 0.28 0.08 0.24 0.55 0.25 0.02 0.59 0.82 0.43 0.36
2011 0.28 0.01 0.26 0.48 0.28 0.02 0.35 0.45 0.52 0.30
2012 0.26 0.10 0.27 0.42 0.16 0.02 0.35 0.45 0.54 0.29
Retained Earnings to Total Asset of Respective
Nine Listed Pharmaceuticals Company
25. Analysis on propensity to be bankrupt: Pharmaceuticals Industry Bangladesh
25
that the companies finance their projects through bond rather than retained earnings. If the company
fails to repay the loan the creditors may force to declare the firm bankrupt.
3.2.3 .EBIT to Total Asset:
This is a variation on return on assets, which is net income divided by total assets. This ratio
assesses a firm‘s ability to generate profits from its assets before deducting interest and taxes.
The following represents the Earnings before Interest and tax to Total Asset ratio of assigned
nine Pharmaceuticals Company listed in DSE.
Sl
No.
Company
name
Year Average
2012 2011 2010 2009 2008
1. ACI Ltd 0.05577 0.080498 0.08342 0.14718 0.15829 0.10503
2. Ambee Pharma 0.084032 0.081596 0.073535 0.07193 0.06605 0.07543
3. Beximco Pharma 0.08978 0.086330 0.07653 0.05033 0.06739 0.07407
4. Glaxso smith 0.12259 0.160266 0.24431 0.25381 0.15607 0.18741
5. IBN Sina 0.08352 0.113823 0.12535 0.07888 0.10257 0.10083
6. Libra Infusion 0.01235 0.016015 0.01427 0.06580 0.09257 0.04020
7. Pharma Aids 0.17949 0.187298 0.06946 0.14979 0.16398 0.15000
8. Reneta Pharma 0.22158 0.223278 0.43018 0.43904 0.23195 0.30920
9. Square Pharma 0.16431 0.154804 0.14151 0.17895 0.17873 0.16366
10. Industry Average 0.10613 0.11863 0.13963 0.15709 0.12985 0.13027
Table no. 3: EBIT to Total asset Ratio of nine Pharmaceuticals Company
The ratio represents the firm‘s ability to generate profit using its asset. But in the table all the
companies have EBIT to Total Asset ratio bellow one it is not necessary that the result must
have to greater than one but the ratio should represents a satisfactory performance. Among
the nine companies Reneta pharma Ltd. is performing well than other. The lower the ratio is
the higher chance of being bankrupt.
26. Analysis on propensity to be bankrupt: Pharmaceuticals Industry Bangladesh
26
The following graph represents the situation of earnings before interest and tax over
company‘s total asset.
Graph no. 3: EBIT to Total asset Ratio of nine Pharmaceuticals Company
0.00 0.05 0.10 0.15 0.20 0.25 0.30 0.35 0.40 0.45 0.50
ACI Ltd
Ambee Pharma
Beximco Pharma
Glaxso smith
IBN Sina
Libra Infusion
Pharma Aids
Reneta Pharma
Square Pharma
Industry Average
ACI Ltd
Ambee
Pharma
Beximco
Pharma
Glaxso
smith
IBN Sina
Libra
Infusion
Pharma
Aids
Reneta
Pharma
Square
Pharma
Industry
Average
Average 0.11 0.08 0.07 0.19 0.10 0.04 0.15 0.31 0.16 0.13
2008 0.16 0.07 0.07 0.16 0.10 0.09 0.16 0.23 0.18 0.13
2009 0.15 0.07 0.05 0.25 0.08 0.07 0.15 0.44 0.18 0.16
2010 0.08 0.07 0.08 0.24 0.13 0.01 0.07 0.43 0.14 0.14
2011 0.08 0.08 0.09 0.16 0.11 0.02 0.19 0.22 0.15 0.12
2012 0.06 0.08 0.09 0.12 0.08 0.01 0.18 0.22 0.16 0.11
EBIT to Total asset Ratio of nine
Pharmaceuticals Company
27. Analysis on propensity to be bankrupt: Pharmaceuticals Industry Bangladesh
27
This graph shows that almost all the company has poor results. They are not able enough to
earn a satisfactory profit. But Reneta Pharmaceuticals has almost 31% EBIT to Total Asset
Ratio. Among all company Libra Infusion has been performing very pitiable
3.2.4. Market value of Equity to Total Liability:
The ratio of market value of equity to total liabilities shows how much a company‘s market
value (as measured by market capitalization, or share price times shares outstanding) could
decline before liabilities exceeded assets.
Sl.
No.
Company
name
Year Average
2012 2011 2010 2009 2008
1. Aci limited 0.413143 0.64350 1.38290 1.92762 1.78951 1.23133
2. Ambee Pharma 2.001283 3.65376 4.18520 1.73405 1.15549 2.54596
3. Beximco parma 2.754818 3.99062 5.09086 2.61475 4.83425 3.85706
4. Glaco smithkline 4.34959 6.78859 18.2613 16.2423 8.83403 10.8951
5. IBN Sina 3.51809 4.80424 4.88910 3.59483 2.75765 3.91278
6. Libra infusion 0.51274 0.97251 0.53626 0.59164 0.81746 0.68612
7. Pharma Aids 10.4456 20.4242 5.06696 3.28584 4.17082 8.67870
8. Reneta 4.46010 7.29311 4.57451 10.5993 6.00636 6.58668
9. Square Pharma 1.43864 12.1161 11.4077 15.5500 10.7309 10.2487
10. Industry average 3.32155 6.74295 6.15497 6.23781 4.56627 5.40471
Table no. 4: Market Value of Equity to Total liability Ratio of nine Pharmaceuticals
Company
The table shows the investors preference towards the company‘s stock. We get the results
dividing market value of equity by total liabilities. In this table we see that Glaco smithkline
has the highest average. Where ACI Ltd. and Libra Infusion have the lowest average. So it
means that investor has less preference towards the ACI Ltd. and Libra infusion.where as
Glaxo smithkline and Squar pharma dominating the market.
28. Analysis on propensity to be bankrupt: Pharmaceuticals Industry Bangladesh
28
The graph below shows the Market Value of Equity to atotal asset Ratio of nine
Pharmaceuticals Company
Graph no. 4: Market Value of Equity to Total Liability Ratio of nine Pharmaceuticals
Company
0.00 5.00 10.00 15.00 20.00 25.00
Aci limited
Ambee Pharma
Beximco parma
Glaco smithkline
IBN Sina
Libra infusion
Pharma Aids
Reneta
Square Pharma
Industry average
Aci
limited
Ambee
Pharma
Beximco
parma
Glaco
smithkli
ne
IBN Sina
Libra
infusion
Pharma
Aids
Reneta
Square
Pharma
Industry
average
Average 1.23 2.55 3.86 10.90 3.91 0.69 8.68 6.59 10.25 5.40
2008 1.79 1.16 4.83 8.83 2.76 0.82 4.17 6.01 10.73 4.57
2009 1.93 1.73 2.61 16.24 3.59 0.59 3.29 10.60 15.55 6.24
2010 1.38 4.19 5.09 18.26 4.89 0.54 5.07 4.57 11.41 6.15
2011 0.64 3.65 3.99 6.79 4.80 0.97 20.42 7.29 12.12 6.74
2012 0.41 2.00 2.75 4.35 3.52 0.51 10.45 4.46 1.44 3.32
Market Value of Equity to atotal asset Ratio
of nine Pharmaceuticals Company
29. Analysis on propensity to be bankrupt: Pharmaceuticals Industry Bangladesh
29
The graph shows that the company‘s Market Value of Equity to Total asset Ratio, the
findings are the Square Pharmaceuticals and Glaxo smithkline have better performance.
Whereas Libra Infusion and ACI Ltd performed very poorly. But Pharma Aids performs very
outstanding in the last two years.
3.2.5.Sales to Total asset:
The ratio of sales to total assets, more commonly referred to as asset turnover, measures the
amount of sales generated by a company for every money‘s worth of its assets.In other
words, asset turnover is an indication of how efficiently a company is as using its assets to
generate sales. The higher the number the better, while low or falling asset turnover can
signal a failure by the company to expand its market share.
The table below Sales to Total asset Ratio of nine Pharmaceuticals Company
Sl
No.
Company
name
Year Average
2012 2011 2010 2009 2008
1. ACI ltd. 0.73297 0.76722 0.81717 0.96058 1.49548 0.954689
2. Ambee Pharma 1.00807 0.96109 0.93748 0.87826 0.86152 0.929289
3. Beximco phrma 0.37776 0.34255 0.30370 0.24473 0.27059 0.307871
4. Glaxo smith 1.81247 1.82018 1.65676 1.77706 1.38591 1.690481
5. IBN Sina 1.91633 2.53017 2.56575 1.81491 2.04732 2.174901
6. Libra infusion 0.09290 0.14123 0.15775 0.86532 1.35373 0.522192
7. Pharma Aids 0.79364 0.86328 0.69040 0.92483 0.85563 0.825561
8. Reneta Pharma 0.78657 0.84763 1.66862 1.76642 0.97707 1.209267
9. Square pharma ltd 0.76593 0.74832 0.69281 0.76267 0.74112 0.742175
10. Industry average 0.92073 1.00240 1.05449 1.11053 1.10981 1.039598
Table no. 5: Sales to Total asset Ratio of nine Pharmaceuticals Company
This table represents company‘s ability to generate sale compared with its total asset or
simply asset turnover. The ACI limited has the highest turnover rate. This is double than
industry average. Glaxo smithkline has also performed well because the higher the number
the better, but the others have an average performance. Because the low asset turnover is a
signal of failure of the company to expand its market share.
30. Analysis on propensity to be bankrupt: Pharmaceuticals Industry Bangladesh
30
The graph below Sales to atotal asset Ratio of nine Pharmaceuticals Company:
Graph no. 5: Sales to Total asset Ratio of nine Pharmaceuticals Company
The graph represents the asset turnover rates of our respective nine Pharmaceuticals
companies. Here we see that IBN Sina, Glaxo Smithkline and Reneta pharmaceuticals have
performed well. Their turnover is above two or almost two. That is their sales is almost two
times of their assets. The higher ratio is the better performance the other companies ave a
average results i.e. their performance is not so good cause low or falling asset turnover can
signal a failure by the company to expand its market share.
0.00 0.50 1.00 1.50 2.00 2.50 3.00
ACI ltd.
Ambee Pharma
Beximco phrma
Glaxo smith
IBN Sina
Libra infusion
Pharma Aids
Reneta Pharma
Square pharma ltd
Industry average
ACI ltd.
Ambee
Pharma
Beximco
phrma
Glaxo
smith
IBN Sina
Libra
infusion
Pharma
Aids
Reneta
Pharma
Square
pharma
ltd
Industry
average
Average 0.95 0.93 0.31 1.69 2.17 0.52 0.83 1.21 0.74 1.04
2008 1.50 0.86 0.27 1.39 2.05 1.35 0.86 0.98 0.74 1.11
2009 0.96 0.88 0.24 1.78 1.81 0.87 0.92 1.77 0.76 1.11
2010 0.82 0.94 0.30 1.66 2.57 0.16 0.69 1.67 0.69 1.05
2011 0.77 0.96 0.34 1.82 2.53 0.14 0.86 0.85 0.75 1.00
2012 0.73 1.01 0.38 1.81 1.92 0.09 0.79 0.79 0.77 0.92
Sales to atotal asset Ratio of nine
Pharmaceuticals Company
31. Analysis on propensity to be bankrupt: Pharmaceuticals Industry Bangladesh
31
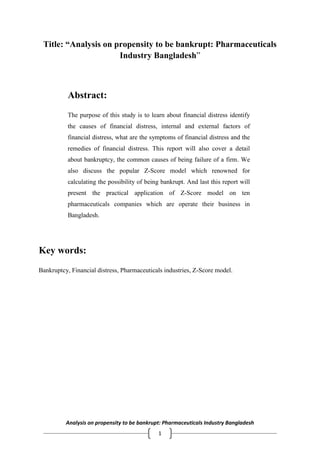
3.3.Z-Score Test Results:
Z-scores are used to predict corporate defaults and an easy-to-calculate control measure for
the financial distress status of companies in academic studies. The Z-score uses multiple
corporate income and balance sheet values to measure the financial health of a company.
The following graph represents the Z-Score results of our respective nine companies:
Sl Company
name
Year
Average
No. 2012 2011 2010 2009 2008
1. ACI ltd. 1.645585 1.991121 2.522665 3.219924 3.494479 2.57475
2. Ambee Pharma 2.658581 3.455194 3.807594 2.262337 1.86442 2.80962
3. Beximco phrma 2.95854 3.613915 4.150235 2.558028 3.797667 3.24278
4. Glaxo smith 5.862634 7.587422 14.79538 13.57896 8.739176 10.1126
5. IBN Sina 4.570932 6.194362 6.233481 4.328835 4.191209 5.10376
6. Libra infusion 0.493064 0.82265 0.486081 1.364045 2.204879 1.07414
7. Pharma Aids 8.486895 14.51512 4.975923 4.240316 3.657345 7.17512
8. Reneta Pharma 4.881344 6.442315 6.953135 10.85673 7.007838 7.22825
9. Square pharma ltd 2.93062 9.390401 8.750418 11.52025 8.458597 8.21007
10 Industry Average 3.832022 6.001389 5.852768 5.992157 4.823957 5.28124
Table no. 6: Z-Score Test Results of nine Pharmaceuticals Company
If we analyze each and every company we see that Glaxo smithkline, Pharma Aids Reneta
pharma and Square pharmaceuticals has very good Z-Score results. Their average Z=score
results is far better than industry average. So they are in Safe Zone that is Z > 2.99. IBN sina
has also a Z-Score results near the industry average. So Glaxo smithkline, IBN Sina,
Pharma Aids Reneta pharma and Square pharmaceuticals have no chance of being
bankrupt. If we analyze ACI Ltd they were in safe zone in safe zone in 2008 and 2009 . But
its Z Score falls in 2010 and 2011 and it was in Gray Zone i.e. 1.81 < Z < 2.99. but in 2012 a
further falls in Z Score Leads ACI to Distress Zone i.e. Z < 1.81. Ambee Pharma was in
Gray Zone in 2008 and 2009 and 2012. It was in safe zone for the next two years its Z Score
was 3.80 and 3.45 respectively. Which was greater than 2.99. Libra infusions Z Score was I
Gray Zone in 2008 i.e. 2.20 but since 2009 its Z score falls down to the distress zone i.e. Z <
1.81. So Libra Infusions has a great possibility of being Bankrypt. Beximco phrma ‗s Z-
Score is fluctuating frequently . In 2010 it was in Safe Zone in 2008. Its score was almost 3.5
32. Analysis on propensity to be bankrupt: Pharmaceuticals Industry Bangladesh
32
But the next year it Sore falls down to 2.55 i.e. in Gray Zone. But the next two years its score
was in Safe Zone i.e. Z > 2.99. The next year it Scores again falls down to Gray Zone.
The following Graph shows the Z-Score Test Results of nine Pharmaceuticals Company:
Graph no. 6: Z-Score Test Results of nine Pharmaceuticals Company
The above Graph Represents the Z-Score results of nine Pharmaceuticals Company. If we
analyze the graph we will see that Libra Libra Infusion has the lowest Z-Score results it
stayes in distress Zone and Glaxo smithkline has the highest average. Pharma Aids, Reneta
0.00 2.00 4.00 6.00 8.00 10.00 12.00 14.00 16.00
ACI ltd.
Ambee Pharma
Beximco phrma
Glaxo smith
IBN Sina
Libra infusion
Pharma Aids
Reneta Pharma
Square pharma ltd
Industry Average
ACI ltd.
Ambee
Pharma
Beximco
phrma
Glaxo
smith
IBN Sina
Libra
infusion
Pharma
Aids
Reneta
Pharma
Square
pharma
ltd
Industry
Average
Average 2.57 2.81 3.24 10.11 5.10 1.07 7.18 7.23 8.21 5.28
2008 3.49 1.86 3.80 8.74 4.19 2.20 3.66 7.01 8.46 4.82
2009 3.22 2.26 2.56 13.58 4.33 1.36 4.24 10.86 11.52 5.99
2010 2.52 3.81 4.15 14.80 6.23 0.49 4.98 6.95 8.75 5.85
2011 1.99 3.46 3.61 7.59 6.19 0.82 14.52 6.44 9.39 6.00
2012 1.65 2.66 2.96 5.86 4.57 0.49 8.49 4.88 2.93 3.83
Z-Score Test Results of nine Pharmaceuticals
Company
33. Analysis on propensity to be bankrupt: Pharmaceuticals Industry Bangladesh
33
Pharma Ltd and Square Pharmaceuticals have a good Score. IBN Sina has also a good Score
so they all are in Safe Zone i.e. there is no chance to be bankrupt. If we see the average of
ACI Ltd and Ambee Pharma it ZScore is in Gray Zone i.e. 1.81 < Z < 2.99. Beximco Pharma
has a fluctuating Score. But its average is in safe Zone that is greater than 2.99
3.4.Liquidity ratio:
The degree to which an asset or security can be bought or sold in the market without affecting
the asset's price. Liquidity is characterized by a high level of trading activity. Assets that can
be easily bought or sold are known as liquid assets.
3.4.1.Current ratio:
The ratio is mainly used to give an idea of the company's ability to pay back its short-term
liabilities (debt and payables) with its short-term assets (cash, inventory, receivables). The
higher the current ratio, the more capable the company is of paying its obligations.
The following table represents the current ratio of our respective nine companies:
SL.
No.
Company name Year Average
2012 2011 2010 2009 2008
1. ACI Limited 1.17361 1.30828 1.419351 1.284402 1.13369 1.263871
2. Ambee Pharmaceuticals 1.03950 1.02192 1.00168 0.99913 0.98459 1.009369
3. Beximco Pharmaceuticals 2.67457 2.69940 2.46370 2.97948 1.12365 2.388164
4. Glaxo Smithkline 1.78984 2.05068 2.59338 2.37315 3.06732 2.37488
5. IBN Sina 1.15383 1.03143 0.94582 0.72966 0.83176 0.938505
6. Libra infusion 1.53389 1.33768 0.53439 0.68996 0.83920 0.987031
7. Pharma Aids 1.71495 1.68825 1.48520 1.19824 0.93031 1.403396
8. Reneta pharma ltd. 1.15063 0.72777 0.96306 1.1655 1.14670 1.030745
9. Square Pharma ltd. 1.58122 1.58608 1.50426 2.15374 1.45539 1.656145
10. Industry average 1.53467 1.49461 1.43453 1.50814 1.27917 1.450234
Table no. 7: Current Ratio of nine Pharmaceuticals Company
34. Analysis on propensity to be bankrupt: Pharmaceuticals Industry Bangladesh
34
By analyzing the table we IBN Sina and Libra Infusion have the lowest current ratio. Their
average is less than 1 which means that they are unable to pay off their short term debt
obligations. Beximco Pharma and Glaxo smithkline has the highest current ratio. That is 2.38
and 2.37 respectively. The rest companies have almost a current ratio around the industry
average.
The following Graph shows the Current Ratios of nine Pharmaceuticals Company:
Graph no. 7: Current Ratio of nine Pharmaceuticals Company
0.00 0.50 1.00 1.50 2.00 2.50 3.00 3.50
ACI Limited
Ambee Pharmaceuticals
Beximco Pharmaceuticals
Glaxo Smithkline
IBN Sina
Libra infusion
Pharma Aids
Reneta pharma ltd.
Square Pharma ltd.
Industry average
ACI
Limited
Ambee
Pharmac
euticals
Beximco
Pharmac
euticals
Glaxo
Smithkli
ne
IBN Sina
Libra
infusion
Pharma
Aids
Reneta
pharma
ltd.
Square
Pharma
ltd.
Industry
average
Average 1.26 1.01 2.39 2.37 0.94 0.99 1.40 1.03 1.66 1.45
2008 1.13 0.98 1.12 3.07 0.83 0.84 0.93 1.15 1.46 1.28
2009 1.28 1.00 2.98 2.37 0.73 0.69 1.20 1.17 2.15 1.51
2010 1.42 1.00 2.46 2.59 0.95 0.53 1.49 0.96 1.50 1.43
2011 1.31 1.02 2.70 2.05 1.03 1.34 1.69 0.73 1.59 1.49
2012 1.17 1.04 2.67 1.79 1.15 1.53 1.71 1.15 1.58 1.53
Current Ratios of nine Pharmaceuticals
Company
35. Analysis on propensity to be bankrupt: Pharmaceuticals Industry Bangladesh
35
The graph above shows the current ratio position of the nine companies.by analyzing the
graph we see that Beximco Pharma and Glaxo smithkline has highest current ratio average.
they are almost two times able to pay off its debt. But IBN Sina and Libra Infusion have
lowest current ratio average.
3.4.2.Quick Ratio:
An indicator of a company‘s short-term liquidity. The quick ratio measures a company‘s
ability to meet its short-term obligations with its most liquid assets. For this reason, the ratio
excludes inventories from current assets,
The following table represents the Quick ratio of our respective nine companies:
SL.
No.
Company name Year Average
2012 2011 2010 2009 2008
1. ACI Limited 0.87383 0.97524 0.99948 0.90246 0.41922 0.83405025
2. Ambee Pharmaceuticals 0.49089 0.48149 0.48894 0.42732 0.37284 0.452299
3. Beximco Pharmaceuticals 1.88043 1.83395 1.67433 2.2373 0.54514 1.634234
4. Glaxo Smithkline 1.05089 0.94948 1.60499 0.95054 1.69673 1.250532
5. IBN Sina 0.78039 0.73964 0.68578 0.52790 0.60492 0.667731
6. Libra infusion 0.70074 0.75268 0.25748 0.29333 0.42786 0.486422
7. Pharma Aids 1.55913 1.49229 1.27341 0.99657 0.80223 1.22473
8. Reneta pharma ltd. 0.46004 0.45554 0.35821 0.40277 0.41621 0.4185583
9. Square Pharma ltd. 0.92104 1.58608 1.50426 2.15374 1.45539 1.524109
10. Industry Average 0.96859 1.02959 0.98298 0.98799 0.74894 0.94363
Table no. 8: Quick Ratio of nine Pharmaceuticals Company
By analyzing the table we see that Beximco Pharmaceuticals, Glaxo Smithkline, Pharma Aids
and Square Pharma ltd. have a quick ratio above 1 among the nine companies. It means that
they are in a good cash position the other has a cash ratio less than 1 A company with a
quick ratio of less than 1 cannot currently pay back its current liabilities; it's the bad sign for
investors and partners.
36. Analysis on propensity to be bankrupt: Pharmaceuticals Industry Bangladesh
36
The graph below Quick Ratio of nine Pharmaceuticals Company:
Graph no. 8: Quick Ratio of nine Pharmaceuticals Company
The graph shows the Quick ratio of nine pharmaceutical companies. Here we see that
Beximco pharma Glaxo smithkline Pharma Aids and Square Pharma Have the highest
quick ratio that is above 1. The higher the quick ratio, the better the position of the
company. So this company is in good position. And the other have less than 1.The
0.00 0.50 1.00 1.50 2.00 2.50
ACI Limited
Ambee Pharmaceuticals
Beximco Pharmaceuticals
Glaxo Smithkline
IBN Sina
Libra infusion
Pharma Aids
Reneta pharma ltd.
Square Pharma ltd.
Industry Average
ACI
Limited
Ambee
Pharma
ceutical
s
Beximco
Pharma
ceutical
s
Glaxo
Smithkli
ne
IBN Sina
Libra
infusion
Pharma
Aids
Reneta
pharma
ltd.
Square
Pharma
ltd.
Industry
Average
Average 0.83 0.45 1.63 1.25 0.67 0.49 1.22 0.42 1.52 0.94
2008 0.42 0.37 0.55 1.70 0.60 0.43 0.80 0.42 1.46 0.75
2009 0.90 0.43 2.24 0.95 0.53 0.29 1.00 0.40 2.15 0.99
2010 1.00 0.49 1.67 1.60 0.69 0.26 1.27 0.36 1.50 0.98
2011 0.98 0.48 1.83 0.95 0.74 0.75 1.49 0.46 1.59 1.03
2012 0.87 0.49 1.88 1.05 0.78 0.70 1.56 0.46 0.92 0.97
Quick Ratio of nine Pharmaceuticals
Company
37. Analysis on propensity to be bankrupt: Pharmaceuticals Industry Bangladesh
37
commonly acceptable current ratio is 1 but this companies have a quick ratio below one.
So it can be said that they are in financial distress zone.
3.5.Debt Management Ratio:
Debt Management Ratios attempt to measure the firm's use of Financial Leverage and ability
to avoid financial distress in the long run. These ratios are also known as Long-Term
Solvency Ratios. With the use of debt also comes the possibility of financial distress and
bankruptcy.
3.5.1.Debt to Total Assets Ratio:
A financial ratio that measures the extent of a company‘s or consumer‘s leverage. The debt
ratio is defined as the ratio of total debt to total assets, expressed in percentage, and can be
interpreted as the proportion of a company‘s assets that are financed by debt. The higher this
ratio, the more leveraged the company and the greater its financial risk.
The Debt to Total Asset Ratio of our respective nine companies is following:
SL.
NO.
Company name Year Average
2012 2011 2010 2009 2008
1. ACI Limited 61.524 57.037 53.974 59.809 68.118 60.092
2. Ambee Pharmaceuticals 81.250 82.156 82.962 83.586 80.032 81.997
3. Beximco Pharmaceuticals 25.139 25.637 25.258 45.275 29.484 30.159
4. Glaxo Smithkline 51.518 45.327 36.999 31.606 33.041 39.698
5. IBN Sina 36.932 52.612 57.050 55.203 63.226 53.004
6. Libra infusion 26.775 21.205 18.443 79.692 72.495 43.722
7. Pharma Aids 39.862 34.486 32.984 37.709 40.821 37.172
8. Reneta pharma ltd. 48.011 48.533 167.63 74.451 47.439 77.214
9. Square Pharma ltd. 19.630 24.177 28.937 23.122 24.917 24.156
10. Industry Average 43.405 44.151 57.640 56.707 53.117 51.004
Table no. 9: Debt to total assets ratio of nine Pharmaceuticals Company
38. Analysis on propensity to be bankrupt: Pharmaceuticals Industry Bangladesh
38
The table above represents the company‘s leverage. By analyzing this report we find that
Ambee Pharmaceuticals and Reneta Pharma Ltd have the highest percentage of debt ratio
(average) that ic 81.99 and 77.21 respectively. We know that the higher this ratio, the more
leveraged the company and the greater its financial risk. So these companies have higher
financial risk which may lead to the bankruptcy. Where Square Pharma. Ltd. has the lowest
average percentage of debt ratio i.e. 24.15. So it has a least possibility of being bankrupt.
The graph below represents the Debt to Total Asset ratios of nine Pharmaceuticals Company.
Graph no. 9: Debt to total assets of nine Pharmaceuticals Company
0 20 40 60 80 100 120 140 160 180
ACI Limited
Ambee Pharmaceuticals
Beximco Pharmaceuticals
Glaxo Smithkline
IBN Sina
Libra infusion
Pharma Aids
Reneta pharma ltd.
Square Pharma ltd.
Industry Average
ACI
Limited
Ambee
Pharmac
euticals
Beximco
Pharmac
euticals
Glaxo
Smithkli
ne
IBN Sina
Libra
infusion
Pharma
Aids
Reneta
pharma
ltd.
Square
Pharma
ltd.
Industry
Average
Average 60.092 81.997 30.159 39.698 53.004 43.722 37.172 77.214 24.156 51.004
2008 68.118 80.032 29.484 33.041 63.226 72.495 40.821 47.439 24.917 53.117
2009 59.809 83.586 45.275 31.606 55.203 79.692 37.709 74.451 23.122 56.707
2010 53.974 82.962 25.258 36.999 57.05 18.443 32.984 167.63 28.937 57.64
2011 57.037 82.156 25.637 45.327 52.612 21.205 34.486 48.533 24.177 44.151
2012 61.524 81.25 25.139 51.518 36.932 26.775 39.862 48.011 19.63 43.405
Debt to total assets ratio of nine
Pharmaceuticals Company
39. Analysis on propensity to be bankrupt: Pharmaceuticals Industry Bangladesh
39
If we analyzed the graph above it will be found that ambee pharmaceuticals and reneta
pharma Ltd. has the highest percentage of debt ratio. This means that these firms have higher
financial risk than others. This financial extra risk can lead a firm towards bankruptcy
3.5.2.Time Interest Earned (TIE) Ratio
The times interest earned ratio indicates the extent of which earnings are available to meet
interest payments. Times Interest Earned or Interest Coverage is a great tool when measuring
a company's ability to meet its debt obligations.
The Time Interest Earned Ratio of our respective nine companies is following:
SL.
NO.
Company name Year Average
2012 2011 2010 2009 2008
1. ACI Limited 2.60707 7.04246 5.90464 5.2061 2.08990 4.570038
2. Ambee Pharmaceuticals 1.74785 1.86234 1.02979 1.82222 1.81319 1.655081
3. Beximco Pharmaceuticals 3.42091 3.50302 3.21730 4.03140 4.66581 3.767691
4. Glaxo Smithkline 72.96 110.91 653.17 519.69 25.23 276.39
5. IBN Sina 18.7439 11.4590 8.90156 10.8941 11.0980 12.21934
6. Libra infusion 1.11089 1.18828 1.24378 1.29291 1.48880 1.488808
7. Pharma Aids 9.67583 11.1492 3.64555 7.44192 7.52346 9.675831
8. Reneta pharma ltd. 5.82692 7.97606 7.97606 11.1711 9.74255 8.404682
9. Square Pharma ltd. 11.8445 7.65980 10.2347 8.70818 5.96379 8.88222
10. Industry average 14.22 18.08 77.61 63.20 7.59 36.14
Table no. 10: Time Interest Earned (TIE) Ratio of nine Pharmaceuticals Company
Glaxo smithkline use too little debt to finance its asset. For this reason it has to pay a too little
interest. If we analyzed the table above we will see that Glaxo smithkline is 276.39 time able
to pay out its cost of debt. This is 7.65 times more than industry average. But Libra infusion
has only 1.49 this is 25.26 times less than industry average. it is a warning sign when interest
coverage falls below 2.5xs.so it may said that Libra Infusion is in distress zone.
40. Analysis on propensity to be bankrupt: Pharmaceuticals Industry Bangladesh
40
Time Interest Earned Ratios (TIE) are presented by the following graph:
Graph no. 10: Time Interest Earned (TIE) Ratio of nine Pharmaceuticals Company
The graph above represents the firm‘s ability to pay off its cost of debt that is interest. Here we
see that Glaxo smithkline is highly able to pay off its debt. But Libra Infusion is only 1.49
times able to pay off its debt but it should be above 2.5 times. So it may be said that Libra
infusions has a propensity of being bankrupt.
0.00 100.00 200.00 300.00 400.00 500.00 600.00 700.00
ACI Limited
Ambee Pharmaceuticals
Beximco Pharmaceuticals
Glaxo Smithkline
IBN Sina
Libra infusion
Pharma Aids
Reneta pharma ltd.
Square Pharma ltd.
Industry average
ACI
Limited
Ambee
Pharma
ceutical
s
Beximco
Pharma
ceutical
s
Glaxo
Smithkli
ne
IBN Sina
Libra
infusion
Pharma
Aids
Reneta
pharma
ltd.
Square
Pharma
ltd.
Industry
average
Average 4.57 1.66 3.77 276.39 12.22 1.49 9.68 8.40 8.88 36.14
2008 2.09 1.81 4.67 25.23 11.10 1.49 7.52 9.74 5.96 7.59
2009 5.21 1.82 4.03 519.69 10.89 1.29 7.44 11.17 8.71 63.20
2010 5.90 1.03 3.22 653.17 8.90 1.24 3.65 7.98 10.23 77.61
2011 7.04 1.86 3.50 110.91 11.46 1.19 11.15 7.98 7.66 18.08
2012 2.61 1.75 3.42 72.96 18.74 1.11 9.68 5.83 11.84 14.22
Time Intersest Earned (TIE) Ratio of nine
Pharmaceuticals Company
41. Analysis on propensity to be bankrupt: Pharmaceuticals Industry Bangladesh
41
Chapter 4 :
Conclusion
42. Analysis on propensity to be bankrupt: Pharmaceuticals Industry Bangladesh
42
4.1.Findings:
1. ACI Ltd‘s Z-Score was3.49 and 3.22 in 2008 and 2009 respectively that is in safe
zone but it falls since 2010 and in 2012 it falls down to 1.65 that is the distress zone.
2. The performance of Ambee pharmaceuticals is not satisfactory; though its Z-Score
was in Safe Zone in 2010 and 2011but its average performance is in Gray Zone.
3. The average performance of Beximco Pharma is in Safe Zone that is Z > 2.99.
4. Glaxo smith, IBN Sina Pharma, Aids Reneta Pharma and Square pharma ltd have
Performed very well their Z- Score value is far better than the industry average.that is
5.28
5. Libra infusion is in Distress Zone since 2009 to 2012. It was I Gray Zone in 2008. Its
average results are also very poor.
6. IBN Sina, Libra Infusion and Pharma Aids have negative average of working capital
to total asset ratio. A negative working capital means the firm could have face
problem to pay off its short term debt
7. Almost all the company has retained earnings to total asset ratio less than one. Theis
means all the company prefers to use debt to finance their project.
8. All the company has EBIT to total asset ratio less than one. Its means that company‘s
ability to generate profit using its assets is very low.
9. Libra Infusion and ACI Ltd has the lowest market value of equity to Total Liabilities
Ratio.so it means these firms are going backwards.
10. IBN has the highest asset turnover rate.
11. Beximco Pharmaceuticals and Glaxo Smithkline have the highest average of current
ratio than other. So these companies are highly able to pay off its short term debt than
others.
12. Ambee Pharmaceuticals and Reneta pharma ltd. have the highest percentage of Debt
to Total Asset. This means these firms have the highest financial risk.
13. Glaxo smithkline has the highest TIE ratio that is 276.39 (average) which indicates
that it has too little debt. And it is 276 times able to pay off its cost of debt.
43. Analysis on propensity to be bankrupt: Pharmaceuticals Industry Bangladesh
43
4.2.Conclusion:
This research paper summary significant studies and the bankruptcy prediction area and
provides a comparison of the different models which are commonly used. The studies
selected show that various financial information can be useful in predicting business failure.
We use Dr. Altman‘s Z-Score to predict bankruptcy as a special tool with liquidity ratios and
debt management ratio. Analyze annual reports of nine companies for five years. And collect
the financial statements data which are needed to predict the propensity to be bankruptcy. By
analyzing and calculating all the ratios we reached on a decision that Libra Infusion is
performing very poorly and its Z-Score results belongs to the distress zone.Glaxo smithkline,
Beximco Pharma, Pharma Aids has performed very well ACI Ltd and Ambee Pharma is
belongs to in the Gray Zone.
44. Analysis on propensity to be bankrupt: Pharmaceuticals Industry Bangladesh
44
References:
1. Altman, Edward I. (July 2000). ""Predicting Financial Distress of Companies"".
Retrieved on September 4th, 2009 from http://pages.stern.nyu.edu/~ealtman/Zscores.pdf:
15–22.
2. Altman, Edward I. (September 1968). ""Financial Ratios, Discriminant Analysis and the
Prediction of Corporate Bankruptcy"". Journal of Finance: 189–209.
3. Altman, Edward I. (May 2002). ""Revisiting Credit Scoring Models in a Basel II
Environment"". Prepared for "Credit Rating: Methodologies, Rationale, and Default
Risk", London Risk Books 2002.
4. Andrews,T., etal(2005), financial statement analysis Schweser Study Program.
5. Altman E.I. (1968), Financial ratios, discriminant analysis and the prediction of
corporate bankruptcy, The Journal of Finance, 23, pp 589-609.
6. Beaver, W.H (1966), Financial Ratios as predictors of failure. Journal of Accounting
Research, 4, pp 71-111.
7. Eidleman, Gregory J. (1995-02-01). "Z-Scores – A Guide to Failure Prediction". The
CPA Journal Online.
8. Eidleman, G. (1995), Z-scores- a guide to failure prediction. The CPA Journal, 12(9), pp
52-53.Schaeffer, M. (2000), International affairs. Business Credit available at
http://www.Highbeam.com/library/doc3.asp? accessed during May 2012
Appendix: