2. 130
Very
Incompetent
Evaluation and Research in Education
Moderately
Incompetent
More
or less
Competent
Moderately
Competent
Very
Competent
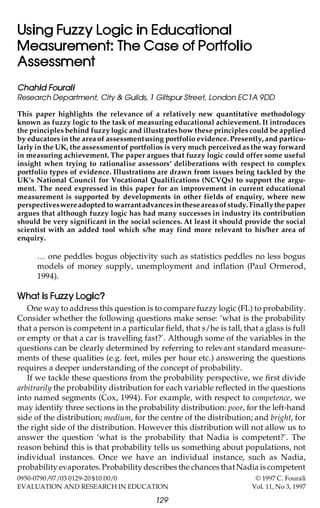
Figure 1: Semantic ambiguities between levels of competence
before she is selected from the population. Once she is selected, the probability is
gone. Cox (1994) adds that probability is an uncertainty associated with time.
Once a predicted event takes place, probability disappears. He illustrates his
point by the example ‘there is a 50% chance of rain tomorrow’. If we wait until
tomorrow, it may rain or it may not. Subsequently the uncertainty associated
with probability disappears. Smithson considered a simple case of a binary
outcome setup (say A and B). He argued that if we say the probability of an event
A occurring is P(A) = 1/2 , this could mean that we know A and B are equally
likely, or it could mean that we are utterly ignorant of the likelihood of A or B.
In addition probability is incapable of capturing any ambiguity or vagueness
about the event. In the rain example, there still remains some ambiguity about
whether the rain is a mist, light, moderate or heavy. These are fuzzy uncertainties
which can be dealt with by FL. FL can deal with the characteristics/properties of
individual cases.
If we analyse any concept (e.g. speed, height, competence etc.) we usually
notice that it is made up of a number of sub-states that stretch from a clear non
existence of a characteristic to a clear existence of the characteristic. Throughout
the continuum we may identify various semantic labels that represent various
areas of the continuum (e.g. very incompetent, moderately incompetent, more or
less competent, moderately competent and very competent). In general, there are
areas of ambiguity/overlap between the various semantic labels as shown in
Figure 1. These overlaps occur naturally and they reflect a flexibility in the
language.
FL describes properties that have continuously varying values by associating
partitions of these values with a semantic label (Cox, 1994). One of the main
strengths of FL is that it allows the semantic partitions to overlap as shown above.
This is a significant improvement on traditional probability which identifies a
group as either having or not having a particular characteristic.
Fuzziness is a measure of how well a value/measure (e.g. 6 feet) conforms to
a semantic ideal (e.g. tall). Hence if a list of criteria for measuring competence in
a particular area is agreed, fuzziness becomes the measure of how well a
particular value associated with these criteria reflects a semantic ideal (e.g. very
competent).
FL refers to the degree of membership or number of votes that a particular
3. Using Fuzzy Logic in Educational Measurement
131
Slow
Fast
Degree of membership
1
0
30
35
40
45
50
55
60
65
70
Speed
Figure 2: Perceptions of two categories of speed
value in a fuzzy set has attracted to determine the degree of compatibility
between this value and the concept underlying the set. In order to illustrate this
idea, consider Figure 2. Suppose we ask a group of people to give the minimum
speed of a car before being considered Fast. The answers could range from 35
miles per hour to 70 miles per hour.
Thus if we consider a car ‘A’ running at a speed of 45 miles per hour, we will
find that it has a degree of membership of {0.20} which means that it has a low
level of compatibility with the label Fast. We may draw a second membership
curve based on the instruction ‘give the maximum speed that makes a car run
slow’. This time the answers may range between 30 miles an hour to 60 miles an
hour. Now we may find that car ‘A’ has achieved a degree of membership of
{0.65} which means that it has a moderate level of compatibility with the label
slow. In probability theory the car is either Fast or Slow and we are not completely
sure whether it is Fast or Slow. Also in probability theory, if the probability (or
chance) that car ‘A’ is Fast is 20% then the probability that it is not fast must be
80%.
In fuzzy logic the membership degree defines to what extent the car is
considered Fast and Slow and related membership does not have to total 1
(Turban, 1992).
Origin of the Difference Between Probability Theory and Fuzzy Logic
In dealing with many aspects of our daily life we recognise that many
phenomena, situations and issues are imprecise. Yet this does not prevent us from
solving a lot of the problems that face us using this imprecision. In fact by
recognising the imprecise nature of certain phenomena we improve our
understanding of the situations we deal with. We use words such as high, low,
moderate, adequate, extremely, large, tall, adult, mature, competent etc. to deal
with problems ranging from law, financial management, engines, to psychology
and education. Yet such expressions are incompatible with traditional quantitative modelling and information system design which generally require an
either/or response to a question. However it is only making a small step to argue
4. 132
Evaluation and Research in Education
that if we can ‘reason’ using such imprecise information, so should our machines
(Cox, 1994).
In opposition to our world of greyness we find that much of our science, maths,
logic and, consequently, culture is based on a black or white interpretation of our
world (Kosko, 1994; Cox, 1994; Hisdal, 1986). Every statement is true or false,
every law either applies or does not apply. The origin of such perception was
traced back to Greek philosophy and in particular Aristotle’s binary logic ‘A or
not A’. This basic contradiction between reality and science has been of concern
amongst eminent scientists such as Einstein (Kosko, 1994) who stated: ‘ So far as
the laws of mathematics refer to reality, they are not certain. And so far as they
are certain, they do not refer to reality’.
The basic difference could be stated as follows. Formal logic and computer
programming statements are all true or all false. In other words: they correspond
to either 1 or 0. Yet statements which directly refer to the world are very rarely
that clear-cut. Their truth generally lies between total truth and total falsehood
(i.e. between 1 and 0). Note that although rating scales are being used on a regular
basis, they generally ‘constrain’ a respondent to choose one characteristic/quality
among others. They do not consider the grey area between the various
characteristics. In addition, and as mentioned above, the responses are analysed
in terms of population trends. They do not tell us about the individuals as such.
Smithson (1988) argued that many researchers have relied almost exclusively on
statistical models and methods for the quantitative analysis of human behaviour.
He adds:
Because they invoke stochastic determinism, such models are incapable of
incorporating human intentionality, purposive choice, or agency along
with constraints and influences on behaviour.
He argues that fuzzy logic and possibility theory (as opposed to probability theory
used in conventional statistics) offer an alternative framework which is compatible with psychological explanations that permit choice under partial and
uncertain constraints. He criticises the General Linear Model (which includes the
most commonly used statistical methods such as ANOVA, regression models,
factor analysis etc.) for yielding a stochastically deterministic view of human
behaviour. Smithson (1988) says that in this model behaviour which is not in
accordance with a one-to-one prediction is described as random behaviour.
However he stresses that the aim behind highlighting the weaknesses of
statistical models is not to replace them but rather ‘to permit the articulation and
investigation of interpretations that cannot be handled by the statistical perspective’.
Fuzzy logic is generally associated with Lotfi Zadeh, a professor at the
University of California, who wrote the seminal paper ‘Fuzzy sets’ in 1965. This
paper built on traditional set theory to resolve difficulties associated with the
rigid Aristotelian ‘all or nothing’ situation.
Fuzzy World, Fuzzy Logic
Consider the following situation: An experienced assessor is given a number
of assignments completed by a student, each dealing with one subcomponent
5. Using Fuzzy Logic in Educational Measurement
133
(covering either a skill or knowledge) of a particular area of competence. This
assessor is asked to make a decision about whether the student has mastered the
subcomponent or not. If the subcomponent has been mastered, the assessor
should award one mark, or pass; if not, a zero, or fail is allocated as shown in
Figure 3.
However it is very likely that the performance in the assignment is far from
being either pass or fail. So it seems that the assessor will have to do some
rounding up to be able to fit the binary system (1 or 0) to the candidate. In fact
0
1
Figure 3: Bipolar assessment
the 1 or 0 alternatives are only two of a multitude of possibilities (highlighting
various levels of fuzziness or greyness in comparison to the two extreme
alternatives) along the continuum between the two polarised positions (0 and 1).
It is very likely that a candidate position could be 1/2 which means it is situated
half way between 0 and 1 (i.e. between non-master and master). This situation is
referred to by some fuzzy scientists as reflecting a 100% fuzzy entropy (Kosko,
1994). Fuzzy entropy measures the degree of fuzziness of a fuzzy set (such as the
set of competent people). In other words, in this case, it is absolutely unclear as
to which side of the binary system the candidate should be allocated. The
candidate performance deserves neither pass or fail or the opposite might be said:
he deserves both a pass and a fail. This situation is unacceptable in conventional
Aristotelian logic since it is perceived as a contradiction in terms. However in FL
this situation is perfectly acceptable. In fact, in FL the two poles become the two
extreme instances among many other possibilities. A candidate may get a 1/4,
1/2 or 3/4 etc. An assessor using the binary system of 1 or 0 is missing very
important information about the true competence status of the candidate
compared to another assessor using the whole range of possible values in the
competence continuum. The more open are the possibilities in the continuum,
the more precise becomes the decision. Hence it may be argued that when dealing
with non clear-cut situations, precision is more on the side of fuzzy logic than a
binary perspective. Consider the scale in Figure 4.
An assessor given this scale may decide that the candidate’s ‘performance
status’ is not either a pass or a fail but rather may be classified at the 0.8 position
of the continuum. This means that although the candidate status is more towards
0
Definitely
a fail
*
0.1
*
0.2
*
0.3
*
0.4
½
*
0.5
*
0.6
*
0.7
*
0.8
Neither pass
nor fail
Figure 4: FL scale for a candidate’s performance representation
*
0.9
1
Definitely
a pass
6. 134
Evaluation and Research in Education
a pass, there are still some elements in his performance which are not totally
satisfactory. Another assessor might also show his degree of uncertainty about
the result by choosing more than one point on the scale. For instance, an assessor
might feel that a particular candidate is somewhere between 0.7 and 1 and
therefore ticks all these numbers. Fuzzy logic has developed methodologies
which take account of these variations and therefore give a more accurate picture
of the reality. It is clear that if the assessment decision involves many aspects of
competence, or the joint view of many assessors, the binary approach would lead
to a cumulative loss of information. In the following section an account will be
given of the rise of interest in portfolio assessment. The subsequent part will look
at a particular FL procedure and show how it can be applied in portfolio
assessment.
Vocational Qualification and Portfolio Assessment
In the UK portfolio assessment is becoming more and more popular as a valid
means to test candidates achievement/competence. This tendency became
particularly pronounced in vocational education after the introduction of
National Vocational Qualifications (NVQs).
These were introduced to resolve a supposed crisis in vocational education.
This was due to the fact that the system was described as overly complex and
chaotic with an urgent need for reform. In particular the standards of occupational competence were in need of clear specification so that there would be no
doubt about requirements in terms of skills and corresponding assessment
procedures to achieve a particular award.
Following two governmental reports (MSC, 1981; 1986) the problem was to be
resolved by achieving two targets:
(1) to develop valid, reliable and easily accessible nationally recognised
qualifications, and
(2) to rationalise the links and progression within and between occupational
areas so as to avoid duplication of effort by candidates who might take
different qualifications from different Awarding Bodies.
The task assigned for this purpose was to be shared between the Department of
Employment and a newly-created National Council for Vocational Qualifications
1
(NCVQ) (in Scotland, this task was assigned to the Scottish Vocational Education
Council).
The Department of Employment’s role was to help redefine standards of
competence pertaining to the various occupational areas. The statements of
competence were to be specified in outcome terms, that is ‘what must a candidate
be able to do to be deemed competent in a particular occupational area’. These
standards were to show a clear path of progression between a lower and a higher
level of a vocational qualification. The main sources for this information were to
be industry representatives who form an industry Lead Body (LB) for each
industrial area and determine the competence standards.
NCVQ, which is perceived as the main government agency for implementing
changes in vocational education, was established in 1986. Its remit is to accredit
(give the seal of approval to) newly developed National Vocational Qualifica-
7. Using Fuzzy Logic in Educational Measurement
135
tions (NVQs) based on the standards determined by the LBs. NCVQ needs to be
satisfied that the assessment procedure designed by bodies awarding the
qualification (the awarding bodies) together with the infrastructure which
supports the system of assessment are meeting its criteria.
NCVQ recognises two categories of portfolio evidence that may lead to
accreditation:
(1) past evidence (e.g. products, previous employer’s reports and qualifications). The assessment of this evidence became known as APL (or
Assessment of Prior Learning) or APA (Assessment of Prior Achievement).
(2) current evidence in the form of a portfolio of evidence (e.g. assignment,
products etc.).
Although portfolio evidence in the sense of current evidence could be found at any
level of the educational system, the advent of NVQs has extended the term to ‘any
material (past and current) which is relevant and portable’ (Fourali, 1994a).
Hence because NVQs have clearly defined standards of competence and a
broader definition of portfolio evidence than other more ‘academic’ qualifications they become a prime candidate as a test bed for FL.
Apart from the difficulties of ‘covering all criteria’ for the purpose of
assessment there was the added difficulty associated with rewarding candidates
who have just missed the required criteria as opposed to those who were far off
the target. These assessment issues may be helped by recognising the fuzzy
nature of assessment. In any case and in spite of these difficulties, criterion
referenced assessment (or some version of it) is still perceived as the way forward
at a time when ‘fitness for purpose’ is perceived as the guiding criterion for the
quality of educational ‘products’.
Using Fuzzy Logic in Portfolio Assessment: An Illustration
In portfolio assessment, the evidence presented by a candidate is matched to
the prescribed standards of competence defined in achievement outcome terms.
Subsequently an assessor will determine whether the portfolio evidence is
adequate or not to allow the candidate to obtain a certificate for a unit of
competence (i.e. a work duty within the qualification which is sought out) or the
whole qualification.
However, different portfolio assessors may have different views on the
adequacy of the evidence provided by a candidate. This means that they will have
a different perception of the candidate’s level of competence based on different
competence ‘standards’ or, even, intuitions. This is true even if there is a
prototype portfolio which may be consulted as it is almost impossible for written
advice to cover all possible alternatives. In any case fuzziness will remain
irrespective of how complex the advice is.
Hence, if we ask an assessor to deliberate on the competence status of a
candidate, based on a portfolio of evidence, he/she is not always clear where
exactly a candidate fits in a competence continuum (ranging between ‘0’, for
definitely incompetent, to ‘10’, for definitely competent — see Figure 5). The
assessor’s natural tendency would probably be to think of a range of possibilities
where a candidate’s competence status could be located. Moreover he/she will
8. 136
Evaluation and Research in Education
Table 1: Criteria for portfolio assessment
Section of
Portfolio
Authenticity
Currency
(Practices &
Equipment)
Retention
Relevance
Sufficiency
(quantity)
Variety
(contexts)
Account of
Experience
Witness
Testimony
Products
(including
photos
audios etc)
Certificates
and Awards
have to identify this range of possibilities in terms of a list of criteria, such as those
shown in Table 1, before deciding if the candidate is competent overall.
The assessor’s decision regarding the position of the candidate on the
competence continuum will depend on how satisfactory the evidence was when
evaluated in the light of each criterion. However as he/she is not always sure
exactly where to locate the candidate (there is always the benefit of the doubt!),
FL will allow and encourage him/her to identify the range of possible values that
may be acceptable to him/her.
Definitely
incompetent
0
*
1
Neither
Nor
*
2
*
3
*
4
*
5
Definitely
competent
*
6
*
7
*
8
*
9
10
Figure 5: Fuzzy rating scale
Figure 6 is an example of the possible values which may be assigned to a
candidate’s portfolio for each of the sections of portfolio identified above (first
column) in terms of the ‘Authenticity’ perspective. The instruction given to the
assessor could be in the form: ‘please represent the degree of authenticity of the
candidate’s evidence by ticking the corresponding box on the satisfaction scale.
Then decide on the minimum position you will accept and the maximum position
you will accept on the scale as representing competence and extend the rating
accordingly’. Thus, an assessor might think that the candidate’s evidence, for
criterion 2 (see Figure 6), is fairly but not totally satisfactory. Hence he/she may
start by allocating a rating of 8 on the scale. Then he/she realises that a lower
rating of 7 is also acceptable to him/her . However he/she would not accept a
rating higher than 8. Hence a rating of 7 is added.
FL enables the assessor to make use of all the information available in Figure
9. Using Fuzzy Logic in Educational Measurement
Extremely
unsatisfactory
0
*
1
137
Neither
Nor
*
2
*
3
*
4
Extremely
satisfactory
*
5
*
6
*
7
*
8
*
9
10
Scale
Criteria
0
1
2
3
4
5
6
7
8
9
10
1
2
3
4
Figure 6 Fuzzy rating ascribed to each section of portfolio for the ‘Authenticity’
quality
6 and thereby calculate an ‘optimal’ index. Because this index takes into
consideration the various uncertainties, the decisions that are reached on this
basis would tend to be more reliable.
Taking the rating shown in figure 6, one simple way of calculating the optimal
index is as follows (see section entitled ‘Improving the Proceedure’ for the
justification of the method):
9 votes (ticks) have been cast
These votes amount to: (1x4)+(2x5)+(3x6)+(2x7)+(1x8) = 54
This averages out at 54/9= 6.
This result is the optimal index for the Authenticity quality. The average of the
optimal indices (i.e. sum of indices divided by the number of indices) will be the
competence status of the individual. Thus if the obtained optimal indices for each
of the 6 qualities are as follows:
Authenticity: 8
Currency: 9
Retention: 6
Relevance: 7
Sufficiency: 8
Variety: 4
The competence status is:
8 + 9 + 6 + 7 +8 + 4
=7
6
If a candidate obtains the above index representing his/her competence status,
this will mean that the assessor is fairly but not totally satisfied that a candidate
has presented all evidence to demonstrate his/her competence. This index (i.e.
10. 138
Evaluation and Research in Education
7) is only two steps away from the middle of the scale (i.e. 5) which represents
the total uncertainty/fuzziness that the assessor holds with regard to the
competence status of the candidate. Thus if such a method is adopted, Examining
and Awarding Bodies might need to set a minimum competence status index of
no less than say ‘8’, to guarantee a pass, so as to ensure a certain degree of
reliability in the decision which gives more credibility to the resulting qualifications.
The index might also give us some ideas about the degree of leniency or
severity of an assessor. Thus whilst an assessor might give a candidate a pass as
soon as the overall index is 6, another assessor might think it is not wise to do so
until he/she has a minimum of 8. In addition the leniency/severity may also be
verified by comparing the indices obtained by two assessors based on the
evidence offered by the same candidate. This information should help in the
standardisation of assessors decisions.
Our example also shows that it is possible to represent in a very flexible
manner the assessors’ views about any aspect of competence. As it is generally
very difficult for an assessor to keep track of all his/her reservations and his/her
professional ‘gut feelings’ in a manner which is as rational as possible, fuzzy
methodology offers a very valid solution.
It is clear that a normal procedure restricted to an either/or decision could pass
a candidate whose overall competence status might be very close to the absolute
fuzziness level. This situation may arise when an assessor overlooks previous
reservations about the performance evidence because the candidate happens to
have shown some very good results in some particular aspects of the assessed
area of competence. The opposite may also happen if a candidate is failed because
of some reservations which may prevent an assessor from evaluating more
objectively the overall performance.
This procedure can be very useful when assessment situations involving
group consensus are required. The procedure can be used to take into account all
the group members’ ratings regarding various portfolios. The obtained optimal
index will be the best compromise of all the group members’ views.
The required calculations are very simple and may be carried out by hand.
However the use of a spreadsheet may facilitate the calculations as this will
enable information to be entered (and indices calculated) as the views are
expressed.
However this procedure assumes that the weights for the six criteria are the
same. If this is not the case then these weights should be determined using FL to
get more agreement between various assessors. In addition assessors may agree
that an index below a certain point for a particular criterion for any section of
portfolio may automatically disqualify the candidate from achieving a module.
Grading issues may also be resolved by using more than one scale. For
instance, once a candidate has met the criteria for a satisfactory basic
competence status (e.g. to obtain a pass), the assessor may consider him/her
for credit or distinction by adding two extra scales to the assessment process
as seen in Figure 7.
Candidates would only be considered for the subsequent scales after they have
met the requirements for the previous scales.
11. Using Fuzzy Logic in Educational Measurement
139
Definitely
incompetent
Definitely
competent
Definitely
no credit
Definitely
deserves
credit
Definitely
no distinction
Definitely
deserves
distinction
Scale 1
Scale 2
Scale 3
Figure 7: Fuzzy scales for grading decisions
This procedure is used when strict assessment criteria have been agreed.
However it is likely that those criteria are not clear. Such situations may arise
when the area of competence is not very clear (e.g. when assessors are asked to
assess creativity). In this case FL is also appropriate since it allows assessors to
locate more flexibly the candidate’s position in the competence continuum (e.g.
creativity continuum).
FL is particularly relevant when researchers are faced with phenomena that
involve a smooth progressive change. Let’s consider an area which up to now
has drawn the main benefits from the procedure: automated systems. Consider
a non-fuzzy fan motor whose speed is a function of input temperature (Viot,
1993). The current supplied to the fan motor is controlled by four sets of
temperature: cold, cool, warm and hot. Each of these triggers a different speed
of the fan. The problem arises when input temperatures move between set
boundaries. This leads to corresponding abrupt changes (i.e. sudden changes of
speed of the fan). However in a fuzzy regulated system, as the input temperature
changes, a corresponding smooth change in the fan speed takes place regardless
of inputs crossing set boundaries.
FL has great potential in improving diagnostic/formative assessment. It gives
a clearer idea about a candidate’s position in a competence continuum. In a
criterion referenced context candidate performance could be linked to a training
programme pitched at an optimum level. This level is determined by referring
to the views of assessors about candidate abilities related to a particular area of
competence. Thus in order to assess text comprehension both content complexity
and cognitive processing requirements could be considered to elicit expert views
as to the adequacy of particular test items for a particular level in a particular
area. Subsequently fuzzy indices could be calculated to give a more accurate
picture of the candidate in the competence continuum and allow a more
customised training programme to be drawn. In a Vygotskian sense the
12. 140
Evaluation and Research in Education
programme should be pitched within the zone of proximal development (see
Campione et al., 1982). These steps could be easily implemented via computerbased training (CBT).
FL has also been used to assess opinions and arguments. This is done by using
Fuzzy Cognitive Maps (FCM). An FCM represents in a ‘cognitive map’ form the
various key elements of an argument that may be put forward by one or more
subject experts on a particular issue. For instance an educational expert may write
an article about the issue of state funding for Islamic schools. The key components
of the article may be represented as in Figure 8.
Each node in the figure represents a particular element of the argument. These
elements are causally linked to one or more other nodes/elements according to
the thesis of the article. The causal effect could be either positive (e.g. where the
source node causes the destination node to increase in influence) or negative (i.e.
leading to a decrease of influence of the following nodes). The causal links will
be weighted between 0 to 1 according to the degree of relation represented by
linguistic statements. For instance a statement such as ‘State funding for Muslim
schools will reduce discrimination against the Muslim community’ may be
allocated a maximum causal effect of 1 . Whereas the statement ‘State funding
for Muslim schools can lead to some extremism’ will be given a mere 0.6 (i.e. just
above the neither/nor mid-point), as the author of the article might argue that
such extremism was not previously observed in either Catholic or Jewish schools.
FCMs such as the one shown in Figure 8 have been represented by computer
scientists using a neural network system. This system is based on a model of the
logical properties of interconnected sets of nerve cells. Thus each neurode
represents a particular factor and the connections between the neurodes
represent the relationship between them. Modelled in a neural network format,
an FCM can receive a stimulus and allow the resulting activity to resonate
through the nodes of the chart until an equilibrium is reached. Such interaction
will eventually reveal hidden patterns (Kosko, 1994) represented by either of two
possible situations:
(1) After many cycles where all the triggered nodes blink, some will switch off
to reveal a few nodes which remain on. These nodes will represent the
outcome of the tested scenario.
(2) After many cycles where all the triggered nodes blink, some will switch off
to reveal a continuous cycle made up of two or more states.
Both of these remaining conditions reflect a qualitative representation of the
obtained scenario. Thus if a particular starting point is chosen, its corresponding
node is switched on. This will lead to a chain reaction which will fire all the nodes
linked to the first ‘fired’ node according to their respective fuzzy weights. For
instance suppose we want to find out whether state funding for Muslim schools
would lead to better school results by Muslim pupils. We start by switching on
the node ‘State funding for Islamic school’. After a few moments the cycle of firing
may lead to states remaining on whilst all the others are switched off. The
remaining states may be: State funding for school, trust of state, family cohesion,
school result. Such an outcome would mean that state funding of Islamic schools
would lead to higher trust of the state (or the particular ruling party), a better
13. Using Fuzzy Logic in Educational Measurement
141
+
Demand for state
school
State schools
for Muslim people
–
–
Morality
+
–
State funding
for Islamic schools
+
–
+
–
Relativity of
values
+
+
Valuing all
citizens’ cultures
+
Discrimination
against Muslims
+
+
+
Confidence
and
self-respect
+
+
Understanding of
Islam by non-Muslim
pupils
+
–
–
+
+
Extremism
+
–
School
results
–
Crime
–
+
+
–
Trust of
state
–
–
+
–
Family
cohesion
+
–
– –
’Malaise’ riots
+
+
Match between
family and state
values
+ = Causal increase – = Causal decrease
Figure 8 Example of a fuzzy cognitive map
family understanding and good school achievements. It is clear that the
representation and its outcome will depend primarily on the chosen text/opinion.
This illustration has shown that FCM could offer a more rational way of
analysing statements that may come from either policy makers or established
authorities in a particular field to get to the consequences of their deliberations.
Such an analysis may be very useful either for educational purposes or decision
making.
Improving the Procedure
The calculation procedure used in the above example is a simplification of a
method described by Hesketh et al. (1988). This section describes the introduced
simplification and considers the possibility for incorporating well established
statistical concepts into the FL procedure.
14. 142
Evaluation and Research in Education
Illustration of a new simplified procedure
There are various equivalent ways of calculating the optimal index. Hesketh
et al. (1988) use an ‘average weighting’ procedure (Baas & Kwakernaak, 1977).
The justification for this approach was provided by Hisdal (1986; 1988) who
demonstrated a definite link between fuzzy set theory and probability theory.
As each rater can subscribe to more than one point in a membership scale, the
sum of proportions will in many cases be higher than 1. However the Hesketh et
al. (1988) procedure circumvents this problem by converting the obtained
proportions to one (i.e. re-scaling).
Hesketh et al. (1988) calculate an optimal index that takes into account all
obtained proportions as follows:
X = S U Xi (fx (Xi) / S U fx(Xi)
Where:
U stands for the Universe of a set of values
Xi stands for the rating values
fx represents the ordinate values corresponding to the rating indices (Xi)
Hence the re-scaling of each ordinate corresponding to each point Xi is
represented by fx(Xi) / S U fx(Xi) and the sum of all Xi multiplied by the respective
obtained probabilities (i.e. after the re-scaling) gives the expected value of the
distribution.
This procedure was simplified further by cutting down one unnecessary step.
The simplified procedure determines the fuzzy index without having to convert
the membership values to 1 to meet probability requirements as suggested in the
previous procedure.
The simplified procedure illustrated above (using data in Figure 6) multiplies
each rating by its corresponding value then divides the obtained sum of the
products by the total number of ratings (i.e. ticks) as shown below.
X=
å fx ( Xi )
Nr
Where:
Xi stands for the rating values
fx represents the ordinate values corresponding to the rating indices (Xi)
Nr stands for the number of ratings (ticks)
Sharpening the reliability using traditional statistical concepts
The procedure may also benefit from determining indices equivalent to those
found in statistical procedures. For instance it would be interesting to get the
equivalent of a standard deviation (SD) or the average dispersion/spread of the
ratings.
A useful index that can be used for this purpose is:
SD (fuzzy) = Nr / Nc
Where:
(1)
15. Using Fuzzy Logic in Educational Measurement
143
Nr stands for the number of ratings
Nc stands for the number of criteria (e.g. identified aspects of competence
being considered).
The formula means that the FL standard deviation for one assessor is obtained
by adding up the number of ratings on each scale (i.e. ticks) and dividing the
outcome by the number of criteria an assessor had to consider before giving
his/her overall decision.
If more than one assessor is involved then the formula becomes:
SD (fuzzy) =
åN r
Nc Na
(2)
Where:
Nr stands for the number of ratings;
Nc stands for the number of criteria (e.g. identified aspects of competence
being considered);
Na is the number of participants (assessors) involved in the decision.
Hence the SD(fuzzy) index may reflect the dispersion of ratings so as to reveal
the degree of precision which one assessor or more shows for a particular
portfolio of evidence.
Thus if we refer to the above example in Figure 6, SD (fuzzy) for one assessor
= 9/4 = 2.25 . With two assessors rating identically, this gives: 18/(4x2)=2.25. This
shows that the assessor was, on average, allocating two positions in the
competence continuum which could represent the candidate’s level. The smaller
the SD(fuzzy), the higher the precision/certainty of the assessors’ rating.
It appears that the simplicity of the procedure makes it amenable to
determining new formulae that represent concepts in current statistical theory
which may be very useful for further analysis of information and improving the
validity/reliability of results.
Relevance of FL to Current Thinking
The notion of fuzziness is very much in tune with the zeitgest of current
thinking. Thus it may be argued that current views on literary theory, psychology
(as represented in cognitive psychology) and chaos theory all appear to suggest
that the world as we know it is complex and may attract many possible meanings.
Gray (1992) suggests that the development of literary theory has led to the
demolition of many assumptions that used to prevail in relation to texts. He
argues that it is no longer assumed that literary work contains universally
acceptable truths and values, that texts have precise and definite meanings that
all readers can derive and that there are agreed ‘objective’ values which
determine what is good and bad writing.
It is clear that this idea of relativity and indecisiveness in meaning is very much
the theme of FL. The present wave of postmodernism argues that ‘meaning is
neither inherent in language, nor in the world of things, but is “constructed” by
conventional frameworks of thought and language’ (Gray, 1992; Lyotard, 1985).
Many postmodern texts are therefore organised to reveal the instability of
16. 144
Evaluation and Research in Education
language, and to show how meanings and values are temporary and self-generated constructions (Buci-Glucksmann, 1985). By extension, it may be argued that
the meanings and values of any artistic work (e.g. music, painting etc.) are
temporary and self-generated constructions. This view is very much similar to
recent psychological views which stress the relativity of meaning constructed by
different individuals (e.g. see Gardner, 1985; Beck, 1962).
Chaos theory is another field of study which seems to portray a picture similar
to the two above areas of study. Chaos theory became popular after the
realisation that classical physics, together with quantum theory, which deals
primarily with ordered systems, cannot deal with many situations in the natural
world which exhibit a tendency toward disorder (Microsoft ® Encarta, 1994). For
example, large-scale weather systems tend to develop random patterns as they
interact with more complex local systems.
In the above mentioned three areas of enquiry, the arguments appear to
suggest that conventional views and systems have failed to adequately represent
the complexity and variety of many aspects of our world. The models adopted
appear to either overlook the relativity of meanings (e.g. in literary work or
cognitive constructivist psychology) or fail to adequately record the complexity
of the phenomena. In terms of complexity, when many factors are involved in
determining a phenomenon, the FL method considers both whether a particular
event affects an outcome but also to what degree it affects it (as illustrated above
with the FCMs). Hence the above suggests that the FL method fits better (than
conventional quantitative methods) with current thinking in that it is more
sensitive to both relativity of meaning and intensity of effects as observed in
complex systems. Consequently, FL appears to be a more valid quantitative
approach when studying many aspects of our world.
Politics of Acceptance
There could be various political considerations that have influenced and may
influence the way FL is disseminated. The first one is related to academia and
what determines what is acceptable or ‘rigorous’ to a community of scientists.
This aspect has been dealt with by a host of philosophical scientists (e.g. Kuhn,
1962). At this level FL may be perceived as a world view. It favours multivalence
as opposed to bivalence. Kosko (1994) highlighted a psychological element
associated with the reluctance of certain scientists to adopt a new perspective. He
argued that scientists who do not subscribe to a new perspective may feel
threatened by it and therefore will work hard at discouraging its dissemination.
Their response may take various forms. For example a group of scientists who
are linked by a common view may help promote the views of their ‘party’
through publications, media, appointments etc. and discourage the views of the
opposite camp. The view that ‘ideology’ might compromise scientific probity and
thereby determine what is fashionable and what is not is not new. However it is
not always clear who are the victims of this bias.
Viot (1993) recently suggested adopting a more positive label, such as ‘soft
logic’, for the method rather than fuzzy logic. This should create a better
‘selling-point’ for the method. It may be argued that ‘smooth logic’ may be a more
appropriate label since softness may be perceived as ‘being less rigorous’ (i.e. in
17. Using Fuzzy Logic in Educational Measurement
145
the sense of being ‘a softer option’). It appears that the word ‘fuzzy’ may have
some negative connotations which could prevent a ‘surface-level’ observer from
looking closer at the method and what it could offer. It is also clear that the name
of the method has been used by some opponents for derisory purposes. For
instance Kosko (1994) quotes a case where a famous scientist presented the
method so that his audience would interpret it as ‘everything goes’. However
one can also quote another example where an apparently negative label did not
prevent a method from being widely known as is the case in chaos theory.
Another consideration is linked to the fact that politicians are constantly
looking for easy, quick fix tools which are cheap and yet provide highly effective
results. This situation may raise some concern in some researchers who may feel
that what they need is not quick, short-term solutions but valid , tested
procedures that provide long-term solutions. In order to respond to such
criticism one needs to refer to the fact that FL is a tool and as such will depend
on its user/s to use it efficiently and effectively. In addition like any other tool,
it will need testing before being rejected (or accepted). This will not happen until
an open debate about the method is initiated where various analysts are
encouraged to express either their support or reservations.
Fuzzy logicians have also argued that when ‘bivalent researchers’ are faced
with fuzzy types of problems, they tackle them by throwing more maths at them
(Kosko, 1994). This approach is seen as both inadequate and unnecessarily
complex. Other measurement theorists have argued that FL is only a special case
of probability theory (e.g. see Zadeh, 1986). It is likely that both views have some
truth. However one is also justified in asking ‘Do we allow theoretical
speculations to overshadow the utility of a method?’.
Ultimately whatever procedure researchers may prefer in tackling their
problems, it is best to make as many methods as possible available to them, so
that they may assess the pros and cons of each and make a better informed
decision based on the particulars of their situation. Kosko (1994) argued that
preventing awareness of fuzzy procedure could lower the quality of research
products. He gave the example of Japan which capitalised on the qualities of the
FL procedure and produced smarter industrial products than those produced in
the West (e.g. camcorders, cameras, washing machines etc.). Hence it is likely that
some western countries might have lost out in terms of industrial competitive
edge as a result of dragging their feet because of some kind of scientific snobbery.
Conclusion: The Way Ahead
This paper presents a relatively new procedure called fuzzy logic which
appears to be useful in tackling problems where the situation does not involve
‘an either/or’ decision.
The paper argues that FL is appropriate for many educational situations. In
particular, it argues that by allowing educators to express views in more flexible
ways, FL will make decisions more valid and credible to both teachers/assessors
and policy makers.
The FL procedure described in this paper allows assessors to come to decisions
using the methods that they are most used to: a balance of knowledge and
intuition. It is important to mention however that the method should not detract
18. 146
Evaluation and Research in Education
from the fact that assessment is firmly based on the agreed standards of
competence and the assessment criteria that must be satisfied. The FL procedure
is merely a way of structuring and maximising information for the purpose of
assessment against these standards. It is believed that as this procedure gains
more ground, users will realise that its perspective is closer to natural human
judgement than other existing quantitative approaches. Moreover the procedure
advocated in this paper shows clearly its links with traditional probability theory
and the computations involved are so simple that manual calculation is all that
is needed to obtain the indices based on the assessors’ views.
Overall the above procedure which combines both fuzzy logic principles with
probability theory has the following advantages (see Fourali, 1994b):
(1) By including probability theory interpretation, this approach is less alien to
some users.
(2) Probability theory, as argued by fuzzy logic researchers, does not readily
recognise the uncertainty between a white or black answer. As Baas &
Kwakernaak (1977) put it, ‘this approach (i.e. FL) has the advantage of
allowing the individual committee members the opportunity to express
their opinions unequivocally’.
(3) It avoids restrictions and gains useful extra information which may be
decisive between a ‘pass’ and a ‘fail’.
(4) It allows the use of facts and intuition.
(5) It allows a smoother use of methodologies using causal inferences (e.g.
Fuzzy Cognitive Maps).
(6) It leads to less drastic consequences than in a black and white situation. Thus
being a 100% wrong as opposed to being 100% right is more serious than
finding out that the estimated degree of grey area is 80% as opposed to 90%
(Turban, 1992).
In the context of portfolio assessment, there is much potential but FL must
obviously be studied further to assess both its relative effectiveness and
reliability.
The paper has simplified the selected FL procedure and showed that some
traditional concepts in statistical theory (e.g. standard deviation) could easily be
incorporated in the new procedure in order to enrich obtained results with other
perspectives. From this point of view, it may be argued that FL should not
necessarily be perceived as an alternative procedure but rather as an extra tool
that could be integrated with other existing quantitative tools.
This paper also shows how FL could be used in formative assessment through
its potential for allowing more consensus about a candidate’s current level of
competence and his/her corresponding next level of study. It also shows the
relevance of Fuzzy Cognitive Maps to the aim of identifying , analysing and
summing up opinions and theses relating to particular fields of study. In fact the
versatility of FL is such that the procedure could be used almost anywhere that
an individual is required to balance several, subjective factors to arrive at a
decision. Such situations may include making staff selection decisions, competition decisions (e.g. art/beauty) and even business financial/policy decisions. The
potential for this method in taking account of the ‘views’ of several group
19. Using Fuzzy Logic in Educational Measurement
147
members makes it particularly useful in the context of group decision making
such as a top team trying to proceed with a particular organisational policy.
Hence this versatility, and the large variety of possibilities that FL may be applied
to, should warrant a greater dissemination of the procedure so that a more open
debate can be initiated about its real value.
Acknowledgement
The author would like to thank his colleagues Nick Stratton, Lorraine
Weatherstone, Jackie Lubbock and Diane Reay at City and Guilds and the
anonymous reviewers for their valuable comments on various versions of the
paper. The author’s gratitude must also go to Dr Keith Morrison for the generous
guidance he provided during the preparation of this paper. However final
responsibility for any error lies solely with the author.
Notes
1. New legislation suggests that NCVQ is to merge with the School Curriculum and
Assessment Authority (SCAA) to produce a more unified educational body).
References
Baas, S. and Kwakernaak, H. (1977). Rating and ranking multiple-aspects alternatives
using fuzzy sets. Automatica 13, 47–58.
Beck, A.T. (1962) Reliability of psychiatric diagnoses: A critique of systematic studies.
American Journal of Psychiatry 119, 210–15.
Buci-Glucksmann, C. (1985) La Postmodernité. In Dix ans de Philosophie en France.
Magazine Littéraire No 225 (December).
Campione. J, Brown, A. and Ferrara, R. (1982) Mental retardation and intelligence. In R.
Sternberg (ed.) Handbook of Human Intelligence. Cambridge: Cambridge University
Press.
Cox, E. (1994) The Fuzzy Systems Handbook: A Practitioner’s Guide to Building, Using and
Maintaining Fuzzy Systems. London: Academic Press.
Fourali, C. (1994a) Glossary of terms Used in Standards Development, Curriculum Design,
Assessment and Accreditation (2nd edn). London: City & Guilds.
Fourali, C. (1994b) Fuzzy logic and the quality of assessment of portfolios. Fuzzy Sets and
Systems (Vol.68) (pp.123–39). The Netherlands: Elsevier Science B.V.
Gardner, H. (1985) The Mind’s New Science, A History of the Cognitive Revolution. New York:
Basic Books.
Gray, M. (1992) A Dictionary of Literary Terms. Beirut: York Press.
Hesketh, B., Prior, R., Gleitzman, M. and Hesketh, T. (1988) Practical applications and
psychometric evaluation of a computerised fuzzy graphic rating scale. In Zetenyi (ed.)
Fuzzy Sets in Psychology. North Holland: Elsevier Science Publishers B.V.
Hisdal, E. (1986) Infinite-valued logic based on two-valued logic and probability. Part 1.1
Difficulties with present-day fuzzy-set theory and their resolution in the TEE model.
Internat. J. Man-Machine Studies 25 (89–111).
Hisdal, E. (1988) Are grades of membership probabilities? Fuzzy Sets and Systems 25
(325–48).
Kosko, B. (1994) Fuzzy Thinking. London: Flamingo.
Kuhn, T.S. (1962) The Structure of Scientific Revolutions. Chicago, IL: University of Chicago
Press.
Lyotard, J. (1985) Retour au Postmoderne. In Dix ans de Philosophie en France. Magazine
Littéraire. No 225 (December).
Microsoft ® Encarta (1994) Chaos Theory. Microsoft Corporation. Funk & Wagnall’s
Corporation.
20. 148
Evaluation and Research in Education
MSC (Manpower Services Commission) (1981) A New Training Initiative: Agenda for Action.
London: HMSO.
— (1986) Review of Vocational Qualifications in England and Wales. London. HMSO.
Paul Ormerod (1994) The Death of Economics. London: Faber and Faber.
Smithson, M. (1988) Possibility theory, fuzzy logic, and psychological explanation. In
Zetenyi (ed.) Fuzzy Sets in Psychology. North Holland: Elsevier Science Publishers B.V.
Turban, E. (1992) Expert Systems and Applied Artificial Intelligence. New York: MacMillan.
Viot, G. (1993) Fuzzy logic: Concepts to constructs. AI Expert, November.
Zadeh, L.A. (1965) Fuzzy sets. Inf. Contr. 8, 338–53.
— (1986) Is probability theory sufficient for dealing with uncertainty in AI: A negative
view. In L.N. Kanal and J.F. Lemmer (eds) Uncertainty in Artificial Intelligence. North
Holland: Elsevier Science Publishers B.V.