SlideShare une entreprise Scribd logo
1  sur  6
Télécharger pour lire hors ligne
The Swedish Economy
Monthly letter from Swedbank’s Economic Research Department
by Magnus Alvesson                                                                                   No. 2 • 24 February 2011


       Mixed economic signals could complicate upcoming
       wage negotiations
       • After the strong economic recovery last fall, we have seen a slightly slower
         expansion in recent months. The unusually cold weather probably had
         something to do with it, but at the same time there are signs that the rapid
         expansion the Swedish economy experienced in 2010 is tailing off.

       • Mixed economic signals, together with continued high unemployment, could
         complicate upcoming wage negotiations. Despite showing restraint during the
         crisis years, Sweden will probably have little leeway to increase wages in the
         years immediately ahead due to its relative competitive weakness. In
         addition, high unemployment among groups that haven’t yet gained a
         foothold in the job market would limit increases in the minimum wage.

       • To no one's surprise, the Riksbank raised its benchmark rate from 1.25% to
         1.50% in February while revising the repo rate path upward. This means that
         the Riksbank expects that its benchmark rate, and interest rates in general,
         will have to be raised faster than before. At the same time January's inflation
         was significantly lower than forecast and together with low inflation pressure
         from wages points to a slower rate of increase than the repo rate path would
         suggest. Its fiscal strength gives Sweden the option of taking further
         measures to reduce the high unemployment.


Continued strong dynamics – cool-down in                             Industry and service production as well as industrial
                                                                              capacity utilisation, Q1-07 – Q4-10
sight                                                                                 (Annual change, %)
The rapid rebound in both the industrial and service            20                                                      100
sectors showed signs of slowing in the last months              15                                                      95
of 2010. Industrial production fell by 2.1%                     10                                                      90
(seasonally adjusted) between November and                       5                                                      85
December, while service production was down 0.4%                 0                                                      80
(not seasonally adjusted). The unusually harsh                  -5                                                      75
winter weather has certainly had an impact, but the            -10                                                      70
recovery seems to be slightly losing steam anyway.             -15                                                      65
Although industrial production has not returned to             -20                                                      60
the levels from before the crisis, capacity utilisation        -25                                                      55
is rising and increased investments will be needed if          -30                                                      50
production is going to continue to grow at the same              Q1-07 Q3-07 Q1-08 Q4-08 Q2-09 Q4-09 Q3-10
rate. Industrial inventories also shrank during the                     Capacity utilisation - manuf act. (%, sa, rs)
last quarter of the year, marking an end to an                          Manuf acturing
upswing that began early last year.                                     Services
                                                               Source: Statistics Sweden.

                                                               Signals from the labour market were mixed at the
                                                               start of the year. Although unemployment in January


                     Economic Research Department, Swedbank AB (publ), 105 34 Stockholm, tfn 08-5859 1000
          E-mail: ek.sekr@swedbank.se www.swedbank.se. Responsible publisher: Cecilia Hermansson, +46 8-5859 7720.
                            Magnus Alvesson, +46 8-5859 3341, Jörgen Kennemar, +46 8-5859 7730
The Swedish Economy

                                   Monthly letter from Swedbank’s Economic Research Department, continued

                                                             No. 2 • 24 February 2011


rose to 8.2% (7.9% seasonally adjusted), the                                     The Swedish economic recovery was exceptionally
employment rate was up by 3% compared with the                                   strong during the first three quarters of 2010. On
same period of 2010. The reason was a significant                                average, GDP grew by nearly 2% per quarter,
increase in the labour supply. This could be                                     nearly twice as much as other developed
because an improved job market gives hope to                                     economies. As mentioned in our January forecast,
people who had given up looking for a job and                                    we expect that quarterly growth slowed during the
brings them back into the ranks of the unemployed.                               last quarter, but that the rapid expansion in the
Another reason may be that many people saw their                                 Swedish economy prevailed. On an annual basis,
unemployment insurance run out and had to start                                  we predict a growth rate of slightly over 7%. In many
looking for work again.                                                          other comparable economies, growth slowed at the
                                                                                 end of last year. This was certainly due to some
              Labour market trends, Jan 2006 – Jan 2011                          extent to the cold winter weather. It is likely that we
                     (’000s, seasonally adjusted)
                                                                                 will see a similar pattern for the Swedish economy.
5100                                                              10.0

5000                                                              9.0                                     GDP growth 2010
                                                                  8.0
                                                                                              (Quarterly growth, %, seasonally adjusted)
4900                                                                             3.0
                                                                  7.0
4800                                                              6.0            2.5                                               1.9
                                                                                                                        ave 2010
4700                                                              5.0
                                                                                 2.0
4600                                                              4.0
                                                                  3.0            1.5           1.0
4500                                                                                    0.7                                  0.6                 0.4
                                 Employment                       2.0                                  1.1         1.0 0.5                 0.7
4400                             Labor supply                                    1.0
                                                                  1.0                                        0.4
                                 Unemployment rate (%, sa, rs)
4300                                                              0.0            0.5
     Jan-05    Jan-06   Jan-07   Jan-08   Jan-09    Jan-10   Jan-11
                                                                                 0.0
Source: Statistics Sweden (LFS).
                                                                             -0.5
January inflation is hard to interpret. Consumer
prices fell by 0.5% compared with December 2010
at the same time that the annual rate continued to
rise, to 2.5%, against 2.3% in the previous month.                               Source: Ecowin.
Underlying inflation (CPIF, i.e., adjusted for interest
rate effects) fell to an annualised rate of 1.4%,                                Wage negotiations and Swedish
compared with 2.3% in December. This is partly                                   competitiveness
because certain product groups declined in price,
e.g., clothing, air travel and, somewhat surprisingly,                           During collective bargaining negotiations in the crisis
food. At the same time revisions to food basket                                  years of 2009 and 2010, wage growth slowed. This
weights also caused changes in interest rates to                                 helped to contain unemployment and make Swedish
have a big impact on CPI in January.                                             businesses more competitive. A weaker Swedish
                                                                                 krona compared with key trade partners was also a
                  Inflation rate, Jan 2005 – Jan 2011                            factor.1 As the economy has rebounded, so have
                          (Percentage change)                                    expectations that upcoming wage negotiations
5                                                                                should compensate for the previous restraint. This
4                                                                                would help household finances when interest
                                                                                 expenses and prices rise, ensuring a decent rate of
3
                                                                                 increase in private consumption. At the same time
2                                                                                steep wage increases would weaken companies’
1
                                                                                 competitiveness and slow job growth.
0

-1

-2            CPI (m-o-m)            CPI (Ann)
              CPIF (Ann)
-3
 Jan-05        Feb-06     Mar-07     Apr-08        May-09    Jun-10
Source: Statistics Sweden.                                                       1
                                                                                  Germany, Norway, Denmark, Netherlands and the UK
                                                                                 are Sweden's largest export markets.


                                                                         2 (6)
The Swedish Economy

                             Monthly letter from Swedbank’s Economic Research Department, continued

                                                   No. 2 • 24 February 2011


    Rate of wage growth, entire economy, Jan 1992 – Nov 2010           Thanks to lower consumer prices, coupled with the
                       (Annual change, %)
                                                                       high-priced wage agreements that still remain in
8.0                                                                    effect, real wage growth has been strong in recent
             Wage drif t     Wage increase      Agreement              years. As a result, household finances have
7.0
                                                                       improved despite rising unemployment. Combined
6.0                                                                    with tax cuts during the period, real disposable
                                                                       income has increased, thanks to which strong
5.0
                                                                       consumer spending was able to mitigate the
4.0                                                                    economic downturn in 2008 and 2009. Higher
                                                                       inflation in 2010, initially due to the weaker krona,
3.0                                                                    which led to higher import prices and later to higher
2.0
                                                                       global commodity prices, has now impacted the real
                                                                       value of previously agreed wage increases. As a
1.0                                                                    result, more wage earners are seeing shrinking real
                                                                       wages, which could hurt consumer spending and
0.0
                                                                       lead to higher wage demands in future collective
    Jan-92 Jul-94 Jan-97 Jul-99 Jan-02 Jul-04 Jan-07 Jul-09
                                                                       bargaining negotiations.
Source: National Mediation Office.
                                                                        Rate of wage growth, entire economy, Jan 2005 – Nov 2010
                                                                                              (Annual change, %)
The agreements signed in 2007, which in many
                                                                       6.0
cases stretch until 2010, were influenced by the                                   Nominal wages
strong economic growth at the time, which also led                     5.0         Inf lation (CPI)
to relatively high contractual wage increases during                               Real wages
the financial crisis. In 2008 and 2009 contractual                     4.0
wages rose by an average of 3.2% and 2.8%,                             3.0
respectively.2 Wage drift fell to less than a half
percentage point from nearly 2 percentage points in                    2.0
the 2000’s. This is due to rising unemployment and
                                                                       1.0
less competition for employees, but also because
employees have had less opportunity to change                          0.0
jobs. In good times this pushes total wages higher.
With less wage drift, the actual average wage                      -1.0
increase was about 4.3% in 2008 and about 3.4% in
                                                                   -2.0
2009.
                                                                         Jan-05 Nov-05 Sep-06 Jul-07 May-08 Mar-09 Jan-10 Nov-10
In 2010 new agreements were signed for around 3.3                      Source: Statistics Sweden and National Mediation Office.
million employees. The economic crisis kept wage
increases relatively low, particularly compared with                   A large share of the agreements signed in 2009 and
the two previous years, but also compared with the                     2010 were short in length and expire in 2011 and
entire period since the 1990’s crisis. Contractual                     early 2012. Facing economic uncertainty, unions
wage increases ended up at nearly 2% per year with                     were interested in retaining the option to revise
little variation between industrial and service                        wages if the economy rebounded. It is estimated
sectors. Wages for workers generally increased at a                    that agreements for around 400 000 workers will be
slightly higher rate in the agreements, 3.5% over 24                   up for renegotiation in 2011, including salaried
months, while white-collar wages rose by 2.5%                          industrial employees (whose agreement expires on
during the same period. Through November 2010                          September 30). Negotiations for industrial workers
the average was 2.4% at an annual rate, which                          will also begin in 2011 (their agreement expires on
includes wage drift and the remaining effects of                       31     January    2012).     These    comprehensive
earlier agreements. However, the rate of increase                      agreements traditionally set the norm for the rest of
had fallen from 3.5% at the beginning of the year to                   the market, so some coordination will be expected
2.0% in November.                                                      between these groups. The negotiations for salaried
                                                                       industrial employees beginning this spring will be
2
 The wage figures referred to here, which are based on                 important to negotiations in both 2011 and 2012.
data from the National Mediation Office, increased
considerably faster than comparable figures based on                   In 2012 agreements await for a total of 2.4 million
national accounts. This may be largely because the latter              workers, including a half-million retail workers
do not include bonuses or take into account the shorter                (whose agreement expires on 31 March 2012) and
work hours agreed to in 2009.


                                                               3 (6)
The Swedish Economy

                                  Monthly letter from Swedbank’s Economic Research Department, continued

                                                             No. 2 • 24 February 2011


over one million municipal workers (whose                                          about 23% of Sweden's goods exports (Germany
agreement expires on April 30). Economic                                           accounts for about 10%).
development in coming months, and how it is                                                                                                            1/
interpreted, will therefore have a major impact on                                              Hourly labour costs in industry, 2005 – 2010
                                                                                                             (Annual change, %)
wages in Sweden and as a result, on the country's
                                                                                   9
competitiveness and unemployment levels.
                                                                                                     Germany                 Netherlands           Finland
                                                                                   8
                                                                                                     Denmark                 UK                    Norway
  Wage level according to agreements and renegotiations,
                        2010 - 2012                                                7                 Sweden
                  (Index March 2010=100)                                           6
106
                                                                                   5
                                                                    1000           4
104
                                                                                   3
                                                                                   2
102
                                                                                   1
                                                                    500
                                                                                   0
100
                                                                               -1
                                                                                              2005      2006          2007       2008        2009           2010
 98                                                                0               Source: National Mediation Office.
  mar-10        sep-10        mar-11      sep-11        mar-12                     1/ First three quarters of 2010.
      Agreement ends ('000 empl., rs)      Industry - salaried
      Industry - workers                   Construction
      Transport                            Retail                                  A rapid increase in hourly wages could be offset if
      Local government
                                                                                   productivity rises faster than in competing countries.
Sources: National Institute of Economic Research and National
Mediation Office.                                                                  Swedish productivity climbed quickly after the
                                                                                   financial crisis in the early 1990s, gaining over 7%
When wage negotiations now begin, one of the main                                  annually in 1994-1998, nearly twice the EU and
topics will be the competitiveness of the Swedish                                  OECD averages. The rate was slightly lower, at
economy relative to key export markets.                                            6.8%, until 2003, before falling to about 2.5% in
Competitiveness is partly determined by wages, but                                 2004-2009, again affected by an economic crisis.
also by productivity compared with other countries.                                After the major economic fluctuations caused by the
Exchange rates also have a big impact on the prices                                current crisis, Swedish productivity can’t be
of Swedish goods and services abroad, and on                                       expected to grow by more than 2-3% per year under
import competition in Swedish markets. Wages                                       more normal conditions. This leaves even less room
affect other aspects of the economy as well. In                                    for wage increases than in the early 2000’s.
addition to household budgets, which are the
                                                                                             Productivity in manufacturing industry, 2005 – 2009
determining factor for consumer spending, wages                                                               (Annual change, %)
are critical to unemployment. For many people
                                                                                   15.0               Germany                Netherlands          Finland
currently outside the job market, minimum wages
                                                                                                      Denmark                UK                   Norway
are especially important.                                                                             Sweden
                                                                                   10.0
There are a number of measures of industrial
wages, but many aren’t totally comparable between
countries. Any such comparisons therefore have to                                      5.0
be viewed cautiously. One of the most common
indicators is the hourly labour cost. In Sweden, it fell                               0.0
during the first three quarters of 2010 and rose by
only 1.9% on an annual basis, compared with an
                                                                                   -5.0
average of nearly 3% in 2005-2009 and slightly over
4% in 2000-2004. In Germany, hourly wages have
increased even slower, especially during the first                             -10.0
half of the 2000’s (2.5%). Compared with other                                                   2005          2006           2007         2008        2009
competing countries, Sweden has seen lower wage                                    Source: National Mediation Office.
increases, particularly relative to neighbours such as
Norway, Denmark and Finland, which account for                                     Unit labour costs – a combination of productivity and
                                                                                   labour costs – indicate that Sweden was slightly less


                                                                           4 (6)
The Swedish Economy

                           Monthly letter from Swedbank’s Economic Research Department, continued

                                                  No. 2 • 24 February 2011


competitive, based on domestic factors, than most                           Real effective exchange rates, Jan 1994 – Jun 2010
                                                                           (Nominal exchange rates deflated by the unit labour cost)
of its main trading partners. Rapid growth was led
by rising labour costs, but this trend was broken in
                                                                                         Norway                Finland
2009 when Swedish costs fell as wages dropped                     135                    Germany               Netherlands
more than in key export markets at the same time                                         Sweden                UK

that productivity stopped declining. The exception is             125
Germany, where unit labour costs have increased
even more slowly since the mid-2000’s, putting it in              115
a strong position as the global economy recovers.
                                                                  105
                Unit labour cost 2000 – 2010
                  (Index 2005=100, trend)                             95

120
                                                                      85
                                                                                         Index 1999=100
115
                                                                      75
110                                                                     Jan-94    Oct-96     Jul-99   Apr-02    Jan-05       Oct-07

105                                                                   Source: EU Commission.

100                                                                   Wage negotiations will also have a direct effect on
 95
                                                                      job creation and unemployment. The low wage
                                                                      increases and layoffs during the crisis years helped
 90                  Denmark             Finland                      to keep unemployment in check. Sweden’s relatively
                     Germany             Netherlands                  high minimum wages limit job opportunities for those
 85                  Sweden              UK
                     United States
                                                                      most in need, however. The people finding it hardest
 80                                                                   to gain a foothold in the job market are often young
   Q1-00 Q3-01 Q1-03 Q3-04 Q1-06 Q3-07 Q1-09 Q3-10                    or long-term unemployed. It would be easier for
Source: OECD.
                                                                      them to get work if starting salaries were relatively
                                                                      low.
The weakening of the krona made Sweden more
                                                                      In summary, there is a risk that collective bargaining
competitive during the economic crisis, but this has
                                                                      negotiations could be difficult and protracted.
changed since the currency again increased in
                                                                      Economic conditions are uncertain at the same time
value last fall. Currency fluctuations clearly have an
                                                                      that wage earners have had to make large
impact on the economy's cost structure and, as a
                                                                      concessions to keep Swedish businesses
result, its competitive strength. Since the mid-1990s
                                                                      competitive and limit the impact of the global
real exchange rates have trended lower, giving
                                                                      financial crisis. Jobs have increased for several
Sweden a competitive boost relative to its key
                                                                      months, which is evident by the labour shortage in
export markets. This has reinforced the effects of its
                                                                      certain sectors. This could mean higher wages,
lower unit labour costs. Given the stability of the
                                                                      increasing the pressure on the negotiating parties.
economy, especially in fiscal terms thanks to budget
                                                                      On the other hand, overall unemployment remains
surpluses and shrinking government debt, there is a
                                                                      high, which would favour restraint with regard to
chance that the krona will continue to rise in value.
                                                                      minimum wages. Productivity growth is likely to level
This puts an additional limit on how much wages
                                                                      off after the rapid rebound at the same time that the
can increase without hurting Swedish businesses.
                                                                      krona will continue to rise slightly. Given the strong
                                                                      job recovery, however, the risks in the wage
                                                                      forecast in our economic report in January may
                                                                      have been on the upside.

                                                                      The economic turnaround is a challenge for
                                                                      economic policy
                                                                      As expected, the Riksbank raised the repo rate at its
                                                                      most recent monetary meeting from 1.25% to 1.50%
                                                                      at the same time that the repo rate path was
                                                                      increased. The assumption is that monetary policy
                                                                      will continue to normalise, though at a slightly higher
                                                                      rate than before. Two members are still in favour of


                                                              5 (6)
The Swedish Economy

                              Monthly letter from Swedbank’s Economic Research Department, continued

                                                    No. 2 • 24 February 2011


leaving rates where they were with a lower repo rate                     Sweden's public finances continue to surprise on
path, arguing that unemployment remains high and                         the positive side. The budget surplus in January was
underlying inflation pressures are low. Mixed                            nearly SEK 30 billion, exceeding our forecasts. Tax
economic signals create uncertainty about the need                       revenues in particular are rising, but transfers to
for further increases in the repo rate. The global                       municipalities were also lower than expected. With
economy has begun to rebound, but considerable                           stronger finances but persistent problems in the
risks still remain, especially among more developed                      labour market, the government has to decide how to
economies. Underlying inflation (CPIF) surprisingly                      best address these problems. Underinvestment in
declined in January (which was not announced until                       physical and human capital is a medium-term
after the monetary decision), and it is likely that the                  challenge for Swedish economic policy.
stronger krona will limit imported inflation. At the
same time unemployment remains high, but with                            Even though structural reforms haven’t gotten much
incipient signs of a labour shortage in certain                          attention since last year’s election, the government
sectors, which could put pressure on wages.                              sold off part of Nordea in January, generating SEK
                                                                         19 billion. This is another step in reducing the state's
Inflation, exchange rate and benchmark rate, Jan 2005 – Feb              role in the economy, and further sales of state-
                            2011
                                                                         owned assets can be expected in the years ahead.
                     (Percentage change)
                                                                         As a direct consequence, government debt has
6.0                                                        160           continued to shrink and now is among the lowest in
                 CPIF (ann)
5.0
                 Repo rate                                               Europe.
                 TCW (rs)                                  150
4.0                                                                                                             Magnus Alvesson
                                                           140
3.0

2.0                                                        130

1.0
                                                           120
0.0
                                                           110
-1.0

-2.0                                                       100
  Jan-05 Jan-06 Jan-07 Jan-08 Jan-09 Jan-10 Jan-11
Source: Ecowin


Swedbank Economic Research Department              Swedbank’s monthly The Swedish Economy newsletter is published as a service
SE-105 34 Stockholm, Sweden                        to our customers. We believe that we have used reliable sources and methods in
Phone +46-8-5859 7740                              the preparation of the analyses reported in this publication. However, we cannot
ek.sekr@swedbank.se                                guarantee the accuracy or completeness of the report and cannot be held
www.swedbank.se                                    responsible for any error or omission in the underlying material or its use. Readers
Legally responsible publisher                      are encouraged to base any (investment) decisions on other material as well.
Cecilia Hermansson, +46-8-5859 7720                Neither Swedbank nor its employees may be held responsible for losses or
Magnus Alvesson, +46-8-5859 3341                   damages, direct or indirect, owing to any errors or omissions in Swedbank’s
Jörgen Kennemar, +46-8-5859 7730                   monthly The Swedish Economy newsletter.


                                                                 6 (6)

Contenu connexe

Plus de Swedbank

Swedbank corporate presentation April 25 2017
Swedbank corporate presentation April 25 2017Swedbank corporate presentation April 25 2017
Swedbank corporate presentation April 25 2017Swedbank
 
Swedbank foretagspresentation 25 april 2017
Swedbank foretagspresentation 25 april 2017Swedbank foretagspresentation 25 april 2017
Swedbank foretagspresentation 25 april 2017Swedbank
 
Delårsrapport kv1 2017
Delårsrapport kv1 2017Delårsrapport kv1 2017
Delårsrapport kv1 2017Swedbank
 
Interim report q1 2017
Interim report q1 2017Interim report q1 2017
Interim report q1 2017Swedbank
 
Year end report 2016
Year end report 2016Year end report 2016
Year end report 2016Swedbank
 
Bokslutskommuniké 2016
Bokslutskommuniké 2016Bokslutskommuniké 2016
Bokslutskommuniké 2016Swedbank
 
Swedbank företagspresentation, 2 februari 2017
Swedbank företagspresentation, 2 februari 2017Swedbank företagspresentation, 2 februari 2017
Swedbank företagspresentation, 2 februari 2017Swedbank
 
Swedbank corporate presentation, February 2 2017
Swedbank corporate presentation, February 2 2017Swedbank corporate presentation, February 2 2017
Swedbank corporate presentation, February 2 2017Swedbank
 
Swedbank Corporate Presentation, October 25 2016
Swedbank Corporate Presentation, October 25 2016Swedbank Corporate Presentation, October 25 2016
Swedbank Corporate Presentation, October 25 2016Swedbank
 
Swedbank företagspresentation, 25 oktober 2016
Swedbank företagspresentation, 25 oktober 2016Swedbank företagspresentation, 25 oktober 2016
Swedbank företagspresentation, 25 oktober 2016Swedbank
 
Swedbank Corporate Presentation, June 30 2016
Swedbank Corporate Presentation, June 30 2016Swedbank Corporate Presentation, June 30 2016
Swedbank Corporate Presentation, June 30 2016Swedbank
 
Swedbank företagspresentation, 30 juni 2016
Swedbank företagspresentation, 30 juni 2016Swedbank företagspresentation, 30 juni 2016
Swedbank företagspresentation, 30 juni 2016Swedbank
 
Swedbank corporate presentation Q1, 2016
Swedbank corporate presentation Q1, 2016Swedbank corporate presentation Q1, 2016
Swedbank corporate presentation Q1, 2016Swedbank
 
Swedbank företagspresentation kvartal 1, 2016.
Swedbank företagspresentation kvartal 1, 2016.Swedbank företagspresentation kvartal 1, 2016.
Swedbank företagspresentation kvartal 1, 2016.Swedbank
 
Swedbank corporate presentation Q4, 2015
Swedbank corporate presentation Q4, 2015Swedbank corporate presentation Q4, 2015
Swedbank corporate presentation Q4, 2015Swedbank
 
Swedbank företagspresentation kvartal 4,2015
Swedbank företagspresentation kvartal 4,2015Swedbank företagspresentation kvartal 4,2015
Swedbank företagspresentation kvartal 4,2015Swedbank
 
Year end report 2015
Year end report 2015Year end report 2015
Year end report 2015Swedbank
 
Bokslutskommuniké 2015
Bokslutskommuniké 2015Bokslutskommuniké 2015
Bokslutskommuniké 2015Swedbank
 
Swedbank Företagspresentation, September 2015
Swedbank Företagspresentation, September 2015Swedbank Företagspresentation, September 2015
Swedbank Företagspresentation, September 2015Swedbank
 
Swedbank Corporate Presentation, September 2015
Swedbank Corporate Presentation, September 2015Swedbank Corporate Presentation, September 2015
Swedbank Corporate Presentation, September 2015Swedbank
 

Plus de Swedbank (20)

Swedbank corporate presentation April 25 2017
Swedbank corporate presentation April 25 2017Swedbank corporate presentation April 25 2017
Swedbank corporate presentation April 25 2017
 
Swedbank foretagspresentation 25 april 2017
Swedbank foretagspresentation 25 april 2017Swedbank foretagspresentation 25 april 2017
Swedbank foretagspresentation 25 april 2017
 
Delårsrapport kv1 2017
Delårsrapport kv1 2017Delårsrapport kv1 2017
Delårsrapport kv1 2017
 
Interim report q1 2017
Interim report q1 2017Interim report q1 2017
Interim report q1 2017
 
Year end report 2016
Year end report 2016Year end report 2016
Year end report 2016
 
Bokslutskommuniké 2016
Bokslutskommuniké 2016Bokslutskommuniké 2016
Bokslutskommuniké 2016
 
Swedbank företagspresentation, 2 februari 2017
Swedbank företagspresentation, 2 februari 2017Swedbank företagspresentation, 2 februari 2017
Swedbank företagspresentation, 2 februari 2017
 
Swedbank corporate presentation, February 2 2017
Swedbank corporate presentation, February 2 2017Swedbank corporate presentation, February 2 2017
Swedbank corporate presentation, February 2 2017
 
Swedbank Corporate Presentation, October 25 2016
Swedbank Corporate Presentation, October 25 2016Swedbank Corporate Presentation, October 25 2016
Swedbank Corporate Presentation, October 25 2016
 
Swedbank företagspresentation, 25 oktober 2016
Swedbank företagspresentation, 25 oktober 2016Swedbank företagspresentation, 25 oktober 2016
Swedbank företagspresentation, 25 oktober 2016
 
Swedbank Corporate Presentation, June 30 2016
Swedbank Corporate Presentation, June 30 2016Swedbank Corporate Presentation, June 30 2016
Swedbank Corporate Presentation, June 30 2016
 
Swedbank företagspresentation, 30 juni 2016
Swedbank företagspresentation, 30 juni 2016Swedbank företagspresentation, 30 juni 2016
Swedbank företagspresentation, 30 juni 2016
 
Swedbank corporate presentation Q1, 2016
Swedbank corporate presentation Q1, 2016Swedbank corporate presentation Q1, 2016
Swedbank corporate presentation Q1, 2016
 
Swedbank företagspresentation kvartal 1, 2016.
Swedbank företagspresentation kvartal 1, 2016.Swedbank företagspresentation kvartal 1, 2016.
Swedbank företagspresentation kvartal 1, 2016.
 
Swedbank corporate presentation Q4, 2015
Swedbank corporate presentation Q4, 2015Swedbank corporate presentation Q4, 2015
Swedbank corporate presentation Q4, 2015
 
Swedbank företagspresentation kvartal 4,2015
Swedbank företagspresentation kvartal 4,2015Swedbank företagspresentation kvartal 4,2015
Swedbank företagspresentation kvartal 4,2015
 
Year end report 2015
Year end report 2015Year end report 2015
Year end report 2015
 
Bokslutskommuniké 2015
Bokslutskommuniké 2015Bokslutskommuniké 2015
Bokslutskommuniké 2015
 
Swedbank Företagspresentation, September 2015
Swedbank Företagspresentation, September 2015Swedbank Företagspresentation, September 2015
Swedbank Företagspresentation, September 2015
 
Swedbank Corporate Presentation, September 2015
Swedbank Corporate Presentation, September 2015Swedbank Corporate Presentation, September 2015
Swedbank Corporate Presentation, September 2015
 

Dernier

BPPG response - Options for Defined Benefit schemes - 19Apr24.pdf
BPPG response - Options for Defined Benefit schemes - 19Apr24.pdfBPPG response - Options for Defined Benefit schemes - 19Apr24.pdf
BPPG response - Options for Defined Benefit schemes - 19Apr24.pdfHenry Tapper
 
NO1 WorldWide Love marriage specialist baba ji Amil Baba Kala ilam powerful v...
NO1 WorldWide Love marriage specialist baba ji Amil Baba Kala ilam powerful v...NO1 WorldWide Love marriage specialist baba ji Amil Baba Kala ilam powerful v...
NO1 WorldWide Love marriage specialist baba ji Amil Baba Kala ilam powerful v...Amil baba
 
fca-bsps-decision-letter-redacted (1).pdf
fca-bsps-decision-letter-redacted (1).pdffca-bsps-decision-letter-redacted (1).pdf
fca-bsps-decision-letter-redacted (1).pdfHenry Tapper
 
Current Economic situation of Pakistan .pptx
Current Economic situation of Pakistan .pptxCurrent Economic situation of Pakistan .pptx
Current Economic situation of Pakistan .pptxuzma244191
 
NO1 WorldWide Genuine vashikaran specialist Vashikaran baba near Lahore Vashi...
NO1 WorldWide Genuine vashikaran specialist Vashikaran baba near Lahore Vashi...NO1 WorldWide Genuine vashikaran specialist Vashikaran baba near Lahore Vashi...
NO1 WorldWide Genuine vashikaran specialist Vashikaran baba near Lahore Vashi...Amil baba
 
Classical Theory of Macroeconomics by Adam Smith
Classical Theory of Macroeconomics by Adam SmithClassical Theory of Macroeconomics by Adam Smith
Classical Theory of Macroeconomics by Adam SmithAdamYassin2
 
《加拿大本地办假证-寻找办理Dalhousie毕业证和达尔豪斯大学毕业证书的中介代理》
《加拿大本地办假证-寻找办理Dalhousie毕业证和达尔豪斯大学毕业证书的中介代理》《加拿大本地办假证-寻找办理Dalhousie毕业证和达尔豪斯大学毕业证书的中介代理》
《加拿大本地办假证-寻找办理Dalhousie毕业证和达尔豪斯大学毕业证书的中介代理》rnrncn29
 
(中央兰开夏大学毕业证学位证成绩单-案例)
(中央兰开夏大学毕业证学位证成绩单-案例)(中央兰开夏大学毕业证学位证成绩单-案例)
(中央兰开夏大学毕业证学位证成绩单-案例)twfkn8xj
 
(办理原版一样)QUT毕业证昆士兰科技大学毕业证学位证留信学历认证成绩单补办
(办理原版一样)QUT毕业证昆士兰科技大学毕业证学位证留信学历认证成绩单补办(办理原版一样)QUT毕业证昆士兰科技大学毕业证学位证留信学历认证成绩单补办
(办理原版一样)QUT毕业证昆士兰科技大学毕业证学位证留信学历认证成绩单补办fqiuho152
 
Financial Leverage Definition, Advantages, and Disadvantages
Financial Leverage Definition, Advantages, and DisadvantagesFinancial Leverage Definition, Advantages, and Disadvantages
Financial Leverage Definition, Advantages, and Disadvantagesjayjaymabutot13
 
Governor Olli Rehn: Dialling back monetary restraint
Governor Olli Rehn: Dialling back monetary restraintGovernor Olli Rehn: Dialling back monetary restraint
Governor Olli Rehn: Dialling back monetary restraintSuomen Pankki
 
House of Commons ; CDC schemes overview document
House of Commons ; CDC schemes overview documentHouse of Commons ; CDC schemes overview document
House of Commons ; CDC schemes overview documentHenry Tapper
 
Stock Market Brief Deck for "this does not happen often".pdf
Stock Market Brief Deck for "this does not happen often".pdfStock Market Brief Deck for "this does not happen often".pdf
Stock Market Brief Deck for "this does not happen often".pdfMichael Silva
 
Economics, Commerce and Trade Management: An International Journal (ECTIJ)
Economics, Commerce and Trade Management: An International Journal (ECTIJ)Economics, Commerce and Trade Management: An International Journal (ECTIJ)
Economics, Commerce and Trade Management: An International Journal (ECTIJ)ECTIJ
 
How Automation is Driving Efficiency Through the Last Mile of Reporting
How Automation is Driving Efficiency Through the Last Mile of ReportingHow Automation is Driving Efficiency Through the Last Mile of Reporting
How Automation is Driving Efficiency Through the Last Mile of ReportingAggregage
 
(办理学位证)加拿大萨省大学毕业证成绩单原版一比一
(办理学位证)加拿大萨省大学毕业证成绩单原版一比一(办理学位证)加拿大萨省大学毕业证成绩单原版一比一
(办理学位证)加拿大萨省大学毕业证成绩单原版一比一S SDS
 
Bladex Earnings Call Presentation 1Q2024
Bladex Earnings Call Presentation 1Q2024Bladex Earnings Call Presentation 1Q2024
Bladex Earnings Call Presentation 1Q2024Bladex
 
The Triple Threat | Article on Global Resession | Harsh Kumar
The Triple Threat | Article on Global Resession | Harsh KumarThe Triple Threat | Article on Global Resession | Harsh Kumar
The Triple Threat | Article on Global Resession | Harsh KumarHarsh Kumar
 
magnetic-pensions-a-new-blueprint-for-the-dc-landscape.pdf
magnetic-pensions-a-new-blueprint-for-the-dc-landscape.pdfmagnetic-pensions-a-new-blueprint-for-the-dc-landscape.pdf
magnetic-pensions-a-new-blueprint-for-the-dc-landscape.pdfHenry Tapper
 
NO1 Certified Ilam kala Jadu Specialist Expert In Bahawalpur, Sargodha, Sialk...
NO1 Certified Ilam kala Jadu Specialist Expert In Bahawalpur, Sargodha, Sialk...NO1 Certified Ilam kala Jadu Specialist Expert In Bahawalpur, Sargodha, Sialk...
NO1 Certified Ilam kala Jadu Specialist Expert In Bahawalpur, Sargodha, Sialk...Amil Baba Dawood bangali
 

Dernier (20)

BPPG response - Options for Defined Benefit schemes - 19Apr24.pdf
BPPG response - Options for Defined Benefit schemes - 19Apr24.pdfBPPG response - Options for Defined Benefit schemes - 19Apr24.pdf
BPPG response - Options for Defined Benefit schemes - 19Apr24.pdf
 
NO1 WorldWide Love marriage specialist baba ji Amil Baba Kala ilam powerful v...
NO1 WorldWide Love marriage specialist baba ji Amil Baba Kala ilam powerful v...NO1 WorldWide Love marriage specialist baba ji Amil Baba Kala ilam powerful v...
NO1 WorldWide Love marriage specialist baba ji Amil Baba Kala ilam powerful v...
 
fca-bsps-decision-letter-redacted (1).pdf
fca-bsps-decision-letter-redacted (1).pdffca-bsps-decision-letter-redacted (1).pdf
fca-bsps-decision-letter-redacted (1).pdf
 
Current Economic situation of Pakistan .pptx
Current Economic situation of Pakistan .pptxCurrent Economic situation of Pakistan .pptx
Current Economic situation of Pakistan .pptx
 
NO1 WorldWide Genuine vashikaran specialist Vashikaran baba near Lahore Vashi...
NO1 WorldWide Genuine vashikaran specialist Vashikaran baba near Lahore Vashi...NO1 WorldWide Genuine vashikaran specialist Vashikaran baba near Lahore Vashi...
NO1 WorldWide Genuine vashikaran specialist Vashikaran baba near Lahore Vashi...
 
Classical Theory of Macroeconomics by Adam Smith
Classical Theory of Macroeconomics by Adam SmithClassical Theory of Macroeconomics by Adam Smith
Classical Theory of Macroeconomics by Adam Smith
 
《加拿大本地办假证-寻找办理Dalhousie毕业证和达尔豪斯大学毕业证书的中介代理》
《加拿大本地办假证-寻找办理Dalhousie毕业证和达尔豪斯大学毕业证书的中介代理》《加拿大本地办假证-寻找办理Dalhousie毕业证和达尔豪斯大学毕业证书的中介代理》
《加拿大本地办假证-寻找办理Dalhousie毕业证和达尔豪斯大学毕业证书的中介代理》
 
(中央兰开夏大学毕业证学位证成绩单-案例)
(中央兰开夏大学毕业证学位证成绩单-案例)(中央兰开夏大学毕业证学位证成绩单-案例)
(中央兰开夏大学毕业证学位证成绩单-案例)
 
(办理原版一样)QUT毕业证昆士兰科技大学毕业证学位证留信学历认证成绩单补办
(办理原版一样)QUT毕业证昆士兰科技大学毕业证学位证留信学历认证成绩单补办(办理原版一样)QUT毕业证昆士兰科技大学毕业证学位证留信学历认证成绩单补办
(办理原版一样)QUT毕业证昆士兰科技大学毕业证学位证留信学历认证成绩单补办
 
Financial Leverage Definition, Advantages, and Disadvantages
Financial Leverage Definition, Advantages, and DisadvantagesFinancial Leverage Definition, Advantages, and Disadvantages
Financial Leverage Definition, Advantages, and Disadvantages
 
Governor Olli Rehn: Dialling back monetary restraint
Governor Olli Rehn: Dialling back monetary restraintGovernor Olli Rehn: Dialling back monetary restraint
Governor Olli Rehn: Dialling back monetary restraint
 
House of Commons ; CDC schemes overview document
House of Commons ; CDC schemes overview documentHouse of Commons ; CDC schemes overview document
House of Commons ; CDC schemes overview document
 
Stock Market Brief Deck for "this does not happen often".pdf
Stock Market Brief Deck for "this does not happen often".pdfStock Market Brief Deck for "this does not happen often".pdf
Stock Market Brief Deck for "this does not happen often".pdf
 
Economics, Commerce and Trade Management: An International Journal (ECTIJ)
Economics, Commerce and Trade Management: An International Journal (ECTIJ)Economics, Commerce and Trade Management: An International Journal (ECTIJ)
Economics, Commerce and Trade Management: An International Journal (ECTIJ)
 
How Automation is Driving Efficiency Through the Last Mile of Reporting
How Automation is Driving Efficiency Through the Last Mile of ReportingHow Automation is Driving Efficiency Through the Last Mile of Reporting
How Automation is Driving Efficiency Through the Last Mile of Reporting
 
(办理学位证)加拿大萨省大学毕业证成绩单原版一比一
(办理学位证)加拿大萨省大学毕业证成绩单原版一比一(办理学位证)加拿大萨省大学毕业证成绩单原版一比一
(办理学位证)加拿大萨省大学毕业证成绩单原版一比一
 
Bladex Earnings Call Presentation 1Q2024
Bladex Earnings Call Presentation 1Q2024Bladex Earnings Call Presentation 1Q2024
Bladex Earnings Call Presentation 1Q2024
 
The Triple Threat | Article on Global Resession | Harsh Kumar
The Triple Threat | Article on Global Resession | Harsh KumarThe Triple Threat | Article on Global Resession | Harsh Kumar
The Triple Threat | Article on Global Resession | Harsh Kumar
 
magnetic-pensions-a-new-blueprint-for-the-dc-landscape.pdf
magnetic-pensions-a-new-blueprint-for-the-dc-landscape.pdfmagnetic-pensions-a-new-blueprint-for-the-dc-landscape.pdf
magnetic-pensions-a-new-blueprint-for-the-dc-landscape.pdf
 
NO1 Certified Ilam kala Jadu Specialist Expert In Bahawalpur, Sargodha, Sialk...
NO1 Certified Ilam kala Jadu Specialist Expert In Bahawalpur, Sargodha, Sialk...NO1 Certified Ilam kala Jadu Specialist Expert In Bahawalpur, Sargodha, Sialk...
NO1 Certified Ilam kala Jadu Specialist Expert In Bahawalpur, Sargodha, Sialk...
 

The Swedish Economy, No. 2, 24 February 2011

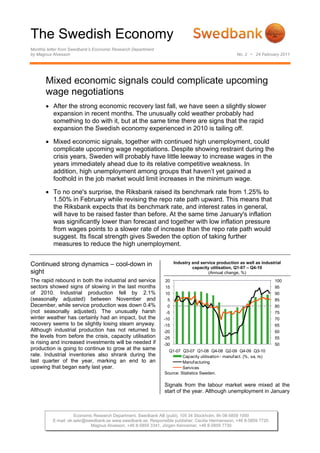
  • 1. The Swedish Economy Monthly letter from Swedbank’s Economic Research Department by Magnus Alvesson No. 2 • 24 February 2011 Mixed economic signals could complicate upcoming wage negotiations • After the strong economic recovery last fall, we have seen a slightly slower expansion in recent months. The unusually cold weather probably had something to do with it, but at the same time there are signs that the rapid expansion the Swedish economy experienced in 2010 is tailing off. • Mixed economic signals, together with continued high unemployment, could complicate upcoming wage negotiations. Despite showing restraint during the crisis years, Sweden will probably have little leeway to increase wages in the years immediately ahead due to its relative competitive weakness. In addition, high unemployment among groups that haven’t yet gained a foothold in the job market would limit increases in the minimum wage. • To no one's surprise, the Riksbank raised its benchmark rate from 1.25% to 1.50% in February while revising the repo rate path upward. This means that the Riksbank expects that its benchmark rate, and interest rates in general, will have to be raised faster than before. At the same time January's inflation was significantly lower than forecast and together with low inflation pressure from wages points to a slower rate of increase than the repo rate path would suggest. Its fiscal strength gives Sweden the option of taking further measures to reduce the high unemployment. Continued strong dynamics – cool-down in Industry and service production as well as industrial capacity utilisation, Q1-07 – Q4-10 sight (Annual change, %) The rapid rebound in both the industrial and service 20 100 sectors showed signs of slowing in the last months 15 95 of 2010. Industrial production fell by 2.1% 10 90 (seasonally adjusted) between November and 5 85 December, while service production was down 0.4% 0 80 (not seasonally adjusted). The unusually harsh -5 75 winter weather has certainly had an impact, but the -10 70 recovery seems to be slightly losing steam anyway. -15 65 Although industrial production has not returned to -20 60 the levels from before the crisis, capacity utilisation -25 55 is rising and increased investments will be needed if -30 50 production is going to continue to grow at the same Q1-07 Q3-07 Q1-08 Q4-08 Q2-09 Q4-09 Q3-10 rate. Industrial inventories also shrank during the Capacity utilisation - manuf act. (%, sa, rs) last quarter of the year, marking an end to an Manuf acturing upswing that began early last year. Services Source: Statistics Sweden. Signals from the labour market were mixed at the start of the year. Although unemployment in January Economic Research Department, Swedbank AB (publ), 105 34 Stockholm, tfn 08-5859 1000 E-mail: ek.sekr@swedbank.se www.swedbank.se. Responsible publisher: Cecilia Hermansson, +46 8-5859 7720. Magnus Alvesson, +46 8-5859 3341, Jörgen Kennemar, +46 8-5859 7730
  • 2. The Swedish Economy Monthly letter from Swedbank’s Economic Research Department, continued No. 2 • 24 February 2011 rose to 8.2% (7.9% seasonally adjusted), the The Swedish economic recovery was exceptionally employment rate was up by 3% compared with the strong during the first three quarters of 2010. On same period of 2010. The reason was a significant average, GDP grew by nearly 2% per quarter, increase in the labour supply. This could be nearly twice as much as other developed because an improved job market gives hope to economies. As mentioned in our January forecast, people who had given up looking for a job and we expect that quarterly growth slowed during the brings them back into the ranks of the unemployed. last quarter, but that the rapid expansion in the Another reason may be that many people saw their Swedish economy prevailed. On an annual basis, unemployment insurance run out and had to start we predict a growth rate of slightly over 7%. In many looking for work again. other comparable economies, growth slowed at the end of last year. This was certainly due to some Labour market trends, Jan 2006 – Jan 2011 extent to the cold winter weather. It is likely that we (’000s, seasonally adjusted) will see a similar pattern for the Swedish economy. 5100 10.0 5000 9.0 GDP growth 2010 8.0 (Quarterly growth, %, seasonally adjusted) 4900 3.0 7.0 4800 6.0 2.5 1.9 ave 2010 4700 5.0 2.0 4600 4.0 3.0 1.5 1.0 4500 0.7 0.6 0.4 Employment 2.0 1.1 1.0 0.5 0.7 4400 Labor supply 1.0 1.0 0.4 Unemployment rate (%, sa, rs) 4300 0.0 0.5 Jan-05 Jan-06 Jan-07 Jan-08 Jan-09 Jan-10 Jan-11 0.0 Source: Statistics Sweden (LFS). -0.5 January inflation is hard to interpret. Consumer prices fell by 0.5% compared with December 2010 at the same time that the annual rate continued to rise, to 2.5%, against 2.3% in the previous month. Source: Ecowin. Underlying inflation (CPIF, i.e., adjusted for interest rate effects) fell to an annualised rate of 1.4%, Wage negotiations and Swedish compared with 2.3% in December. This is partly competitiveness because certain product groups declined in price, e.g., clothing, air travel and, somewhat surprisingly, During collective bargaining negotiations in the crisis food. At the same time revisions to food basket years of 2009 and 2010, wage growth slowed. This weights also caused changes in interest rates to helped to contain unemployment and make Swedish have a big impact on CPI in January. businesses more competitive. A weaker Swedish krona compared with key trade partners was also a Inflation rate, Jan 2005 – Jan 2011 factor.1 As the economy has rebounded, so have (Percentage change) expectations that upcoming wage negotiations 5 should compensate for the previous restraint. This 4 would help household finances when interest expenses and prices rise, ensuring a decent rate of 3 increase in private consumption. At the same time 2 steep wage increases would weaken companies’ 1 competitiveness and slow job growth. 0 -1 -2 CPI (m-o-m) CPI (Ann) CPIF (Ann) -3 Jan-05 Feb-06 Mar-07 Apr-08 May-09 Jun-10 Source: Statistics Sweden. 1 Germany, Norway, Denmark, Netherlands and the UK are Sweden's largest export markets. 2 (6)
  • 3. The Swedish Economy Monthly letter from Swedbank’s Economic Research Department, continued No. 2 • 24 February 2011 Rate of wage growth, entire economy, Jan 1992 – Nov 2010 Thanks to lower consumer prices, coupled with the (Annual change, %) high-priced wage agreements that still remain in 8.0 effect, real wage growth has been strong in recent Wage drif t Wage increase Agreement years. As a result, household finances have 7.0 improved despite rising unemployment. Combined 6.0 with tax cuts during the period, real disposable income has increased, thanks to which strong 5.0 consumer spending was able to mitigate the 4.0 economic downturn in 2008 and 2009. Higher inflation in 2010, initially due to the weaker krona, 3.0 which led to higher import prices and later to higher 2.0 global commodity prices, has now impacted the real value of previously agreed wage increases. As a 1.0 result, more wage earners are seeing shrinking real wages, which could hurt consumer spending and 0.0 lead to higher wage demands in future collective Jan-92 Jul-94 Jan-97 Jul-99 Jan-02 Jul-04 Jan-07 Jul-09 bargaining negotiations. Source: National Mediation Office. Rate of wage growth, entire economy, Jan 2005 – Nov 2010 (Annual change, %) The agreements signed in 2007, which in many 6.0 cases stretch until 2010, were influenced by the Nominal wages strong economic growth at the time, which also led 5.0 Inf lation (CPI) to relatively high contractual wage increases during Real wages the financial crisis. In 2008 and 2009 contractual 4.0 wages rose by an average of 3.2% and 2.8%, 3.0 respectively.2 Wage drift fell to less than a half percentage point from nearly 2 percentage points in 2.0 the 2000’s. This is due to rising unemployment and 1.0 less competition for employees, but also because employees have had less opportunity to change 0.0 jobs. In good times this pushes total wages higher. With less wage drift, the actual average wage -1.0 increase was about 4.3% in 2008 and about 3.4% in -2.0 2009. Jan-05 Nov-05 Sep-06 Jul-07 May-08 Mar-09 Jan-10 Nov-10 In 2010 new agreements were signed for around 3.3 Source: Statistics Sweden and National Mediation Office. million employees. The economic crisis kept wage increases relatively low, particularly compared with A large share of the agreements signed in 2009 and the two previous years, but also compared with the 2010 were short in length and expire in 2011 and entire period since the 1990’s crisis. Contractual early 2012. Facing economic uncertainty, unions wage increases ended up at nearly 2% per year with were interested in retaining the option to revise little variation between industrial and service wages if the economy rebounded. It is estimated sectors. Wages for workers generally increased at a that agreements for around 400 000 workers will be slightly higher rate in the agreements, 3.5% over 24 up for renegotiation in 2011, including salaried months, while white-collar wages rose by 2.5% industrial employees (whose agreement expires on during the same period. Through November 2010 September 30). Negotiations for industrial workers the average was 2.4% at an annual rate, which will also begin in 2011 (their agreement expires on includes wage drift and the remaining effects of 31 January 2012). These comprehensive earlier agreements. However, the rate of increase agreements traditionally set the norm for the rest of had fallen from 3.5% at the beginning of the year to the market, so some coordination will be expected 2.0% in November. between these groups. The negotiations for salaried industrial employees beginning this spring will be 2 The wage figures referred to here, which are based on important to negotiations in both 2011 and 2012. data from the National Mediation Office, increased considerably faster than comparable figures based on In 2012 agreements await for a total of 2.4 million national accounts. This may be largely because the latter workers, including a half-million retail workers do not include bonuses or take into account the shorter (whose agreement expires on 31 March 2012) and work hours agreed to in 2009. 3 (6)
  • 4. The Swedish Economy Monthly letter from Swedbank’s Economic Research Department, continued No. 2 • 24 February 2011 over one million municipal workers (whose about 23% of Sweden's goods exports (Germany agreement expires on April 30). Economic accounts for about 10%). development in coming months, and how it is 1/ interpreted, will therefore have a major impact on Hourly labour costs in industry, 2005 – 2010 (Annual change, %) wages in Sweden and as a result, on the country's 9 competitiveness and unemployment levels. Germany Netherlands Finland 8 Denmark UK Norway Wage level according to agreements and renegotiations, 2010 - 2012 7 Sweden (Index March 2010=100) 6 106 5 1000 4 104 3 2 102 1 500 0 100 -1 2005 2006 2007 2008 2009 2010 98 0 Source: National Mediation Office. mar-10 sep-10 mar-11 sep-11 mar-12 1/ First three quarters of 2010. Agreement ends ('000 empl., rs) Industry - salaried Industry - workers Construction Transport Retail A rapid increase in hourly wages could be offset if Local government productivity rises faster than in competing countries. Sources: National Institute of Economic Research and National Mediation Office. Swedish productivity climbed quickly after the financial crisis in the early 1990s, gaining over 7% When wage negotiations now begin, one of the main annually in 1994-1998, nearly twice the EU and topics will be the competitiveness of the Swedish OECD averages. The rate was slightly lower, at economy relative to key export markets. 6.8%, until 2003, before falling to about 2.5% in Competitiveness is partly determined by wages, but 2004-2009, again affected by an economic crisis. also by productivity compared with other countries. After the major economic fluctuations caused by the Exchange rates also have a big impact on the prices current crisis, Swedish productivity can’t be of Swedish goods and services abroad, and on expected to grow by more than 2-3% per year under import competition in Swedish markets. Wages more normal conditions. This leaves even less room affect other aspects of the economy as well. In for wage increases than in the early 2000’s. addition to household budgets, which are the Productivity in manufacturing industry, 2005 – 2009 determining factor for consumer spending, wages (Annual change, %) are critical to unemployment. For many people 15.0 Germany Netherlands Finland currently outside the job market, minimum wages Denmark UK Norway are especially important. Sweden 10.0 There are a number of measures of industrial wages, but many aren’t totally comparable between countries. Any such comparisons therefore have to 5.0 be viewed cautiously. One of the most common indicators is the hourly labour cost. In Sweden, it fell 0.0 during the first three quarters of 2010 and rose by only 1.9% on an annual basis, compared with an -5.0 average of nearly 3% in 2005-2009 and slightly over 4% in 2000-2004. In Germany, hourly wages have increased even slower, especially during the first -10.0 half of the 2000’s (2.5%). Compared with other 2005 2006 2007 2008 2009 competing countries, Sweden has seen lower wage Source: National Mediation Office. increases, particularly relative to neighbours such as Norway, Denmark and Finland, which account for Unit labour costs – a combination of productivity and labour costs – indicate that Sweden was slightly less 4 (6)
  • 5. The Swedish Economy Monthly letter from Swedbank’s Economic Research Department, continued No. 2 • 24 February 2011 competitive, based on domestic factors, than most Real effective exchange rates, Jan 1994 – Jun 2010 (Nominal exchange rates deflated by the unit labour cost) of its main trading partners. Rapid growth was led by rising labour costs, but this trend was broken in Norway Finland 2009 when Swedish costs fell as wages dropped 135 Germany Netherlands more than in key export markets at the same time Sweden UK that productivity stopped declining. The exception is 125 Germany, where unit labour costs have increased even more slowly since the mid-2000’s, putting it in 115 a strong position as the global economy recovers. 105 Unit labour cost 2000 – 2010 (Index 2005=100, trend) 95 120 85 Index 1999=100 115 75 110 Jan-94 Oct-96 Jul-99 Apr-02 Jan-05 Oct-07 105 Source: EU Commission. 100 Wage negotiations will also have a direct effect on 95 job creation and unemployment. The low wage increases and layoffs during the crisis years helped 90 Denmark Finland to keep unemployment in check. Sweden’s relatively Germany Netherlands high minimum wages limit job opportunities for those 85 Sweden UK United States most in need, however. The people finding it hardest 80 to gain a foothold in the job market are often young Q1-00 Q3-01 Q1-03 Q3-04 Q1-06 Q3-07 Q1-09 Q3-10 or long-term unemployed. It would be easier for Source: OECD. them to get work if starting salaries were relatively low. The weakening of the krona made Sweden more In summary, there is a risk that collective bargaining competitive during the economic crisis, but this has negotiations could be difficult and protracted. changed since the currency again increased in Economic conditions are uncertain at the same time value last fall. Currency fluctuations clearly have an that wage earners have had to make large impact on the economy's cost structure and, as a concessions to keep Swedish businesses result, its competitive strength. Since the mid-1990s competitive and limit the impact of the global real exchange rates have trended lower, giving financial crisis. Jobs have increased for several Sweden a competitive boost relative to its key months, which is evident by the labour shortage in export markets. This has reinforced the effects of its certain sectors. This could mean higher wages, lower unit labour costs. Given the stability of the increasing the pressure on the negotiating parties. economy, especially in fiscal terms thanks to budget On the other hand, overall unemployment remains surpluses and shrinking government debt, there is a high, which would favour restraint with regard to chance that the krona will continue to rise in value. minimum wages. Productivity growth is likely to level This puts an additional limit on how much wages off after the rapid rebound at the same time that the can increase without hurting Swedish businesses. krona will continue to rise slightly. Given the strong job recovery, however, the risks in the wage forecast in our economic report in January may have been on the upside. The economic turnaround is a challenge for economic policy As expected, the Riksbank raised the repo rate at its most recent monetary meeting from 1.25% to 1.50% at the same time that the repo rate path was increased. The assumption is that monetary policy will continue to normalise, though at a slightly higher rate than before. Two members are still in favour of 5 (6)
  • 6. The Swedish Economy Monthly letter from Swedbank’s Economic Research Department, continued No. 2 • 24 February 2011 leaving rates where they were with a lower repo rate Sweden's public finances continue to surprise on path, arguing that unemployment remains high and the positive side. The budget surplus in January was underlying inflation pressures are low. Mixed nearly SEK 30 billion, exceeding our forecasts. Tax economic signals create uncertainty about the need revenues in particular are rising, but transfers to for further increases in the repo rate. The global municipalities were also lower than expected. With economy has begun to rebound, but considerable stronger finances but persistent problems in the risks still remain, especially among more developed labour market, the government has to decide how to economies. Underlying inflation (CPIF) surprisingly best address these problems. Underinvestment in declined in January (which was not announced until physical and human capital is a medium-term after the monetary decision), and it is likely that the challenge for Swedish economic policy. stronger krona will limit imported inflation. At the same time unemployment remains high, but with Even though structural reforms haven’t gotten much incipient signs of a labour shortage in certain attention since last year’s election, the government sectors, which could put pressure on wages. sold off part of Nordea in January, generating SEK 19 billion. This is another step in reducing the state's Inflation, exchange rate and benchmark rate, Jan 2005 – Feb role in the economy, and further sales of state- 2011 owned assets can be expected in the years ahead. (Percentage change) As a direct consequence, government debt has 6.0 160 continued to shrink and now is among the lowest in CPIF (ann) 5.0 Repo rate Europe. TCW (rs) 150 4.0 Magnus Alvesson 140 3.0 2.0 130 1.0 120 0.0 110 -1.0 -2.0 100 Jan-05 Jan-06 Jan-07 Jan-08 Jan-09 Jan-10 Jan-11 Source: Ecowin Swedbank Economic Research Department Swedbank’s monthly The Swedish Economy newsletter is published as a service SE-105 34 Stockholm, Sweden to our customers. We believe that we have used reliable sources and methods in Phone +46-8-5859 7740 the preparation of the analyses reported in this publication. However, we cannot ek.sekr@swedbank.se guarantee the accuracy or completeness of the report and cannot be held www.swedbank.se responsible for any error or omission in the underlying material or its use. Readers Legally responsible publisher are encouraged to base any (investment) decisions on other material as well. Cecilia Hermansson, +46-8-5859 7720 Neither Swedbank nor its employees may be held responsible for losses or Magnus Alvesson, +46-8-5859 3341 damages, direct or indirect, owing to any errors or omissions in Swedbank’s Jörgen Kennemar, +46-8-5859 7730 monthly The Swedish Economy newsletter. 6 (6)