Energy & Commodities, No. 7 - August 27, 2012
•
0 j'aime•331 vues

Energy & Commodities, No. 7 - August 27, 2012: Supply restrictions and geopolitical uncertainty lift commodity prices

Recommandé
Recommandé
Contenu connexe
Tendances
Tendances (20)
En vedette
En vedette (18)
Similaire à Energy & Commodities, No. 7 - August 27, 2012
Similaire à Energy & Commodities, No. 7 - August 27, 2012 (20)
Plus de Swedbank
Plus de Swedbank (20)
Dernier
Dernier (20)
Energy & Commodities, No. 7 - August 27, 2012
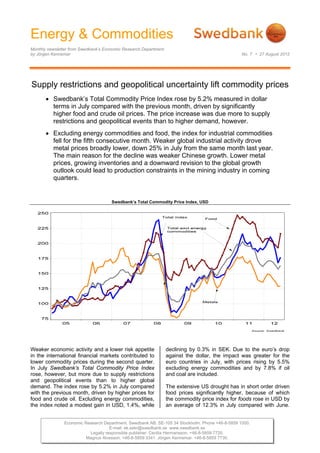
- 1. Energy & Commodities Monthly newsletter from Swedbank’s Economic Research Department by Jörgen Kennemar No. 7 • 27 August 2012 Supply restrictions and geopolitical uncertainty lift commodity prices Swedbank’s Total Commodity Price Index rose by 5.2% measured in dollar terms in July compared with the previous month, driven by significantly higher food and crude oil prices. The price increase was due more to supply restrictions and geopolitical events than to higher demand, however. Excluding energy commodities and food, the index for industrial commodities fell for the fifth consecutive month. Weaker global industrial activity drove metal prices broadly lower, down 25% in July from the same month last year. The main reason for the decline was weaker Chinese growth. Lower metal prices, growing inventories and a downward revision to the global growth outlook could lead to production constraints in the mining industry in coming quarters. Swedbank’s Total Commodity Price Index, USD Weaker economic activity and a lower risk appetite declining by 0.3% in SEK. Due to the euro’s drop in the international financial markets contributed to against the dollar, the impact was greater for the lower commodity prices during the second quarter. euro countries in July, with prices rising by 5.5% In July Swedbank’s Total Commodity Price Index excluding energy commodities and by 7.8% if oil rose, however, but more due to supply restrictions and coal are included. and geopolitical events than to higher global demand. The index rose by 5.2% in July compared The extensive US drought has in short order driven with the previous month, driven by higher prices for food prices significantly higher, because of which food and crude oil. Excluding energy commodities, the commodity price index for foods rose in USD by the index noted a modest gain in USD, 1.4%, while an average of 12.3% in July compared with June. Economic Research Department. Swedbank AB. SE-105 34 Stockholm. Phone +46-8-5859 1000. E-mail: ek.sekr@swedbank.se www.swedbank.se Legally responsible publisher: Cecilia Hermansson. +46-8-5859 7720. Magnus Alvesson. +46-8-5859 3341. Jörgen Kennemar. +46-8-5859 7730.
- 2. Energy & Commodities Monthly newsletter from Swedbank’s Economic Research Department, continued No. 7 • 27 August 2012 The increase broke a downward price trend in The risk of a renewed food crisis like the one in 2012. Lower anticipated production over the course 2007/08 can’t be overlooked, but can be avoided if of the year and fears of limited global food trade the export embargo and other trade restrictions tend to drive up prices. The US Department of from four years ago aren't repeated. Rising global Agriculture’s (USDA) downward revision of food food prices are especially burdensome for production in the US reinforces this trend. With economies where food accounts for a large share of production expected to be lower at the same time household spending. global demand is growing, grain inventories will shrink this fall after having built up during the last The price trend for agricultural commodities such as two years on the heels of record-high harvests. pulp and lumber fell for the second consecutive month by a total of 5% in dollar terms. For Swedish producers, prices had a bigger impact because of The world’s largest corn exporters in 2011, millions of tons the stronger krona. Measured in SEK, pulp prices are at their lowest level since this January at slightly 0 10 20 30 40 over SEK 5 500 per ton, compared with just over US SEK 7 500 in June 2010, when pulp reached its latest peak. The decline for cotton continued in July Argentina and in dollar terms it reached the lowest price level Ukraine in nearly two years. Brazil India EU‐27 Pulp price per ton in SEK and USD Russia Serbia South Africa The biggest gains have been in grain prices (barley, corn and wheat), although soy beans and oilseeds have also risen sharply this summer and are now at record levels. Increased competition between ethanol and food production is another reason why grain prices have pushed higher. Since a large share of corn and rapeseed in the US and Europe is used in ethanol production (about 40% and 60%, respectively), calls to reduce ethanol production are likely to grow. More expensive grain also means higher feed prices, which usually leads to higher meat prices as well. Weak industrial activity pressuring We expect the high food prices to persist during the industrial metals second half-year. The average price level for the Economically sensitive industrial commodities (base full-year 2012 is expected to be 4-5% lower than metals and agricultural products) continue to trend last year, however, due to the earlier decline late lower, as they have since last spring, driven by last year and at the start of 2012. The incentives for deteriorating global conditions. The global higher global production next year should be good manufacturing PMI fell in July to 48.4, the lowest considering the high food prices and increase in level since June 2009. Weaker economic activity in arable land in recent years. At the same time the China, which accounts for most of the global major price fluctuations in recent years have increase in metal consumption, clearly impacted underscored the vulnerability of the global food prices. This has led to growing surpluses, especially supply in the face of major production disruptions. for zinc and nickel. Although the commodity price While we are predicting gradually lower prices next index for non-ferrous metals rose slightly in dollar year, the average price level for food commodities terms between June and July (0.2%), metal prices will be 5-6% higher in 2013. are nearly 25% lower than a year earlier. Nickel and lead have fallen the most in price in the last twelve months (30%), although copper has also dropped
- 3. Energy & Commodities Monthly newsletter from Swedbank’s Economic Research Department, continued No. 7 • 27 August 2012 significantly despite that supply conditions remain Geopolitical concerns lift oil prices tight. Crude oil prices rose substantially in dollar terms in July, up slightly over 12% on average after having Underlying metal demand is expected to remain low fallen nearly 30% between March and June (from in the year ahead due to slower investment activity USD 126 to just under USD 90). Increased and uncertainty about the impact of the euro crisis geopolitical concerns in the Middle East are on the global economy We expect prices for non- probably the main reason why prices are rising ferrous metals as a group to fall by an average of again. This applies especially to Iran's renewed 15% in 2012 measured in dollar terms before threats to shut down the Strait of Hormuz since the turning slightly higher next year when production EU’s oil embargo on Iranian oil was introduced on cutbacks are predicted in the mining industry, which July 1. An increased US military presence in the should gradually push prices higher. The Australian region and the deteriorating situation in Syria are mining giant BHP Billiton, for example, has also driving crude prices upward. signalled lower capital expenditure going forward. Brent-WTI crude price differential Chinese steel production and price trend for industrial metals 150 50 100 Crude oil, Brent Prices on non- 125 ferrous metals, %-annual rate, 40 right scale 75 100 30 50 75 20 25 %-change %-change 50 10 0 Price differens in USD , Brent minus WTI-oil 25 0 -25 0 Chines steel production, %-annual rate, left scale -10 -50 -25 05 06 07 08 09 10 11 12 -20 -75 Source: Reuters EcoWin 00 01 02 03 04 05 06 07 08 09 10 11 12 Source: Reuters EcoWin Fears about future supplies from the Middle East Weaker investment and lower steel production have again raised the risk premium on Brent crude. growth have led to a substantial price decline for The differential between US crude (WTI) and iron ore. In July prices fell by 3.6% in dollar terms European Brent crude has risen to just over USD from the previous month, which means that the 20 in August after having been as low as USD 9-10 price level is now is more than 20% lower than a in mid-June. The biggest reason for the lower price year ago. In SEK the monthly decline was even of WTI crude is increased supply. In the US and higher, 5.3%. A major reason for the price decline Canada, oil production has risen substantially in for ore is declining steel production in China and recent years in connection with new investments expectations that economic stimulus will contribute and oil extraction from oil sands. At the same time less to GDP growth in the year ahead. Even if consumption in North America has been weak. infrastructure investments are pushed forward, the Production disruptions in the North Sea during the impact on metal prices is likely to be fairly limited, summer months and geopolitical uncertainty in the since the announced investments are relatively Middle East have clearly impacted Brent crude small and aren't expected to have the same impact prices. Higher Asian oil demand, most of which on growth as in 2008/09, when a huge investment goes through the OPEC countries, also tends to program was implemented. lead to higher Brent prices compared with US crude. 3 (6)
- 4. Energy & Commodities Monthly newsletter from Swedbank’s Economic Research Department, continued No. 7 • 27 August 2012 This year we are forecasting an average oil price of global economy and in the longer term should lead USD 110 a barrel, falling to USD 104 in 2013. to lower demand. Weaker economic conditions in the OECD countries and emerging markets, which account for large part The biggest forecast risk is what happens politically of the increase in global oil consumption, suggest a in the Middle East, which could lead to major lower price than today's USD 116 a barrel for Brent fluctuations in oil prices upward and downward. A crude. The average crude price this year has been monetary action such as quantitative easing by the USD 113. At the same time supplies have grown Federal Reserve (Fed) and the European Central thanks to major production increases in Saudi Bank (ECB) could also drive up crude prices in the Arabia during the first quarter. High oil prices at the short term, not to mention other commodities. same time are a burden for the already shaky Jörgen Kennemar
- 5. Energy & Commodities Monthly newsletter from Swedbank’s Economic Research Department, continued No. 7 • 27 August 2012 Swedbank Commodity Index - US$ - Swedbank Commodity Index - SKr - Basis 2000 = 1oo 28-08-12 Basis 2000 = 1oo 28-08-12 5.2012 6.2012 7.2012 5.2012 6.2012 7.2012 T otal index 356,6 318,8 335,2 T otal index 272,8 244,6 252,9 Per cent change month ago -7,3 -10,6 5,2 Per cent change month ago -3,3 -10,3 3,4 Per cent change year ago -2,8 -11,5 -8,3 Per cent change year ago 9,5 -1,3 -0,2 T otal index exclusive energy 263,0 252,8 256,3 T otal index exclusive energy 201,2 194,0 193,3 Per cent change month ago -3,7 -3,9 1,4 Per cent change month ago 0,5 -3,6 -0,3 Per cent change year ago -18,4 -21,1 -20,0 Per cent change year ago -8,1 -12,0 -13,0 Food, tropical beverages 251,6 246,0 276,3 Food, tropical beverages 192,6 188,8 208,4 Per cent change month ago -2,4 -2,3 12,3 Per cent change month ago 1,8 -2,0 10,4 Per cent change year ago -18,0 -18,5 -8,1 Per cent change year ago -7,6 -9,0 -0,1 Cereals 264,9 272,5 330,5 Cereals 202,7 209,1 249,3 Per cent change month ago -2,7 2,9 21,3 Per cent change month ago 1,5 3,2 19,2 Per cent change year ago -16,9 -11,2 14,6 Per cent change year ago -6,4 -0,9 24,6 T ropical beverages and tobacco 240,8 229,0 247,8 T ropical beverages and tobacco 184,3 175,7 186,9 Per cent change month ago -3,0 -4,9 8,2 Per cent change month ago 1,1 -4,6 6,4 Per cent change year ago -25,4 -28,2 -23,5 Per cent change year ago -16,0 -19,9 -16,8 Coffee 157,2 145,3 159,1 Coffee 120,3 111,5 120,0 Per cent change month ago -2,0 -7,6 9,5 Per cent change month ago 2,2 -7,3 7,6 Per cent change year ago -31,1 -32,5 -24,4 Per cent change year ago -22,3 -24,7 -17,7 Oilseeds and oil 266,4 265,2 302,2 Oilseeds and oil 203,9 203,5 228,0 Per cent change month ago -0,8 -0,5 14,0 Per cent change month ago 3,4 -0,2 12,0 Per cent change year ago 1,0 1,6 16,9 Per cent change year ago 13,8 13,3 27,2 Industrial raw materials 266,2 254,8 250,5 Industrial raw materials 203,7 195,5 189,0 Per cent change month ago -4,0 -4,3 -1,7 Per cent change month ago 0,1 -4,0 -3,4 Per cent change year ago -18,6 -21,8 -23,1 Per cent change year ago -8,3 -12,8 -16,4 Agricultural raw materials 169,6 160,7 158,0 Agricultural raw materials 129,8 123,3 119,2 Per cent change month ago -2,9 -5,2 -1,7 Per cent change month ago 1,3 -5,0 -3,4 Per cent change year ago -17,1 -22,1 -22,1 Per cent change year ago -6,6 -13,1 -15,3 Cotton 79,3 74,3 71,1 Cotton 60,7 57,0 53,6 Per cent change month ago -12,3 -6,3 -4,3 Per cent change month ago -8,5 -6,0 -5,9 Per cent change year ago -48,0 -52,3 -33,7 Per cent change year ago -41,4 -46,8 -27,9 Softwood 134,0 130,5 127,4 Softwood 102,5 100,1 96,1 Per cent change month ago -1,2 -2,6 -2,4 Per cent change month ago 3,1 -2,3 -4,0 Per cent change year ago -13,4 -16,2 -17,7 Per cent change year ago -2,5 -6,5 -10,5 W oodpulp 852,4 835,5 811,2 W oodpulp 652,3 641,2 611,9 Per cent change month ago 0,3 -2,0 -2,9 Per cent change month ago 4,6 -1,7 -4,6 Per cent change year ago -15,6 -18,0 -20,3 Per cent change year ago -4,9 -8,5 -13,3 Non-ferrous metals 231,4 218,2 218,7 Non-ferrous metals 177,1 167,4 165,0 Per cent change month ago -3,3 -5,7 0,2 Per cent change month ago 0,9 -5,4 -1,5 Per cent change year ago -19,5 -22,9 -24,7 Per cent change year ago -9,3 -14,0 -18,1 Copper 7927,3 7414,5 7588,7 Copper 6066,1 5689,8 5724,5 Per cent change month ago -4,0 -6,5 2,3 Per cent change month ago 0,1 -6,2 0,6 Per cent change year ago -11,5 -18,1 -21,1 Per cent change year ago -0,3 -8,7 -14,2 Aluminium 2000,5 1889,5 1873,8 Aluminium 1530,8 1450,0 1413,5 Per cent change month ago -2,3 -5,5 -0,8 Per cent change month ago 1,9 -5,3 -2,5 Per cent change year ago -22,8 -25,9 -25,4 Per cent change year ago -13,1 -17,4 -18,9 Lead 2001,7 1856,9 1876,0 Lead 1531,7 1425,0 1415,2 Per cent change month ago -2,9 -7,2 1,0 Per cent change month ago 1,2 -7,0 -0,7 Per cent change year ago -17,6 -26,2 -30,1 Per cent change year ago -7,2 -17,7 -23,9 Z inc 1930,8 1855,2 1850,8 Z inc 1477,5 1423,7 1396,1 Per cent change month ago -3,3 -3,9 -0,2 Per cent change month ago 0,8 -3,6 -1,9 Per cent change year ago -10,9 -16,8 -22,6 Per cent change year ago 0,4 -7,2 -15,8 Nickel 17017,8 16486,9 16155,1 Nickel 13022,3 12651,9 12186,6 Per cent change month ago -4,8 -3,1 -2,0 Per cent change month ago -0,7 -2,8 -3,7 Per cent change year ago -29,9 -26,1 -31,9 Per cent change year ago -21,0 -17,6 -25,9 Iron ore, steel scrap 611,4 598,6 576,8 Iron ore, steel scrap 467,9 459,4 435,1 Per cent change month ago -5,6 -2,1 -3,6 Per cent change month ago -1,5 -1,8 -5,3 Per cent change year ago -18,6 -20,4 -22,1 Per cent change year ago -8,3 -11,2 -15,2 Energy raw materials 398,1 348,0 370,3 Energy raw materials 304,6 267,1 279,3 Per cent change month ago -8,3 -12,6 6,4 Per cent change month ago -4,4 -12,3 4,6 Per cent change year ago 2,9 -7,8 -3,9 Per cent change year ago 16,0 2,8 4,5 Coking coal 369,2 334,9 339,0 Coking coal 282,5 257,0 255,7 Per cent change month ago -6,2 -9,3 1,2 Per cent change month ago -2,2 -9,0 -0,5 Per cent change year ago -19,6 -27,0 -26,3 Per cent change year ago -9,4 -18,6 -19,8 Crude oil 399,4 348,6 371,7 Crude oil 305,6 267,5 280,4 Per cent change month ago -8,4 -12,7 6,6 Per cent change month ago -4,5 -12,5 4,8 Per cent change year ago 4,2 -6,8 -2,7 Per cent change year ago 17,3 4,0 5,8 Source : SW EDBANK and HW W A-Institute for Economic Research Hamburg Source : SW EDBANK and HW W A-Institute for Economic Research Hamburg Swedbank Economic Research Department Swedbank’s monthly Energy & Commodities newsletter is published as a service to our customers. We believe that we have used reliable sources and methods in the preparation SE-105 34 Stockholm, Sweden of the analyses reported in this publication. However, we cannot guarantee the accuracy or Phone +46-8-5859 7740 completeness of the report and cannot be held responsible for any error or omission in the ek.sekr@swedbank.se underlying material or its use. Readers are encouraged to base any (investment) decisions www.swedbank.se on other material as well. Neither Swedbank nor its employees may be held responsible for Legally responsible publisher losses or damages, direct or indirect, owing to any errors or omissions in Swedbank’s Cecilia Hermansson, +46-88-5859 7720 monthly Energy & Commodities newsletter. Magnus Alvesson, +46-8-5859 3341 Jörgen Kennemar, +46-8-5859 7730 5 (6)