Energy & Commodities, 2010 03 12, pdf
•
0 j'aime•321 vues

Swedbank was founded in 1820, as Sweden’s first savings bank was established. Today, our heritage is visible in that we truly are a bank for each and every one and in that we still strive to contribute to a sustainable development of society and our environment. We are strongly committed to society as a whole and keen to help bring about a sustainable form of societal development. Our Swedish operations hold an ISO 14001 environmental certification, and environmental work is an integral part of our business activities.

Recommandé
Recommandé
Contenu connexe
Plus de Swedbank
Plus de Swedbank (20)
Dernier
Dernier (20)
Energy & Commodities, 2010 03 12, pdf
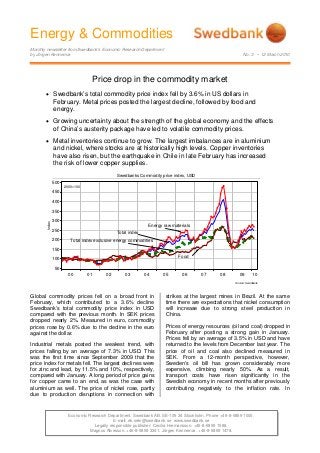
- 1. Energy & Commodities Monthly newsletter from Swedbank’s Economic Research Department by Jörgen Kennemar No. 3 • 12 March 2010 Economic Research Department. Swedbank AB. SE-105 34 Stockholm. Phone +46-8-5859 1000. E-mail: ek.sekr@swedbank.se www.swedbank.se Legally responsible publisher: Cecilia Hermansson. +46-8-5859 1588. Magnus Alvesson. +46-8-5859 3341. Jörgen Kennemar. +46-8-5859 1478. Price drop in the commodity market • Swedbank’s total commodity price index fell by 3.6% in US dollars in February. Metal prices posted the largest decline, followed by food and energy. • Growing uncertainty about the strength of the global economy and the effects of China’s austerity package have led to volatile commodity prices. • Metal inventories continue to grow. The largest imbalances are in aluminium and nickel, where stocks are at historically high levels. Copper inventories have also risen, but the earthquake in Chile in late February has increased the risk of lower copper supplies. Swedbanks Commodity price index, USD Source: Swedbank 00 01 02 03 04 05 06 07 08 09 10 Index 50 100 150 200 250 300 350 400 450 500 Total index exclusive energy commodities Total index Food Energy raw materials 2000=100 Global commodity prices fell on a broad front in February, which contributed to a 3.6% decline Swedbank’s total commodity price index in USD compared with the previous month. In SEK prices dropped nearly 2%. Measured in euro, commodity prices rose by 0.6% due to the decline in the euro against the dollar. Industrial metals posted the weakest trend, with prices falling by an average of 7.3% in USD. This was the first time since September 2009 that the price index for metals fell. The largest declines were for zinc and lead, by 11.5% and 10%, respectively, compared with January. A long period of price gains for copper came to an end, as was the case with aluminium as well. The price of nickel rose, partly due to production disruptions in connection with strikes at the largest mines in Brazil. At the same time there are expectations that nickel consumption will increase due to strong steel production in China. Prices of energy resources (oil and coal) dropped in February after posting a strong gain in January. Prices fell by an average of 3.5% in USD and have returned to the levels from December last year. The price of oil and coal also declined measured in SEK. From a 12-month perspective, however, Sweden's oil bill has grown considerably more expensive, climbing nearly 50%. As a result, transport costs have risen significantly in the Swedish economy in recent months after previously contributing negatively to the inflation rate. In
- 2. Energy & Commodities Monthly newsletter from Swedbank’s Economic Research Department, continued No. 3 • 12 March 2010 2 (4) January and February transport prices rose by an average of 7% on an annual basis. The improved global economy has not had as clear an impact on food prices. Since February of last year food prices have risen by 17% in Swedbank’s commodity price index. This is significantly weaker than economically sensitive metal prices, which have more than doubled in the last year. Food prices have been bifurcated. Grain prices are still under pressure from large inventories after last year's record harvests, and in February fell by 5% in USD. In SEK the price trend has been even more unfavourable for Swedish grain producers. Other foods such as sugar, tea and cocoa prices have trended in the opposite direction. Unfavourable weather conditions have led to lower production, which has pushed prices to historically high levels. Because of expectations that production will increase this spring in several major food-producing countries, including Brazil, sugar prices have dropped this month. Increased volatility in commodity markets Although commodity prices fell on average in February, the market reported relatively large fluctuations. This is particularly true of metals and oil, where prices have been volatile. This may be partly due to increased uncertainty about the global economy, especially how China's austerity measures will affect demand for raw materials and input goods. The diminishing impact from the infrastructure investments China introduced on a wide scale in 2009 could lead to weaker raw material demand in 2010. Since the Chinese economy accounts for a significant share of global commodity consumption, notably metals, there would be a sizable impact on the market if its demand for raw materials were to grow slower than expected. Economic data from China will be especially important to monitor in the months ahead to see how effective austerity measures are. There are as yet no clear signs from trade data that China's growth rate has slowed. Its exports and imports both rose by slightly over 40% in February compared with a year earlier. This has eased the financial market’s concerns about lower Chinese commodity demand, and instead prices turned higher in the second half of February and early March. Currency fluctuations are another reason for price swings in commodity markets. Growing concern about the euro, in no small part due to the situation in Greece and weak European economy, has driven the US dollar higher since December 2009. A stronger dollar means more expensive raw materials for countries that buy them in other currencies. This means less consumption and lower prices. There is a co-variation between certain raw materials such as gold and the dollar. A further appreciation in the dollar would therefore pressure gold prices downward from today's high levels. In 2010 this co-variation has been less evident. Increased uncertainty about the fiscal strength of the EMU zone is certainly a factor why the price of gold remains high despite a stronger dollar. Increased supply of metals Metal inventories continue to rise, which could eventually lead to lower prices, provided the global economy doesn't grow more than expected. Though global conditions have improved in recent months, it was from low levels. At the same time investment needs are limited, primarily in OECD countries. The largest imbalances are in aluminium. Still, aluminium prices have risen by slightly over 50% since February 2009. Copper inventories are also rising, and reached their highest level since February 2009, before China began building up its metal inventories. Aluminium price and stock level Source: Reuters EcoWin 00 01 02 03 04 05 06 07 08 09 10 USD 750 1000 1250 1500 1750 2000 2250 2500 2750 3000 3250 Ton(metric)(millions) 0.0 0.5 1.0 1.5 2.0 2.5 3.0 3.5 4.0 4.5 5.0 Aluminium price, right scale Stock level aluminium, left scale Chile is the world's largest copper producer, accounting for over one third of global production. The devastating earthquake on February 27 has increased uncertainty about future supplies. The earthquake has not devastated the country's mining industry as feared, however. Instead, disruptions to electricity distribution and damaged infrastructure (roads, railroads and ports) are what could lead to a lower supply of copper, thereby affecting prices. Fears of limited copper supplies would presumably mean higher copper prices. Strong trade numbers from China further support the assumption that copper demand will remain strong. Strong oil consumption growth in Asia The fundamentals in the oil market have improved in recent quarters, but there is still a bifurcated picture: steadily growing oil consumption in emerging economies and continued weakness in OECD countries. US oil inventories remain at
- 3. Energy & Commodities Monthly newsletter from Swedbank’s Economic Research Department, continued No. 3 • 12 March 2010 3 (4) historically high levels. Besides the fragile recovery in the US and Europe, oil consumption is being held in check by energy efficiency improvements and advances in alternative energy sources. In emerging economies, consumption of oil and oil products will continue to steadily rose, and oil consumption per capita remains far from current levels in OECD countries. Global oil consumption growth, 2000=100 China OECD World Source: IEA 00 01 02 03 04 05 06 07 08 09 10 11 Index 90 100 110 120 130 140 150 160 170 180 190 200 2000=100 What will happen to the price of oil in the short term? The sluggish recovery in OECD countries and production rates that exceed oil consumption are holding down the price of oil. The OPEC meeting on March 17 could provide guidance on production volumes. OPEC countries are struggling with production levels above their targets, so we can expect pressure on members to turn down the taps. At the same time the global economy rests on shaky ground, so higher oil prices could jeopardise the recovery. Domestic political goals could also thwart production cutbacks, especially among oil producers that have been hard hit by the global slowdown. The dollar is yet another uncertainty, at least partly due to the fiscal challenges in the US and EMU countries. A further increase in the dollar would limit the rise in oil prices. To date the stronger dollar has had limited impact on the price of oil. This is an indication that global demand has grown, especially in Asia. Jörgen Kennemar
- 4. Energy & Commodities Monthly newsletter from Swedbank’s Economic Research Department, continued No. 3 • 12 March 2010 4 (4) Swedbank Commodity Index - US$ - Basis 2000 = 1oo 12-03-10 12.2009 1.2010 2.2010 Total index 251,5 260,6 251,3 Per cent change month ago -1,4 3,6 -3,6 Per cent change year ago 60,4 63,3 62,7 Total index exclusive energy 219,7 224,6 216,1 Per cent change month ago 3,9 2,2 -3,8 Per cent change year ago 33,2 41,3 38,8 Food, tropical beverages 227,0 228,8 218,2 Per cent change month ago 3,7 0,8 -4,7 Per cent change year ago 30,6 20,8 17,2 Cereals 204,7 197,3 187,7 Per cent change month ago 3,2 -3,6 -4,9 Per cent change year ago 7,2 -4,4 -4,4 Tropical beverages and tobacco 246,1 255,7 243,3 Per cent change month ago 4,5 3,9 -4,8 Per cent change year ago 42,7 39,3 31,2 Coffee 125,0 126,9 123,4 Per cent change month ago 4,4 1,5 -2,8 Per cent change year ago 21,2 17,1 14,7 Oilseeds and oil 200,5 191,4 183,8 Per cent change month ago 2,0 -4,5 -4,0 Per cent change year ago 21,2 0,2 1,5 Industrial raw materials 217,6 223,4 215,5 Per cent change month ago 4,0 2,7 -3,5 Per cent change year ago 33,9 48,8 46,7 Agricultural raw materials 156,9 158,7 157,7 Per cent change month ago 2,7 1,1 -0,6 Per cent change year ago 42,2 44,5 50,8 Cotton 74,7 71,9 74,5 Per cent change month ago 8,7 -3,7 3,6 Per cent change year ago 66,0 46,4 63,0 Softwood 139,8 138,6 136,4 Per cent change month ago -0,3 -0,9 -1,6 Per cent change year ago 24,3 28,3 33,2 Woodpulp 796,1 814,4 840,2 Per cent change month ago 3,0 2,3 3,2 Per cent change year ago 18,6 31,7 42,3 Non-ferrous metals 225,6 237,0 219,7 Per cent change month ago 6,3 5,1 -7,3 Per cent change year ago 83,9 89,8 80,7 Copper 6962,6 7385,6 6835,4 Per cent change month ago 4,3 6,1 -7,4 Per cent change year ago 124,9 129,3 106,3 Aluminium 2178,4 2236,2 2043,9 Per cent change month ago 11,8 2,7 -8,6 Per cent change year ago 46,2 57,6 54,1 Lead 2324,5 2367,7 2131,4 Per cent change month ago 0,7 1,9 -10,0 Per cent change year ago 140,7 109,2 92,2 Zinc 2366,0 2434,1 2155,2 Per cent change month ago 7,9 2,9 -11,5 Per cent change year ago 115,3 105,0 93,9 Nickel 16989,9 18434,6 18872,4 Per cent change month ago 0,0 8,5 2,4 Per cent change year ago 76,4 63,1 81,4 Iron ore, steel scrap 350,0 350,1 351,5 Per cent change month ago 1,6 0,0 0,4 Per cent change year ago -14,2 8,1 7,8 Energy raw materials 265,6 276,6 266,9 Per cent change month ago -3,3 4,1 -3,5 Per cent change year ago 73,4 72,9 73,4 Coking coal 306,1 365,4 347,9 Per cent change month ago 4,3 19,4 -4,8 Per cent change year ago 2,4 16,5 23,3 Crude oil 263,7 272,5 263,2 Per cent change month ago -3,7 3,3 -3,4 Per cent change year ago 80,0 78,2 77,7 Swedbank Commodity Index - SKr - Basis 2000 = 1oo 12-03-10 12.2009 1.2010 2.2010 Total index 195,2 202,2 198,3 Per cent change month ago 1,7 3,6 -1,9 Per cent change year ago 43,5 44,3 38,4 Total index exclusive energy 170,5 174,3 170,5 Per cent change month ago 7,2 2,2 -2,2 Per cent change year ago 19,1 24,9 18,2 Food, tropical beverages 176,2 177,6 172,2 Per cent change month ago 7,0 0,8 -3,1 Per cent change year ago 16,9 6,7 -0,3 Cereals 158,9 153,1 148,1 Per cent change month ago 6,5 -3,6 -3,3 Per cent change year ago -4,1 -15,5 -18,6 Tropical beverages and tobacco 191,0 198,4 192,0 Per cent change month ago 7,8 3,9 -3,3 Per cent change year ago 27,6 23,1 11,7 Coffee 97,0 98,5 97,4 Per cent change month ago 7,7 1,5 -1,1 Per cent change year ago 8,5 3,4 -2,4 Oilseeds and oil 155,6 148,5 145,0 Per cent change month ago 5,3 -4,5 -2,4 Per cent change year ago 8,5 -11,5 -13,6 Industrial raw materials 168,9 173,3 170,1 Per cent change month ago 7,3 2,7 -1,9 Per cent change year ago 19,8 31,5 24,9 Agricultural raw materials 121,8 123,2 124,4 Per cent change month ago 5,9 1,1 1,0 Per cent change year ago 27,3 27,7 28,3 Cotton 58,0 55,8 58,8 Per cent change month ago 12,2 -3,7 5,4 Per cent change year ago 48,5 29,4 38,7 Softwood 108,5 107,6 107,6 Per cent change month ago 2,9 -0,9 0,1 Per cent change year ago 11,2 13,4 13,4 Woodpulp 617,8 632,0 663,0 Per cent change month ago 6,3 2,3 4,9 Per cent change year ago 6,1 16,4 21,1 Non-ferrous metals 175,1 183,9 173,4 Per cent change month ago 9,6 5,1 -5,7 Per cent change year ago 64,5 67,7 53,8 Copper 5403,6 5731,9 5394,0 Per cent change month ago 7,6 6,1 -5,9 Per cent change year ago 101,2 102,7 75,5 Aluminium 1690,6 1735,5 1612,9 Per cent change month ago 15,3 2,7 -7,1 Per cent change year ago 30,8 39,2 31,2 Lead 1804,0 1837,5 1682,0 Per cent change month ago 3,9 1,9 -8,5 Per cent change year ago 115,3 84,9 63,6 Zinc 1836,2 1889,1 1700,7 Per cent change month ago 11,3 2,9 -10,0 Per cent change year ago 92,6 81,2 65,0 Nickel 13185,6 14306,9 14892,8 Per cent change month ago 3,2 8,5 4,1 Per cent change year ago 57,8 44,1 54,4 Iron ore, steel scrap 271,6 271,7 277,4 Per cent change month ago 4,8 0,0 2,1 Per cent change year ago -23,2 -4,5 -8,3 Energy raw materials 206,1 214,6 210,6 Per cent change month ago -0,2 4,1 -1,9 Per cent change year ago 55,1 52,8 47,5 Coking coal 237,6 283,6 274,5 Per cent change month ago 7,6 19,4 -3,2 Per cent change year ago -8,3 2,9 5,0 Crude oil 204,7 211,5 207,7 Per cent change month ago -0,6 3,3 -1,8 Per cent change year ago 61,1 57,5 51,3 Swedbank Economic Research Department SE-105 34 Stockholm, Sweden Phone +46-8-5859 1028 ek.sekr@swedbank.se www.swedbank.se Legally responsible publisher Cecilia Hermansson, +46-88-5859 1588 Magnus Alvesson, +46-8-5859 3341 Jörgen Kennemar, +46-8-5859 1478 Swedbank’s monthly Energy & Commodities newsletter is published as a service to our customers. We believe that we have used reliable sources and methods in the preparation of the analyses reported in this publication. However, we cannot guarantee the accuracy or completeness of the report and cannot be held responsible for any error or omission in the underlying material or its use. Readers are encouraged to base any (investment) decisions on other material as well. Neither Swedbank nor its employees may be held responsible for losses or damages, direct or indirect, owing to any errors or omissions in Swedbank’s monthly Energy & Commodities newsletter.