SlideShare une entreprise Scribd logo
1  sur  6
Télécharger pour lire hors ligne
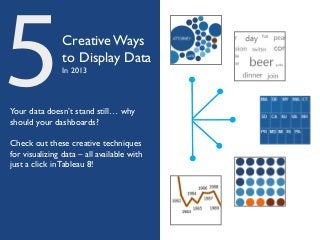
5               Creative Ways
                to Display Data
                In 2013


Your data doesn’t stand still… why
should your dashboards?

Check out these creative techniques
for visualizing data – all available with
just a click in Tableau 8!
1
Tree/Bar Combo
The bar chart – as classic
as a grilled cheese! But
what would grilled cheese
be without tomato soup?

As you can see this viz
allows us to compare
relative sizes, just like a
bar chart, but it also uses
a tree map inside the bars
to show us more detail.

We can see from the bars
that Barack Obama raised
more money in total. But
the colorful tree map
shows us the other half
of the story: Romney’s
average donation was
much higher.
2
Bubble Charts
Bubble charts are a
beautiful way to display
comparative information
and are especially useful
when broken up by a
category, as you see here.

This viz shows average
campaign donations by
occupation.Those with
averages less than $250 or
totals less than $10,000 are
filtered out.

Clearly, the attorneys went
with Obama and the
bankers went with Romney!
They only have “Vice
President” in common.
3
Infographic Style
Often, displaying data is
about telling a story.
Ideally it would be easy
to add images,
annotations, legends,
labels and links to your
own stories where
appropriate.

In Tableau 8, you can
create dashboards that
allow you to place any
object on top of your viz
(even another viz!).

The result? A clear and
concise story that tells
itself.
Unit Charts
Unit charts are a simple
way of displaying the
relative number or
hierarchy of items.
Basically, you use colored
icons (in this case circles)
to show how many of
something belong to a
category or order.

In this viz, we are looking
at the fastest cars in the
world. They are arranged
from fastest to “slowest”
from top left to bottom
right, with the color of
the circle representing
their 0-60 time and
grouping them with cars
of similar speed.
5
Word Cloud
You’re right! In most
cases there are better
ways to display data than
a word cloud. For
example, they are not
fantastic for comparing
relative sizes or amounts.

But, word clouds can be
an excellent way to show
the frequency of different
words or events.

Here you can see words
in tweets during the week
of #TCC12 - and Beer
Week. Beer Week seems
to have won this race…
we’ll console ourselves
with a porter!

Contenu connexe

En vedette

How NOT to Run Your Company – Lessons Learned
How NOT to Run Your Company – Lessons LearnedHow NOT to Run Your Company – Lessons Learned
How NOT to Run Your Company – Lessons LearnedWeekdone.com
 
500 Demo Day Batch 19: Gluwa
500 Demo Day Batch 19: Gluwa500 Demo Day Batch 19: Gluwa
500 Demo Day Batch 19: Gluwa500 Startups
 
10 Color Banner Design Inspiration
10 Color Banner Design Inspiration10 Color Banner Design Inspiration
10 Color Banner Design InspirationBannersnack
 
Lightning Talk #9: How UX and Data Storytelling Can Shape Policy by Mika Aldaba
Lightning Talk #9: How UX and Data Storytelling Can Shape Policy by Mika AldabaLightning Talk #9: How UX and Data Storytelling Can Shape Policy by Mika Aldaba
Lightning Talk #9: How UX and Data Storytelling Can Shape Policy by Mika Aldabaux singapore
 
Clickbait: A Guide To Writing Un-Ignorable Headlines
Clickbait: A Guide To Writing Un-Ignorable HeadlinesClickbait: A Guide To Writing Un-Ignorable Headlines
Clickbait: A Guide To Writing Un-Ignorable HeadlinesVenngage
 
Dispatches From The New Economy: The Five Faces Of The On-Demand Economy
Dispatches From The New Economy: The Five Faces Of The On-Demand EconomyDispatches From The New Economy: The Five Faces Of The On-Demand Economy
Dispatches From The New Economy: The Five Faces Of The On-Demand EconomyIntuit Inc.
 
How a Strong Brand Boosts B2B Demand
How a Strong Brand Boosts B2B DemandHow a Strong Brand Boosts B2B Demand
How a Strong Brand Boosts B2B DemandGYK Antler
 
10 Engagement Lessons Learned From 1 Million Survey Answers
10 Engagement Lessons Learned From 1 Million Survey Answers10 Engagement Lessons Learned From 1 Million Survey Answers
10 Engagement Lessons Learned From 1 Million Survey AnswersD B
 
Activism x Technology
Activism x TechnologyActivism x Technology
Activism x TechnologyWebVisions
 
Prototyping is an attitude
Prototyping is an attitudePrototyping is an attitude
Prototyping is an attitudeWith Company
 
Get Featured: So You Want to be on the Front Page of SlideShare?
Get Featured: So You Want to be on the Front Page of SlideShare?Get Featured: So You Want to be on the Front Page of SlideShare?
Get Featured: So You Want to be on the Front Page of SlideShare?Venngage
 
The Best Places To Travel To
The Best Places To Travel ToThe Best Places To Travel To
The Best Places To Travel ToRyan McCready
 
Designing Teams for Emerging Challenges
Designing Teams for Emerging ChallengesDesigning Teams for Emerging Challenges
Designing Teams for Emerging ChallengesAaron Irizarry
 
38 Employee Engagement Ideas Your Team Will Love
38 Employee Engagement Ideas Your Team Will Love38 Employee Engagement Ideas Your Team Will Love
38 Employee Engagement Ideas Your Team Will LoveElodie A.
 
The Sketchnote Mini-Workshop
The Sketchnote Mini-WorkshopThe Sketchnote Mini-Workshop
The Sketchnote Mini-WorkshopMike Rohde
 
Fight for Yourself: How to Sell Your Ideas and Crush Presentations
Fight for Yourself: How to Sell Your Ideas and Crush PresentationsFight for Yourself: How to Sell Your Ideas and Crush Presentations
Fight for Yourself: How to Sell Your Ideas and Crush PresentationsDigital Surgeons
 
Top Productivity Working Hacks by Jan Rezab
Top Productivity Working Hacks by Jan RezabTop Productivity Working Hacks by Jan Rezab
Top Productivity Working Hacks by Jan RezabJan Rezab
 

En vedette (17)

How NOT to Run Your Company – Lessons Learned
How NOT to Run Your Company – Lessons LearnedHow NOT to Run Your Company – Lessons Learned
How NOT to Run Your Company – Lessons Learned
 
500 Demo Day Batch 19: Gluwa
500 Demo Day Batch 19: Gluwa500 Demo Day Batch 19: Gluwa
500 Demo Day Batch 19: Gluwa
 
10 Color Banner Design Inspiration
10 Color Banner Design Inspiration10 Color Banner Design Inspiration
10 Color Banner Design Inspiration
 
Lightning Talk #9: How UX and Data Storytelling Can Shape Policy by Mika Aldaba
Lightning Talk #9: How UX and Data Storytelling Can Shape Policy by Mika AldabaLightning Talk #9: How UX and Data Storytelling Can Shape Policy by Mika Aldaba
Lightning Talk #9: How UX and Data Storytelling Can Shape Policy by Mika Aldaba
 
Clickbait: A Guide To Writing Un-Ignorable Headlines
Clickbait: A Guide To Writing Un-Ignorable HeadlinesClickbait: A Guide To Writing Un-Ignorable Headlines
Clickbait: A Guide To Writing Un-Ignorable Headlines
 
Dispatches From The New Economy: The Five Faces Of The On-Demand Economy
Dispatches From The New Economy: The Five Faces Of The On-Demand EconomyDispatches From The New Economy: The Five Faces Of The On-Demand Economy
Dispatches From The New Economy: The Five Faces Of The On-Demand Economy
 
How a Strong Brand Boosts B2B Demand
How a Strong Brand Boosts B2B DemandHow a Strong Brand Boosts B2B Demand
How a Strong Brand Boosts B2B Demand
 
10 Engagement Lessons Learned From 1 Million Survey Answers
10 Engagement Lessons Learned From 1 Million Survey Answers10 Engagement Lessons Learned From 1 Million Survey Answers
10 Engagement Lessons Learned From 1 Million Survey Answers
 
Activism x Technology
Activism x TechnologyActivism x Technology
Activism x Technology
 
Prototyping is an attitude
Prototyping is an attitudePrototyping is an attitude
Prototyping is an attitude
 
Get Featured: So You Want to be on the Front Page of SlideShare?
Get Featured: So You Want to be on the Front Page of SlideShare?Get Featured: So You Want to be on the Front Page of SlideShare?
Get Featured: So You Want to be on the Front Page of SlideShare?
 
The Best Places To Travel To
The Best Places To Travel ToThe Best Places To Travel To
The Best Places To Travel To
 
Designing Teams for Emerging Challenges
Designing Teams for Emerging ChallengesDesigning Teams for Emerging Challenges
Designing Teams for Emerging Challenges
 
38 Employee Engagement Ideas Your Team Will Love
38 Employee Engagement Ideas Your Team Will Love38 Employee Engagement Ideas Your Team Will Love
38 Employee Engagement Ideas Your Team Will Love
 
The Sketchnote Mini-Workshop
The Sketchnote Mini-WorkshopThe Sketchnote Mini-Workshop
The Sketchnote Mini-Workshop
 
Fight for Yourself: How to Sell Your Ideas and Crush Presentations
Fight for Yourself: How to Sell Your Ideas and Crush PresentationsFight for Yourself: How to Sell Your Ideas and Crush Presentations
Fight for Yourself: How to Sell Your Ideas and Crush Presentations
 
Top Productivity Working Hacks by Jan Rezab
Top Productivity Working Hacks by Jan RezabTop Productivity Working Hacks by Jan Rezab
Top Productivity Working Hacks by Jan Rezab
 

Plus de Tableau Software

Enabling Governed Data Access with Tableau Data Server
Enabling Governed Data Access with Tableau Data Server Enabling Governed Data Access with Tableau Data Server
Enabling Governed Data Access with Tableau Data Server Tableau Software
 
Seven Trends in Government Business Intelligence
Seven Trends in Government Business IntelligenceSeven Trends in Government Business Intelligence
Seven Trends in Government Business IntelligenceTableau Software
 
Data analytics for university students
Data analytics for university studentsData analytics for university students
Data analytics for university studentsTableau Software
 
Four ways data is improving healthcare operations
Four ways data is improving healthcare operationsFour ways data is improving healthcare operations
Four ways data is improving healthcare operationsTableau Software
 
Six Trends in Retail Analytics
Six Trends in Retail Analytics Six Trends in Retail Analytics
Six Trends in Retail Analytics Tableau Software
 
Top 10 Cloud Trends for 2017
Top 10 Cloud Trends for 2017Top 10 Cloud Trends for 2017
Top 10 Cloud Trends for 2017Tableau Software
 
5 Reasons to Move Your BI to the Cloud
5 Reasons to Move Your BI to the Cloud5 Reasons to Move Your BI to the Cloud
5 Reasons to Move Your BI to the CloudTableau Software
 
The Top 8 Trends for Big Data in 2016
The Top 8 Trends for Big Data in 2016The Top 8 Trends for Big Data in 2016
The Top 8 Trends for Big Data in 2016Tableau Software
 
Big Risks Requires Big Data Thinking
Big Risks Requires Big Data ThinkingBig Risks Requires Big Data Thinking
Big Risks Requires Big Data ThinkingTableau Software
 
IT Summit - Modernizing Enterprise Analytics: the IT Story
IT Summit - Modernizing Enterprise Analytics: the IT StoryIT Summit - Modernizing Enterprise Analytics: the IT Story
IT Summit - Modernizing Enterprise Analytics: the IT StoryTableau Software
 
Modern Manufacturing: 4 Ways Data is Transforming the Industry
Modern Manufacturing: 4 Ways Data is Transforming the IndustryModern Manufacturing: 4 Ways Data is Transforming the Industry
Modern Manufacturing: 4 Ways Data is Transforming the IndustryTableau Software
 
An Analytics Culture Drives Performance in Asia Pacific Organizations
An Analytics Culture Drives Performance in Asia Pacific Organizations An Analytics Culture Drives Performance in Asia Pacific Organizations
An Analytics Culture Drives Performance in Asia Pacific Organizations Tableau Software
 
How a Data-Driven Culture Improves Organizational Performance
How a Data-Driven Culture Improves Organizational Performance How a Data-Driven Culture Improves Organizational Performance
How a Data-Driven Culture Improves Organizational Performance Tableau Software
 
7 Ways Sports Teams Win With Sports Analytics
7 Ways Sports Teams Win With Sports Analytics7 Ways Sports Teams Win With Sports Analytics
7 Ways Sports Teams Win With Sports AnalyticsTableau Software
 
2015 商业智能 10 大趋势
2015 商业智能 10 大趋势2015 商业智能 10 大趋势
2015 商业智能 10 大趋势Tableau Software
 
As 10 principais tendências em business intelligence para 2015
As 10 principais tendências em business intelligence para 2015As 10 principais tendências em business intelligence para 2015
As 10 principais tendências em business intelligence para 2015Tableau Software
 

Plus de Tableau Software (20)

Enabling Governed Data Access with Tableau Data Server
Enabling Governed Data Access with Tableau Data Server Enabling Governed Data Access with Tableau Data Server
Enabling Governed Data Access with Tableau Data Server
 
Seven Trends in Government Business Intelligence
Seven Trends in Government Business IntelligenceSeven Trends in Government Business Intelligence
Seven Trends in Government Business Intelligence
 
Data analytics for university students
Data analytics for university studentsData analytics for university students
Data analytics for university students
 
Get Data Smart
Get Data Smart Get Data Smart
Get Data Smart
 
Four ways data is improving healthcare operations
Four ways data is improving healthcare operationsFour ways data is improving healthcare operations
Four ways data is improving healthcare operations
 
Six Trends in Retail Analytics
Six Trends in Retail Analytics Six Trends in Retail Analytics
Six Trends in Retail Analytics
 
Top 10 Cloud Trends for 2017
Top 10 Cloud Trends for 2017Top 10 Cloud Trends for 2017
Top 10 Cloud Trends for 2017
 
AskAndy Anything 2016
AskAndy Anything 2016AskAndy Anything 2016
AskAndy Anything 2016
 
5 Reasons to Move Your BI to the Cloud
5 Reasons to Move Your BI to the Cloud5 Reasons to Move Your BI to the Cloud
5 Reasons to Move Your BI to the Cloud
 
The Top 8 Trends for Big Data in 2016
The Top 8 Trends for Big Data in 2016The Top 8 Trends for Big Data in 2016
The Top 8 Trends for Big Data in 2016
 
Big Risks Requires Big Data Thinking
Big Risks Requires Big Data ThinkingBig Risks Requires Big Data Thinking
Big Risks Requires Big Data Thinking
 
IT Summit - Modernizing Enterprise Analytics: the IT Story
IT Summit - Modernizing Enterprise Analytics: the IT StoryIT Summit - Modernizing Enterprise Analytics: the IT Story
IT Summit - Modernizing Enterprise Analytics: the IT Story
 
Modern Manufacturing: 4 Ways Data is Transforming the Industry
Modern Manufacturing: 4 Ways Data is Transforming the IndustryModern Manufacturing: 4 Ways Data is Transforming the Industry
Modern Manufacturing: 4 Ways Data is Transforming the Industry
 
7 Trends in the Cloud
7 Trends in the Cloud7 Trends in the Cloud
7 Trends in the Cloud
 
An Analytics Culture Drives Performance in Asia Pacific Organizations
An Analytics Culture Drives Performance in Asia Pacific Organizations An Analytics Culture Drives Performance in Asia Pacific Organizations
An Analytics Culture Drives Performance in Asia Pacific Organizations
 
How a Data-Driven Culture Improves Organizational Performance
How a Data-Driven Culture Improves Organizational Performance How a Data-Driven Culture Improves Organizational Performance
How a Data-Driven Culture Improves Organizational Performance
 
7 Ways Sports Teams Win With Sports Analytics
7 Ways Sports Teams Win With Sports Analytics7 Ways Sports Teams Win With Sports Analytics
7 Ways Sports Teams Win With Sports Analytics
 
7 trends-for-big-data
7 trends-for-big-data7 trends-for-big-data
7 trends-for-big-data
 
2015 商业智能 10 大趋势
2015 商业智能 10 大趋势2015 商业智能 10 大趋势
2015 商业智能 10 大趋势
 
As 10 principais tendências em business intelligence para 2015
As 10 principais tendências em business intelligence para 2015As 10 principais tendências em business intelligence para 2015
As 10 principais tendências em business intelligence para 2015
 

Dernier

昆士兰大学毕业证(UQ毕业证)#文凭成绩单#真实留信学历认证永久存档
昆士兰大学毕业证(UQ毕业证)#文凭成绩单#真实留信学历认证永久存档昆士兰大学毕业证(UQ毕业证)#文凭成绩单#真实留信学历认证永久存档
昆士兰大学毕业证(UQ毕业证)#文凭成绩单#真实留信学历认证永久存档208367051
 
原版美国亚利桑那州立大学毕业证成绩单pdf电子版制作修改#毕业文凭制作#回国入职#diploma#degree
原版美国亚利桑那州立大学毕业证成绩单pdf电子版制作修改#毕业文凭制作#回国入职#diploma#degree原版美国亚利桑那州立大学毕业证成绩单pdf电子版制作修改#毕业文凭制作#回国入职#diploma#degree
原版美国亚利桑那州立大学毕业证成绩单pdf电子版制作修改#毕业文凭制作#回国入职#diploma#degreeyuu sss
 
PORTAFOLIO 2024_ ANASTASIYA KUDINOVA
PORTAFOLIO   2024_  ANASTASIYA  KUDINOVAPORTAFOLIO   2024_  ANASTASIYA  KUDINOVA
PORTAFOLIO 2024_ ANASTASIYA KUDINOVAAnastasiya Kudinova
 
Top 10 Modern Web Design Trends for 2025
Top 10 Modern Web Design Trends for 2025Top 10 Modern Web Design Trends for 2025
Top 10 Modern Web Design Trends for 2025Rndexperts
 
PORTFOLIO DE ARQUITECTURA CRISTOBAL HERAUD 2024
PORTFOLIO DE ARQUITECTURA CRISTOBAL HERAUD 2024PORTFOLIO DE ARQUITECTURA CRISTOBAL HERAUD 2024
PORTFOLIO DE ARQUITECTURA CRISTOBAL HERAUD 2024CristobalHeraud
 
Untitled presedddddddddddddddddntation (1).pptx
Untitled presedddddddddddddddddntation (1).pptxUntitled presedddddddddddddddddntation (1).pptx
Untitled presedddddddddddddddddntation (1).pptxmapanig881
 
Abu Dhabi Call Girls O58993O4O2 Call Girls in Abu Dhabi`
Abu Dhabi Call Girls O58993O4O2 Call Girls in Abu Dhabi`Abu Dhabi Call Girls O58993O4O2 Call Girls in Abu Dhabi`
Abu Dhabi Call Girls O58993O4O2 Call Girls in Abu Dhabi`dajasot375
 
办理学位证(SFU证书)西蒙菲莎大学毕业证成绩单原版一比一
办理学位证(SFU证书)西蒙菲莎大学毕业证成绩单原版一比一办理学位证(SFU证书)西蒙菲莎大学毕业证成绩单原版一比一
办理学位证(SFU证书)西蒙菲莎大学毕业证成绩单原版一比一F dds
 
Call Girls in Okhla Delhi 💯Call Us 🔝8264348440🔝
Call Girls in Okhla Delhi 💯Call Us 🔝8264348440🔝Call Girls in Okhla Delhi 💯Call Us 🔝8264348440🔝
Call Girls in Okhla Delhi 💯Call Us 🔝8264348440🔝soniya singh
 
办理(UC毕业证书)查尔斯顿大学毕业证成绩单原版一比一
办理(UC毕业证书)查尔斯顿大学毕业证成绩单原版一比一办理(UC毕业证书)查尔斯顿大学毕业证成绩单原版一比一
办理(UC毕业证书)查尔斯顿大学毕业证成绩单原版一比一z xss
 
办理学位证(NUS证书)新加坡国立大学毕业证成绩单原版一比一
办理学位证(NUS证书)新加坡国立大学毕业证成绩单原版一比一办理学位证(NUS证书)新加坡国立大学毕业证成绩单原版一比一
办理学位证(NUS证书)新加坡国立大学毕业证成绩单原版一比一Fi L
 
ARt app | UX Case Study
ARt app | UX Case StudyARt app | UX Case Study
ARt app | UX Case StudySophia Viganò
 
Dubai Calls Girl Tapes O525547819 Real Tapes Escort Services Dubai
Dubai Calls Girl Tapes O525547819 Real Tapes Escort Services DubaiDubai Calls Girl Tapes O525547819 Real Tapes Escort Services Dubai
Dubai Calls Girl Tapes O525547819 Real Tapes Escort Services Dubaikojalkojal131
 
办理(宾州州立毕业证书)美国宾夕法尼亚州立大学毕业证成绩单原版一比一
办理(宾州州立毕业证书)美国宾夕法尼亚州立大学毕业证成绩单原版一比一办理(宾州州立毕业证书)美国宾夕法尼亚州立大学毕业证成绩单原版一比一
办理(宾州州立毕业证书)美国宾夕法尼亚州立大学毕业证成绩单原版一比一F La
 
3D Printing And Designing Final Report.pdf
3D Printing And Designing Final Report.pdf3D Printing And Designing Final Report.pdf
3D Printing And Designing Final Report.pdfSwaraliBorhade
 
办理学位证(TheAuckland证书)新西兰奥克兰大学毕业证成绩单原版一比一
办理学位证(TheAuckland证书)新西兰奥克兰大学毕业证成绩单原版一比一办理学位证(TheAuckland证书)新西兰奥克兰大学毕业证成绩单原版一比一
办理学位证(TheAuckland证书)新西兰奥克兰大学毕业证成绩单原版一比一Fi L
 
2024新版美国旧金山州立大学毕业证成绩单pdf电子版制作修改#毕业文凭制作#回国入职#diploma#degree
2024新版美国旧金山州立大学毕业证成绩单pdf电子版制作修改#毕业文凭制作#回国入职#diploma#degree2024新版美国旧金山州立大学毕业证成绩单pdf电子版制作修改#毕业文凭制作#回国入职#diploma#degree
2024新版美国旧金山州立大学毕业证成绩单pdf电子版制作修改#毕业文凭制作#回国入职#diploma#degreeyuu sss
 
毕业文凭制作#回国入职#diploma#degree澳洲弗林德斯大学毕业证成绩单pdf电子版制作修改#毕业文凭制作#回国入职#diploma#degree
毕业文凭制作#回国入职#diploma#degree澳洲弗林德斯大学毕业证成绩单pdf电子版制作修改#毕业文凭制作#回国入职#diploma#degree 毕业文凭制作#回国入职#diploma#degree澳洲弗林德斯大学毕业证成绩单pdf电子版制作修改#毕业文凭制作#回国入职#diploma#degree
毕业文凭制作#回国入职#diploma#degree澳洲弗林德斯大学毕业证成绩单pdf电子版制作修改#毕业文凭制作#回国入职#diploma#degree ttt fff
 
Cosumer Willingness to Pay for Sustainable Bricks
Cosumer Willingness to Pay for Sustainable BricksCosumer Willingness to Pay for Sustainable Bricks
Cosumer Willingness to Pay for Sustainable Bricksabhishekparmar618
 
Design principles on typography in design
Design principles on typography in designDesign principles on typography in design
Design principles on typography in designnooreen17
 

Dernier (20)

昆士兰大学毕业证(UQ毕业证)#文凭成绩单#真实留信学历认证永久存档
昆士兰大学毕业证(UQ毕业证)#文凭成绩单#真实留信学历认证永久存档昆士兰大学毕业证(UQ毕业证)#文凭成绩单#真实留信学历认证永久存档
昆士兰大学毕业证(UQ毕业证)#文凭成绩单#真实留信学历认证永久存档
 
原版美国亚利桑那州立大学毕业证成绩单pdf电子版制作修改#毕业文凭制作#回国入职#diploma#degree
原版美国亚利桑那州立大学毕业证成绩单pdf电子版制作修改#毕业文凭制作#回国入职#diploma#degree原版美国亚利桑那州立大学毕业证成绩单pdf电子版制作修改#毕业文凭制作#回国入职#diploma#degree
原版美国亚利桑那州立大学毕业证成绩单pdf电子版制作修改#毕业文凭制作#回国入职#diploma#degree
 
PORTAFOLIO 2024_ ANASTASIYA KUDINOVA
PORTAFOLIO   2024_  ANASTASIYA  KUDINOVAPORTAFOLIO   2024_  ANASTASIYA  KUDINOVA
PORTAFOLIO 2024_ ANASTASIYA KUDINOVA
 
Top 10 Modern Web Design Trends for 2025
Top 10 Modern Web Design Trends for 2025Top 10 Modern Web Design Trends for 2025
Top 10 Modern Web Design Trends for 2025
 
PORTFOLIO DE ARQUITECTURA CRISTOBAL HERAUD 2024
PORTFOLIO DE ARQUITECTURA CRISTOBAL HERAUD 2024PORTFOLIO DE ARQUITECTURA CRISTOBAL HERAUD 2024
PORTFOLIO DE ARQUITECTURA CRISTOBAL HERAUD 2024
 
Untitled presedddddddddddddddddntation (1).pptx
Untitled presedddddddddddddddddntation (1).pptxUntitled presedddddddddddddddddntation (1).pptx
Untitled presedddddddddddddddddntation (1).pptx
 
Abu Dhabi Call Girls O58993O4O2 Call Girls in Abu Dhabi`
Abu Dhabi Call Girls O58993O4O2 Call Girls in Abu Dhabi`Abu Dhabi Call Girls O58993O4O2 Call Girls in Abu Dhabi`
Abu Dhabi Call Girls O58993O4O2 Call Girls in Abu Dhabi`
 
办理学位证(SFU证书)西蒙菲莎大学毕业证成绩单原版一比一
办理学位证(SFU证书)西蒙菲莎大学毕业证成绩单原版一比一办理学位证(SFU证书)西蒙菲莎大学毕业证成绩单原版一比一
办理学位证(SFU证书)西蒙菲莎大学毕业证成绩单原版一比一
 
Call Girls in Okhla Delhi 💯Call Us 🔝8264348440🔝
Call Girls in Okhla Delhi 💯Call Us 🔝8264348440🔝Call Girls in Okhla Delhi 💯Call Us 🔝8264348440🔝
Call Girls in Okhla Delhi 💯Call Us 🔝8264348440🔝
 
办理(UC毕业证书)查尔斯顿大学毕业证成绩单原版一比一
办理(UC毕业证书)查尔斯顿大学毕业证成绩单原版一比一办理(UC毕业证书)查尔斯顿大学毕业证成绩单原版一比一
办理(UC毕业证书)查尔斯顿大学毕业证成绩单原版一比一
 
办理学位证(NUS证书)新加坡国立大学毕业证成绩单原版一比一
办理学位证(NUS证书)新加坡国立大学毕业证成绩单原版一比一办理学位证(NUS证书)新加坡国立大学毕业证成绩单原版一比一
办理学位证(NUS证书)新加坡国立大学毕业证成绩单原版一比一
 
ARt app | UX Case Study
ARt app | UX Case StudyARt app | UX Case Study
ARt app | UX Case Study
 
Dubai Calls Girl Tapes O525547819 Real Tapes Escort Services Dubai
Dubai Calls Girl Tapes O525547819 Real Tapes Escort Services DubaiDubai Calls Girl Tapes O525547819 Real Tapes Escort Services Dubai
Dubai Calls Girl Tapes O525547819 Real Tapes Escort Services Dubai
 
办理(宾州州立毕业证书)美国宾夕法尼亚州立大学毕业证成绩单原版一比一
办理(宾州州立毕业证书)美国宾夕法尼亚州立大学毕业证成绩单原版一比一办理(宾州州立毕业证书)美国宾夕法尼亚州立大学毕业证成绩单原版一比一
办理(宾州州立毕业证书)美国宾夕法尼亚州立大学毕业证成绩单原版一比一
 
3D Printing And Designing Final Report.pdf
3D Printing And Designing Final Report.pdf3D Printing And Designing Final Report.pdf
3D Printing And Designing Final Report.pdf
 
办理学位证(TheAuckland证书)新西兰奥克兰大学毕业证成绩单原版一比一
办理学位证(TheAuckland证书)新西兰奥克兰大学毕业证成绩单原版一比一办理学位证(TheAuckland证书)新西兰奥克兰大学毕业证成绩单原版一比一
办理学位证(TheAuckland证书)新西兰奥克兰大学毕业证成绩单原版一比一
 
2024新版美国旧金山州立大学毕业证成绩单pdf电子版制作修改#毕业文凭制作#回国入职#diploma#degree
2024新版美国旧金山州立大学毕业证成绩单pdf电子版制作修改#毕业文凭制作#回国入职#diploma#degree2024新版美国旧金山州立大学毕业证成绩单pdf电子版制作修改#毕业文凭制作#回国入职#diploma#degree
2024新版美国旧金山州立大学毕业证成绩单pdf电子版制作修改#毕业文凭制作#回国入职#diploma#degree
 
毕业文凭制作#回国入职#diploma#degree澳洲弗林德斯大学毕业证成绩单pdf电子版制作修改#毕业文凭制作#回国入职#diploma#degree
毕业文凭制作#回国入职#diploma#degree澳洲弗林德斯大学毕业证成绩单pdf电子版制作修改#毕业文凭制作#回国入职#diploma#degree 毕业文凭制作#回国入职#diploma#degree澳洲弗林德斯大学毕业证成绩单pdf电子版制作修改#毕业文凭制作#回国入职#diploma#degree
毕业文凭制作#回国入职#diploma#degree澳洲弗林德斯大学毕业证成绩单pdf电子版制作修改#毕业文凭制作#回国入职#diploma#degree
 
Cosumer Willingness to Pay for Sustainable Bricks
Cosumer Willingness to Pay for Sustainable BricksCosumer Willingness to Pay for Sustainable Bricks
Cosumer Willingness to Pay for Sustainable Bricks
 
Design principles on typography in design
Design principles on typography in designDesign principles on typography in design
Design principles on typography in design
 

5 Creative Ways to Display Data

  • 1. 5 Creative Ways to Display Data In 2013 Your data doesn’t stand still… why should your dashboards? Check out these creative techniques for visualizing data – all available with just a click in Tableau 8!
  • 2. 1 Tree/Bar Combo The bar chart – as classic as a grilled cheese! But what would grilled cheese be without tomato soup? As you can see this viz allows us to compare relative sizes, just like a bar chart, but it also uses a tree map inside the bars to show us more detail. We can see from the bars that Barack Obama raised more money in total. But the colorful tree map shows us the other half of the story: Romney’s average donation was much higher.
  • 3. 2 Bubble Charts Bubble charts are a beautiful way to display comparative information and are especially useful when broken up by a category, as you see here. This viz shows average campaign donations by occupation.Those with averages less than $250 or totals less than $10,000 are filtered out. Clearly, the attorneys went with Obama and the bankers went with Romney! They only have “Vice President” in common.
  • 4. 3 Infographic Style Often, displaying data is about telling a story. Ideally it would be easy to add images, annotations, legends, labels and links to your own stories where appropriate. In Tableau 8, you can create dashboards that allow you to place any object on top of your viz (even another viz!). The result? A clear and concise story that tells itself.
  • 5. Unit Charts Unit charts are a simple way of displaying the relative number or hierarchy of items. Basically, you use colored icons (in this case circles) to show how many of something belong to a category or order. In this viz, we are looking at the fastest cars in the world. They are arranged from fastest to “slowest” from top left to bottom right, with the color of the circle representing their 0-60 time and grouping them with cars of similar speed.
  • 6. 5 Word Cloud You’re right! In most cases there are better ways to display data than a word cloud. For example, they are not fantastic for comparing relative sizes or amounts. But, word clouds can be an excellent way to show the frequency of different words or events. Here you can see words in tweets during the week of #TCC12 - and Beer Week. Beer Week seems to have won this race… we’ll console ourselves with a porter!