Contenu connexe
Similaire à 6,7, 78704, travis heights, bouldin creek, barton hills
Similaire à 6,7, 78704, travis heights, bouldin creek, barton hills (11)
6,7, 78704, travis heights, bouldin creek, barton hills
- 1. Blake Taylor Taylor Real Estate
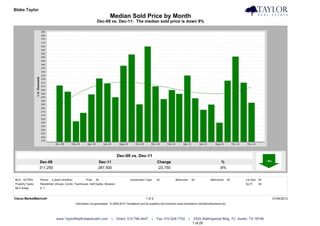
Median Sold Price by Month
Dec-09 vs. Dec-11: The median sold price is down 8%
Dec-09 vs. Dec-11
Dec-09 Dec-11 Change %
311,250 287,500 -23,750 -8%
MLS: ACTRIS Period: 2 years (monthly) Price: All Construction Type: All Bedrooms: All Bathrooms: All Lot Size: All
Property Types: Residential: (House, Condo, Townhouse, Half Duplex, Modular) Sq Ft: All
MLS Areas: 6, 7
Clarus MarketMetrics® 1 of 2 01/04/2012
Information not guaranteed. © 2009-2010 Terradatum and its suppliers and licensors (www.terradatum.com/about/licensors.td).
www.TaylorRealEstateAustin.com | Direct: 512.796.4447 | Fax: 512.628.7720 | 2525 Wallingwood Bldg. 7C Austin, TX 78746
1 of 20
- 2. Blake Taylor Taylor Real Estate
Median Sold Price by Month
Dec-09 vs. Dec-11: The median sold price is down 8%
Time Period Median Price # Units Average DOM
Dec-11 287,500 42 100
Nov-11 315,000 33 71
Oct-11 351,000 32 64
Sep-11 318,000 47 66
Aug-11 260,000 45 55
Jul-11 285,000 59 75
Jun-11 277,817 48 71
May-11 293,606 60 77
Apr-11 325,000 45 49
Mar-11 299,750 38 74
Feb-11 305,000 31 92
Jan-11 292,500 26 75
Dec-10 310,000 38 98
Nov-10 364,950 25 87
Oct-10 285,250 39 123
Sep-10 354,000 37 96
Aug-10 338,500 50 77
Jul-10 295,000 33 57
Jun-10 314,000 64 64
May-10 321,000 64 72
Apr-10 299,045 49 70
Mar-10 273,500 49 72
Feb-10 262,000 31 73
Jan-10 302,750 20 109
Dec-09 311,250 26 92
Clarus MarketMetrics® 2 of 2 01/04/2012
Information not guaranteed. © 2009-2010 Terradatum and its suppliers and licensors (www.terradatum.com/about/licensors.td).
www.TaylorRealEstateAustin.com | Direct: 512.796.4447 | Fax: 512.628.7720 | 2525 Wallingwood Bldg. 7C Austin, TX 78746
2 of 20
- 3. Blake Taylor Taylor Real Estate
Median For Sale vs. Median Sold
Dec-09 vs. Dec-11: The median price of for sale properties is up 8% and the median price of sold properties is down 8%
Dec-09 vs. Dec-11 Dec-09 vs. Dec-11
Dec-09 Dec-11 Change % Dec-09 Dec-11 Change %
325,000 349,950 24,950 +8% 311,250 287,500 -23,750 -8%
MLS: ACTRIS Period: 2 years (monthly) Price: All Construction Type: All Bedrooms: All Bathrooms: All Lot Size: All
Property Types: Residential: (House, Condo, Townhouse, Half Duplex, Modular) Sq Ft: All
MLS Areas: 6, 7
Clarus MarketMetrics® 1 of 2 01/04/2012
Information not guaranteed. © 2009-2010 Terradatum and its suppliers and licensors (www.terradatum.com/about/licensors.td).
www.TaylorRealEstateAustin.com | Direct: 512.796.4447 | Fax: 512.628.7720 | 2525 Wallingwood Bldg. 7C Austin, TX 78746
3 of 20
- 4. Blake Taylor Taylor Real Estate
Median For Sale vs. Median Sold
Dec-09 vs. Dec-11: The median price of for sale properties is up 8% and the median price of sold properties is down 8%
For Sale # Properties Sold # Properties Price
Time Period Median For Sale Median Sold Difference
Dec-11 349,950 206 287,500 42 -62,450
Nov-11 365,000 246 315,000 33 -50,000
Oct-11 365,000 260 351,000 32 -14,000
Sep-11 358,500 277 318,000 47 -40,500
Aug-11 349,000 315 260,000 45 -89,000
Jul-11 308,500 350 285,000 59 -23,500
Jun-11 320,000 355 277,817 48 -42,183
May-11 299,000 359 293,606 60 -5,395
Apr-11 315,000 341 325,000 45 10,000
Mar-11 315,000 335 299,750 38 -15,250
Feb-11 324,900 299 305,000 31 -19,900
Jan-11 320,000 295 292,500 26 -27,500
Dec-10 302,555 292 310,000 38 7,445
Nov-10 319,925 324 364,950 25 45,025
Oct-10 314,748 356 285,250 39 -29,498
Sep-10 317,000 381 354,000 37 37,000
Aug-10 319,000 431 338,500 50 19,500
Jul-10 319,400 449 295,000 33 -24,400
Jun-10 320,000 454 314,000 64 -6,000
May-10 324,900 441 321,000 64 -3,900
Apr-10 315,000 488 299,045 49 -15,955
Mar-10 317,000 462 273,500 49 -43,500
Feb-10 315,000 377 262,000 31 -53,000
Jan-10 319,000 362 302,750 20 -16,250
Dec-09 325,000 372 311,250 26 -13,750
Clarus MarketMetrics® 2 of 2 01/04/2012
Information not guaranteed. © 2009-2010 Terradatum and its suppliers and licensors (www.terradatum.com/about/licensors.td).
www.TaylorRealEstateAustin.com | Direct: 512.796.4447 | Fax: 512.628.7720 | 2525 Wallingwood Bldg. 7C Austin, TX 78746
4 of 20
- 5. Blake Taylor Taylor Real Estate
Sold Properties by Month
Dec-09 vs. Dec-11: The number of Sold properties is up 62%
Dec-09 vs. Dec-11
Dec-09 Dec-11 Change %
26 42 16 +62%
MLS: ACTRIS Period: 2 years (monthly) Price: All Construction Type: All Bedrooms: All Bathrooms: All Lot Size: All
Property Types: Residential: (House, Condo, Townhouse, Half Duplex, Modular) Sq Ft: All
MLS Areas: 6, 7
Clarus MarketMetrics® 1 of 2 01/04/2012
Information not guaranteed. © 2009-2010 Terradatum and its suppliers and licensors (www.terradatum.com/about/licensors.td).
www.TaylorRealEstateAustin.com | Direct: 512.796.4447 | Fax: 512.628.7720 | 2525 Wallingwood Bldg. 7C Austin, TX 78746
5 of 20
- 6. Blake Taylor Taylor Real Estate
Sold Properties by Month
Dec-09 vs. Dec-11: The number of Sold properties is up 62%
Full Market Bank Properties Non-Bank Properties
Time Period # Properties Median Price Average DOM # Properties % Bank Median Price # Properties % Non-Bank Median Price
Dec-11 42 287,500 100 3 7.1 285,000 39 92.9 305,000
Nov-11 33 315,000 71 2 6.1 119,500 31 93.9 320,149
Oct-11 32 351,000 64 1 3.1 108,500 31 96.9 355,000
Sep-11 47 318,000 66 3 6.4 94,936 44 93.6 327,500
Aug-11 45 260,000 55 3 6.7 55,000 42 93.3 261,950
Jul-11 59 285,000 75 0 59 100.0 285,000
Jun-11 48 277,817 71 3 6.2 148,000 45 93.8 289,500
May-11 60 293,606 77 3 5.0 79,000 57 95.0 298,182
Apr-11 45 325,000 49 3 6.7 133,900 42 93.3 330,000
Mar-11 38 299,750 74 4 10.5 94,088 34 89.5 304,745
Feb-11 31 305,000 92 5 16.1 56,100 26 83.9 331,000
Jan-11 26 292,500 75 4 15.4 78,568 22 84.6 317,450
Dec-10 38 310,000 98 5 13.2 250,000 33 86.8 315,000
Nov-10 25 364,950 87 4 16.0 367,750 21 84.0 364,950
Oct-10 39 285,250 123 2 5.1 186,500 37 94.9 287,000
Sep-10 37 354,000 96 0 37 100.0 354,000
Aug-10 50 338,500 77 5 10.0 325,000 45 90.0 345,000
Jul-10 33 295,000 57 4 12.1 133,000 29 87.9 295,000
Jun-10 64 314,000 64 5 7.8 323,000 59 92.2 313,000
May-10 64 321,000 72 10 15.6 339,500 54 84.4 313,120
Apr-10 49 299,045 70 7 14.3 397,640 42 85.7 291,088
Mar-10 49 273,500 72 3 6.1 162,000 46 93.9 276,150
Feb-10 31 262,000 73 2 6.5 57,750 29 93.5 269,900
Jan-10 20 302,750 109 1 5.0 415,000 19 95.0 295,500
Dec-09 26 311,250 92 4 15.4 221,500 22 84.6 331,250
Clarus MarketMetrics® 2 of 2 01/04/2012
Information not guaranteed. © 2009-2010 Terradatum and its suppliers and licensors (www.terradatum.com/about/licensors.td).
www.TaylorRealEstateAustin.com | Direct: 512.796.4447 | Fax: 512.628.7720 | 2525 Wallingwood Bldg. 7C Austin, TX 78746
6 of 20
- 7. Blake Taylor Taylor Real Estate
Under Contract Properties by Month
Dec-09 vs. Dec-11: The number of Under Contract properties is up 54%
Dec-09 vs. Dec-11
Dec-09 Dec-11 Change %
26 40 14 +54%
MLS: ACTRIS Period: 2 years (monthly) Price: All Construction Type: All Bedrooms: All Bathrooms: All Lot Size: All
Property Types: Residential: (House, Condo, Townhouse, Half Duplex, Modular) Sq Ft: All
MLS Areas: 6, 7
Clarus MarketMetrics® 1 of 2 01/04/2012
Information not guaranteed. © 2009-2010 Terradatum and its suppliers and licensors (www.terradatum.com/about/licensors.td).
www.TaylorRealEstateAustin.com | Direct: 512.796.4447 | Fax: 512.628.7720 | 2525 Wallingwood Bldg. 7C Austin, TX 78746
7 of 20
- 8. Blake Taylor Taylor Real Estate
Under Contract Properties by Month
Dec-09 vs. Dec-11: The number of Under Contract properties is up 54%
Full Market Bank Properties Non-Bank Properties
Time Period # Properties Median Price Average DOM # Properties % Bank Median Price # Properties % Non-Bank Median Price
Dec-11 40 325,990 92 3 7.5 379,900 37 92.5 325,990
Nov-11 32 283,000 83 3 9.4 475,000 29 90.6 279,000
Oct-11 41 399,900 83 1 2.4 108,500 40 97.6 399,950
Sep-11 28 329,950 57 0 28 100.0 329,950
Aug-11 60 284,925 58 6 10.0 94,200 54 90.0 304,495
Jul-11 56 246,850 63 2 3.6 166,600 54 96.4 246,850
Jun-11 49 295,000 76 0 49 100.0 295,000
May-11 48 324,925 73 3 6.2 152,500 45 93.8 340,000
Apr-11 48 317,000 55 2 4.2 60,825 46 95.8 321,950
Mar-11 56 310,055 61 3 5.4 139,900 53 94.6 320,000
Feb-11 40 311,994 83 4 10.0 162,450 36 90.0 325,000
Jan-11 33 239,000 68 5 15.2 83,000 28 84.8 304,000
Dec-10 26 349,900 87 3 11.5 49,900 23 88.5 349,900
Nov-10 33 315,000 92 5 15.2 155,000 28 84.8 381,000
Oct-10 35 305,000 106 5 14.3 259,900 30 85.7 322,000
Sep-10 35 325,000 135 2 5.7 427,450 33 94.3 325,000
Aug-10 43 345,000 94 2 4.7 195,950 41 95.3 369,000
Jul-10 37 339,550 69 4 10.8 229,900 33 89.2 339,550
Jun-10 39 348,000 59 2 5.1 365,500 37 94.9 325,000
May-10 38 322,150 63 3 7.9 154,900 35 92.1 324,900
Apr-10 83 300,000 49 9 10.8 323,000 74 89.2 299,500
Mar-10 66 326,450 79 12 18.2 353,450 54 81.8 307,250
Feb-10 42 284,190 81 2 4.8 352,450 40 95.2 284,190
Jan-10 31 292,990 76 3 9.7 73,900 28 90.3 319,000
Dec-09 26 299,925 115 2 7.7 290,900 24 92.3 299,925
Clarus MarketMetrics® 2 of 2 01/04/2012
Information not guaranteed. © 2009-2010 Terradatum and its suppliers and licensors (www.terradatum.com/about/licensors.td).
www.TaylorRealEstateAustin.com | Direct: 512.796.4447 | Fax: 512.628.7720 | 2525 Wallingwood Bldg. 7C Austin, TX 78746
8 of 20
- 9. Blake Taylor Taylor Real Estate
New Properties by Month
Dec-09 vs. Dec-11: The number of New properties is down 29%
Dec-09 vs. Dec-11
Dec-09 Dec-11 Change %
41 29 -12 -29%
MLS: ACTRIS Period: 2 years (monthly) Price: All Construction Type: All Bedrooms: All Bathrooms: All Lot Size: All
Property Types: Residential: (House, Condo, Townhouse, Half Duplex, Modular) Sq Ft: All
MLS Areas: 6, 7
Clarus MarketMetrics® 1 of 2 01/04/2012
Information not guaranteed. © 2009-2010 Terradatum and its suppliers and licensors (www.terradatum.com/about/licensors.td).
www.TaylorRealEstateAustin.com | Direct: 512.796.4447 | Fax: 512.628.7720 | 2525 Wallingwood Bldg. 7C Austin, TX 78746
9 of 20
- 10. Blake Taylor Taylor Real Estate
New Properties by Month
Dec-09 vs. Dec-11: The number of New properties is down 29%
Full Market Bank Properties Non-Bank Properties
Time Period # Properties Median Price # Properties % Bank Median Price # Properties % Non-Bank Median Price
Dec-11 29 200,000 3 10.3 350,000 26 89.7 199,950
Nov-11 52 346,722 1 1.9 555,000 51 98.1 345,945
Oct-11 51 349,000 4 7.8 427,450 47 92.2 339,000
Sep-11 55 341,900 2 3.6 134,700 53 96.4 364,900
Aug-11 63 325,000 4 6.3 240,000 59 93.7 325,000
Jul-11 76 269,950 4 5.3 142,400 72 94.7 287,495
Jun-11 88 329,450 4 4.5 324,950 84 95.5 329,450
May-11 83 295,000 1 1.2 29,900 82 98.8 304,500
Apr-11 91 320,000 4 4.4 72,875 87 95.6 349,900
Mar-11 106 299,000 4 3.8 169,900 102 96.2 307,000
Feb-11 75 300,000 4 5.3 452,400 71 94.7 297,600
Jan-11 79 372,400 6 7.6 232,400 73 92.4 390,000
Dec-10 46 227,250 5 10.9 120,000 41 89.1 269,900
Nov-10 48 337,750 5 10.4 97,000 43 89.6 359,000
Oct-10 63 289,900 4 6.3 337,450 59 93.7 289,900
Sep-10 57 317,000 6 10.5 99,900 51 89.5 337,500
Aug-10 67 324,900 5 7.5 155,000 62 92.5 327,000
Jul-10 93 289,900 3 3.2 83,000 90 96.8 299,900
Jun-10 106 293,200 2 1.9 194,900 104 98.1 293,200
May-10 70 324,550 3 4.3 131,600 67 95.7 339,000
Apr-10 134 299,900 7 5.2 144,900 127 94.8 312,000
Mar-10 154 299,950 6 3.9 227,400 148 96.1 299,950
Feb-10 90 324,000 7 7.8 365,000 83 92.2 300,000
Jan-10 92 304,500 10 10.9 286,450 82 89.1 310,750
Dec-09 41 279,000 12 29.3 278,950 29 70.7 279,000
Clarus MarketMetrics® 2 of 2 01/04/2012
Information not guaranteed. © 2009-2010 Terradatum and its suppliers and licensors (www.terradatum.com/about/licensors.td).
www.TaylorRealEstateAustin.com | Direct: 512.796.4447 | Fax: 512.628.7720 | 2525 Wallingwood Bldg. 7C Austin, TX 78746
10 of 20
- 11. Blake Taylor Taylor Real Estate
For Sale Properties by Month
Dec-09 vs. Dec-11: The number of For Sale properties is down 45%
Dec-09 vs. Dec-11
Dec-09 Dec-11 Change %
372 206 -166 -45%
MLS: ACTRIS Period: 2 years (monthly) Price: All Construction Type: All Bedrooms: All Bathrooms: All Lot Size: All
Property Types: Residential: (House, Condo, Townhouse, Half Duplex, Modular) Sq Ft: All
MLS Areas: 6, 7
Clarus MarketMetrics® 1 of 2 01/04/2012
Information not guaranteed. © 2009-2010 Terradatum and its suppliers and licensors (www.terradatum.com/about/licensors.td).
www.TaylorRealEstateAustin.com | Direct: 512.796.4447 | Fax: 512.628.7720 | 2525 Wallingwood Bldg. 7C Austin, TX 78746
11 of 20
- 12. Blake Taylor Taylor Real Estate
For Sale Properties by Month
Dec-09 vs. Dec-11: The number of For Sale properties is down 45%
Full Market Bank Properties Non-Bank Properties
Time Period # Properties Median Price Average DOM # Properties % Bank Median Price # Properties % Non-Bank Median Price
Dec-11 206 349,950 137 8 3.9 403,950 198 96.1 349,000
Nov-11 246 365,000 124 10 4.1 451,500 236 95.9 358,750
Oct-11 260 365,000 120 10 3.9 403,950 250 96.2 364,950
Sep-11 277 358,500 116 8 2.9 279,900 269 97.1 358,500
Aug-11 315 349,000 106 13 4.1 179,900 302 95.9 349,400
Jul-11 350 308,500 98 13 3.7 184,900 337 96.3 310,000
Jun-11 355 320,000 96 10 2.8 244,950 345 97.2 320,000
May-11 359 299,000 99 11 3.1 184,900 348 96.9 299,500
Apr-11 341 315,000 94 13 3.8 154,900 328 96.2 318,248
Mar-11 335 315,000 95 14 4.2 197,400 321 95.8 320,000
Feb-11 299 324,900 108 14 4.7 204,950 285 95.3 325,000
Jan-11 295 320,000 129 18 6.1 171,200 277 93.9 335,000
Dec-10 292 302,555 144 16 5.5 108,500 276 94.5 318,698
Nov-10 324 319,925 134 17 5.2 131,600 307 94.8 325,000
Oct-10 356 314,748 125 19 5.3 155,000 337 94.7 319,900
Sep-10 381 317,000 125 19 5.0 150,000 362 95.0 324,950
Aug-10 431 319,000 116 17 3.9 200,000 414 96.1 322,000
Jul-10 449 319,400 105 17 3.8 259,900 432 96.2 319,950
Jun-10 454 320,000 104 17 3.7 275,000 437 96.3 324,100
May-10 441 324,900 108 18 4.1 267,450 423 95.9 325,000
Apr-10 488 315,000 93 26 5.3 284,000 462 94.7 316,000
Mar-10 462 317,000 99 33 7.1 324,900 429 92.9 315,000
Feb-10 377 315,000 112 30 8.0 352,950 347 92.0 313,500
Jan-10 362 319,000 122 27 7.5 279,900 335 92.5 322,000
Dec-09 372 325,000 142 22 5.9 226,700 350 94.1 329,100
Clarus MarketMetrics® 2 of 2 01/04/2012
Information not guaranteed. © 2009-2010 Terradatum and its suppliers and licensors (www.terradatum.com/about/licensors.td).
www.TaylorRealEstateAustin.com | Direct: 512.796.4447 | Fax: 512.628.7720 | 2525 Wallingwood Bldg. 7C Austin, TX 78746
12 of 20
- 13. Blake Taylor Taylor Real Estate
Expired Properties by Month
Dec-09 vs. Dec-11: The number of Expired properties is down 55%
Dec-09 vs. Dec-11
Dec-09 Dec-11 Change %
76 34 -42 -55%
MLS: ACTRIS Period: 2 years (monthly) Price: All Construction Type: All Bedrooms: All Bathrooms: All Lot Size: All
Property Types: Residential: (House, Condo, Townhouse, Half Duplex, Modular) Sq Ft: All
MLS Areas: 6, 7
Clarus MarketMetrics® 1 of 2 01/04/2012
Information not guaranteed. © 2009-2010 Terradatum and its suppliers and licensors (www.terradatum.com/about/licensors.td).
www.TaylorRealEstateAustin.com | Direct: 512.796.4447 | Fax: 512.628.7720 | 2525 Wallingwood Bldg. 7C Austin, TX 78746
13 of 20
- 14. Blake Taylor Taylor Real Estate
Expired Properties by Month
Dec-09 vs. Dec-11: The number of Expired properties is down 55%
Full Market Bank Properties Non-Bank Properties
Time Period # Properties Median Price Average DOM # Properties % Bank Median Price # Properties % Non-Bank Median Price
Dec-11 34 354,250 102 1 2.9 350,000 33 97.1 358,500
Nov-11 37 425,000 111 2 5.4 347,500 35 94.6 425,000
Oct-11 25 325,000 119 0 25 100.0 325,000
Sep-11 40 284,950 121 2 5.0 279,900 38 95.0 284,950
Aug-11 33 336,900 122 1 3.0 374,900 32 97.0 332,450
Jul-11 42 294,500 98 2 4.8 287,450 40 95.2 294,500
Jun-11 32 311,950 107 1 3.1 209,900 31 96.9 324,900
May-11 44 279,675 133 2 4.5 452,400 42 95.5 277,000
Apr-11 17 399,000 117 1 5.9 152,500 16 94.1 414,000
Mar-11 29 359,000 138 2 6.9 187,500 27 93.1 359,525
Feb-11 30 323,200 145 0 30 100.0 323,200
Jan-11 38 322,450 232 3 7.9 260,000 35 92.1 339,000
Dec-10 50 322,425 152 1 2.0 189,900 49 98.0 324,900
Nov-10 45 320,000 116 1 2.2 150,000 44 97.8 322,000
Oct-10 45 299,900 108 2 4.4 197,400 43 95.6 299,900
Sep-10 53 259,000 119 2 3.8 204,950 51 96.2 259,000
Aug-10 64 292,000 106 2 3.1 234,900 62 96.9 292,000
Jul-10 48 309,450 107 1 2.1 259,900 47 97.9 319,000
Jun-10 59 287,000 142 1 1.7 84,900 58 98.3 293,450
May-10 55 249,950 150 0 55 100.0 249,950
Apr-10 34 273,450 124 2 5.9 114,450 32 94.1 279,950
Mar-10 42 279,900 138 2 4.8 349,450 40 95.2 277,450
Feb-10 27 300,000 116 1 3.7 464,900 26 96.3 290,000
Jan-10 44 349,200 163 1 2.3 134,900 43 97.7 349,900
Dec-09 76 354,000 168 3 4.0 165,900 73 96.0 359,950
Clarus MarketMetrics® 2 of 2 01/04/2012
Information not guaranteed. © 2009-2010 Terradatum and its suppliers and licensors (www.terradatum.com/about/licensors.td).
www.TaylorRealEstateAustin.com | Direct: 512.796.4447 | Fax: 512.628.7720 | 2525 Wallingwood Bldg. 7C Austin, TX 78746
14 of 20
- 15. Blake Taylor Taylor Real Estate
Supply & Demand by Month
Dec-09 vs. Dec-11: The number of for sale properties is down 45% and the number of sold properties is up 62%
Dec-09 vs. Dec-11 Dec-09 vs. Dec-11
Dec-09 Dec-11 Change % Dec-09 Dec-11 Change %
372 206 -166 -45% 26 42 16 +62%
MLS: ACTRIS Period: 2 years (monthly) Price: All Construction Type: All Bedrooms: All Bathrooms: All Lot Size: All
Property Types: Residential: (House, Condo, Townhouse, Half Duplex, Modular) Sq Ft: All
MLS Areas: 6, 7
Clarus MarketMetrics® 1 of 2 01/04/2012
Information not guaranteed. © 2009-2010 Terradatum and its suppliers and licensors (www.terradatum.com/about/licensors.td).
www.TaylorRealEstateAustin.com | Direct: 512.796.4447 | Fax: 512.628.7720 | 2525 Wallingwood Bldg. 7C Austin, TX 78746
15 of 20
- 16. Blake Taylor Taylor Real Estate
Supply & Demand by Month
Dec-09 vs. Dec-11: The number of for sale properties is down 45% and the number of sold properties is up 62%
# Properties Average DOM # Properties Average DOM
Time Period For Sale For Sale Sold Sold
Dec-11 206 137 42 100
Nov-11 246 124 33 71
Oct-11 260 120 32 64
Sep-11 277 116 47 66
Aug-11 315 106 45 55
Jul-11 350 98 59 75
Jun-11 355 96 48 71
May-11 359 99 60 77
Apr-11 341 94 45 49
Mar-11 335 95 38 74
Feb-11 299 108 31 92
Jan-11 295 129 26 75
Dec-10 292 144 38 98
Nov-10 324 134 25 87
Oct-10 356 125 39 123
Sep-10 381 125 37 96
Aug-10 431 116 50 77
Jul-10 449 105 33 57
Jun-10 454 104 64 64
May-10 441 108 64 72
Apr-10 488 93 49 70
Mar-10 462 99 49 72
Feb-10 377 112 31 73
Jan-10 362 122 20 109
Dec-09 372 142 26 92
Clarus MarketMetrics® 2 of 2 01/04/2012
Information not guaranteed. © 2009-2010 Terradatum and its suppliers and licensors (www.terradatum.com/about/licensors.td).
www.TaylorRealEstateAustin.com | Direct: 512.796.4447 | Fax: 512.628.7720 | 2525 Wallingwood Bldg. 7C Austin, TX 78746
16 of 20
- 17. Blake Taylor Taylor Real Estate
The Average Days on Market by Month
Dec-09 vs. Dec-11: The average days on market is down 20%
Dec-09 vs. Dec-11
Dec-09 Dec-11 Change %
115 92 -23 -20%
MLS: ACTRIS Period: 2 years (monthly) Price: All Construction Type: All Bedrooms: All Bathrooms: All Lot Size: All
Property Types: Residential: (House, Condo, Townhouse, Half Duplex, Modular) Sq Ft: All
MLS Areas: 6, 7
Clarus MarketMetrics® 1 of 2 01/04/2012
Information not guaranteed. © 2009-2010 Terradatum and its suppliers and licensors (www.terradatum.com/about/licensors.td).
www.TaylorRealEstateAustin.com | Direct: 512.796.4447 | Fax: 512.628.7720 | 2525 Wallingwood Bldg. 7C Austin, TX 78746
17 of 20
- 18. Blake Taylor Taylor Real Estate
The Average Days on Market by Month
Dec-09 vs. Dec-11: The average days on market is down 20%
Time Period Average DOM # UC Units
Dec-11 92 40
Nov-11 83 32
Oct-11 83 41
Sep-11 57 28
Aug-11 58 60
Jul-11 63 56
Jun-11 76 49
May-11 73 48
Apr-11 55 48
Mar-11 61 56
Feb-11 83 40
Jan-11 68 33
Dec-10 87 26
Nov-10 92 33
Oct-10 106 35
Sep-10 135 35
Aug-10 94 43
Jul-10 69 37
Jun-10 59 39
May-10 63 38
Apr-10 49 83
Mar-10 79 66
Feb-10 81 42
Jan-10 76 31
Dec-09 115 26
Clarus MarketMetrics® 2 of 2 01/04/2012
Information not guaranteed. © 2009-2010 Terradatum and its suppliers and licensors (www.terradatum.com/about/licensors.td).
www.TaylorRealEstateAustin.com | Direct: 512.796.4447 | Fax: 512.628.7720 | 2525 Wallingwood Bldg. 7C Austin, TX 78746
18 of 20
- 19. Blake Taylor Taylor Real Estate
Months Supply of Inventory
Dec-09 vs. Dec-11: The average months supply of inventory is down 68%
Dec-09 vs. Dec-11
Dec-09 Dec-11 Change %
10.4 3.3 -7.1 -68%
MLS: ACTRIS Period: 2 years (monthly) Price: All Construction Type: All Bedrooms: All Bathrooms: All Lot Size: All
Property Types: Residential: (House, Condo, Townhouse, Half Duplex, Modular) Sq Ft: All
MLS Areas: 6, 7
Clarus MarketMetrics® 1 of 2 01/04/2012
Information not guaranteed. © 2009-2010 Terradatum and its suppliers and licensors (www.terradatum.com/about/licensors.td).
www.TaylorRealEstateAustin.com | Direct: 512.796.4447 | Fax: 512.628.7720 | 2525 Wallingwood Bldg. 7C Austin, TX 78746
19 of 20
- 20. Blake Taylor Taylor Real Estate
Months Supply of Inventory
Dec-09 vs. Dec-11: The average months supply of inventory is down 68%
# Units For Sale # UC Units UC Average
Time Period Last Day of Month During Month MSI DOM
Dec-11 132 40 3.3 92
Nov-11 177 32 5.5 83
Oct-11 194 41 4.7 83
Sep-11 209 28 7.5 57
Aug-11 222 60 3.7 58
Jul-11 252 56 4.5 63
Jun-11 274 49 5.6 76
May-11 267 48 5.6 73
Apr-11 276 48 5.8 55
Mar-11 250 56 4.5 61
Feb-11 229 40 5.7 83
Jan-11 224 33 6.8 68
Dec-10 216 26 8.3 87
Nov-10 246 33 7.5 92
Oct-10 276 35 7.9 106
Sep-10 293 35 8.4 135
Aug-10 324 43 7.5 94
Jul-10 364 37 9.8 69
Jun-10 356 39 9.1 59
May-10 348 38 9.2 63
Apr-10 371 83 4.5 49
Mar-10 354 66 5.4 79
Feb-10 308 42 7.3 81
Jan-10 287 31 9.3 76
Dec-09 270 26 10.4 115
Clarus MarketMetrics® 2 of 2 01/04/2012
Information not guaranteed. © 2009-2010 Terradatum and its suppliers and licensors (www.terradatum.com/about/licensors.td).
www.TaylorRealEstateAustin.com | Direct: 512.796.4447 | Fax: 512.628.7720 | 2525 Wallingwood Bldg. 7C Austin, TX 78746
20 of 20