Contenu connexe
Similaire à Area 5 east austin
Similaire à Area 5 east austin (20)
Plus de Taylor Real Estate
6,7, 78704, travis heights, bouldin creek, barton hills6,7, 78704, travis heights, bouldin creek, barton hillsTaylor Real Estate
Plus de Taylor Real Estate (8)
Area 5 east austin
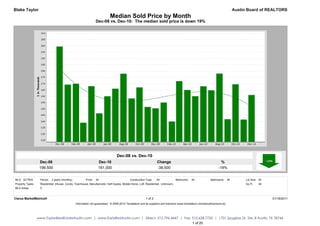
- 1. Blake Taylor Austin Board of REALTORS
Median Sold Price by Month
Dec-08 vs. Dec-10: The median sold price is down 19%
Dec-08 vs. Dec-10
Dec-08 Dec-10 Change %
199,500 161,000 -38,500 -19%
MLS: ACTRIS Period: 2 years (monthly) Price: All Construction Type: All Bedrooms: All Bathrooms: All Lot Size: All
Property Types: Residential: (House, Condo, Townhouse, Manufactured, Half Duplex, Mobile Home, Loft, Residential - Unknown) Sq Ft: All
MLS Areas: 5
Clarus MarketMetrics® 1 of 2 01/18/2011
Information not guaranteed. © 2009-2010 Terradatum and its suppliers and licensors (www.terradatum.com/about/licensors.td).
www.TaylorRealEstateAustin.com | www.EarlyBirdAustin.com | Direct: 512.796.4447 | Fax: 512.628.7720 | 1701 Spyglass Dr. Ste. 8 Austin, TX 78746
1 of 20
- 2. Blake Taylor Austin Board of REALTORS
Median Sold Price by Month
Dec-08 vs. Dec-10: The median sold price is down 19%
Time Period Median Price # Units Average DOM
Dec-10 161,000 19 83
Nov-10 141,500 16 96
Oct-10 169,500 13 129
Sep-10 141,750 18 103
Aug-10 178,000 21 87
Jul-10 164,725 26 124
Jun-10 167,900 33 88
May-10 160,000 35 36
Apr-10 165,000 29 96
Mar-10 172,000 43 67
Feb-10 139,950 22 82
Jan-10 155,000 19 68
Dec-09 150,455 26 88
Nov-09 151,500 34 67
Oct-09 167,000 36 54
Sep-09 158,250 24 77
Aug-09 177,875 16 75
Jul-09 166,000 40 76
Jun-09 159,900 23 61
May-09 146,400 25 52
Apr-09 168,000 27 68
Mar-09 139,000 15 84
Feb-09 169,900 15 63
Jan-09 169,225 16 93
Dec-08 199,500 12 105
Clarus MarketMetrics® 2 of 2 01/18/2011
Information not guaranteed. © 2009-2010 Terradatum and its suppliers and licensors (www.terradatum.com/about/licensors.td).
www.TaylorRealEstateAustin.com | www.EarlyBirdAustin.com | Direct: 512.796.4447 | Fax: 512.628.7720 | 1701 Spyglass Dr. Ste. 8 Austin, TX 78746
2 of 20
- 3. Blake Taylor Austin Board of REALTORS
Median For Sale vs. Median Sold
Dec-08 vs. Dec-10: The median price of for sale properties is down 7% and the median price of sold properties is down 19%
Dec-08 vs. Dec-10 Dec-08 vs. Dec-10
Dec-08 Dec-10 Change % Dec-08 Dec-10 Change %
199,941 184,950 -14,991 -7% 199,500 161,000 -38,500 -19%
MLS: ACTRIS Period: 2 years (monthly) Price: All Construction Type: All Bedrooms: All Bathrooms: All Lot Size: All
Property Types: Residential: (House, Condo, Townhouse, Manufactured, Half Duplex, Mobile Home, Loft, Residential - Unknown) Sq Ft: All
MLS Areas: 5
Clarus MarketMetrics® 1 of 2 01/18/2011
Information not guaranteed. © 2009-2010 Terradatum and its suppliers and licensors (www.terradatum.com/about/licensors.td).
www.TaylorRealEstateAustin.com | www.EarlyBirdAustin.com | Direct: 512.796.4447 | Fax: 512.628.7720 | 1701 Spyglass Dr. Ste. 8 Austin, TX 78746
3 of 20
- 4. Blake Taylor Austin Board of REALTORS
Median For Sale vs. Median Sold
Dec-08 vs. Dec-10: The median price of for sale properties is down 7% and the median price of sold properties is down 19%
For Sale # Properties Sold # Properties Price
Time Period Median For Sale Median Sold Difference
Dec-10 184,950 240 161,000 19 -23,950
Nov-10 179,975 266 141,500 16 -38,475
Oct-10 180,000 284 169,500 13 -10,500
Sep-10 189,000 278 141,750 18 -47,250
Aug-10 188,500 292 178,000 21 -10,500
Jul-10 189,000 311 164,725 26 -24,275
Jun-10 188,000 321 167,900 33 -20,100
May-10 184,950 314 160,000 35 -24,950
Apr-10 189,900 335 165,000 29 -24,900
Mar-10 189,900 300 172,000 43 -17,900
Feb-10 189,700 284 139,950 22 -49,750
Jan-10 199,900 279 155,000 19 -44,900
Dec-09 199,000 273 150,455 26 -48,545
Nov-09 199,000 301 151,500 34 -47,500
Oct-09 191,500 313 167,000 36 -24,500
Sep-09 191,500 321 158,250 24 -33,250
Aug-09 198,875 300 177,875 16 -21,000
Jul-09 215,000 285 166,000 40 -49,000
Jun-09 219,900 285 159,900 23 -60,000
May-09 219,900 272 146,400 25 -73,500
Apr-09 198,875 288 168,000 27 -30,875
Mar-09 198,375 302 139,000 15 -59,375
Feb-09 198,375 296 169,900 15 -28,475
Jan-09 215,000 301 169,225 16 -45,775
Dec-08 199,941 312 199,500 12 -441
Clarus MarketMetrics® 2 of 2 01/18/2011
Information not guaranteed. © 2009-2010 Terradatum and its suppliers and licensors (www.terradatum.com/about/licensors.td).
www.TaylorRealEstateAustin.com | www.EarlyBirdAustin.com | Direct: 512.796.4447 | Fax: 512.628.7720 | 1701 Spyglass Dr. Ste. 8 Austin, TX 78746
4 of 20
- 5. Blake Taylor Austin Board of REALTORS
Sold Properties by Month
Dec-08 vs. Dec-10: The number of Sold properties is up 58%
Dec-08 vs. Dec-10
Dec-08 Dec-10 Change %
12 19 7 +58%
MLS: ACTRIS Period: 2 years (monthly) Price: All Construction Type: All Bedrooms: All Bathrooms: All Lot Size: All
Property Types: Residential: (House, Condo, Townhouse, Manufactured, Half Duplex, Mobile Home, Loft, Residential - Unknown) Sq Ft: All
MLS Areas: 5
Clarus MarketMetrics® 1 of 2 01/18/2011
Information not guaranteed. © 2009-2010 Terradatum and its suppliers and licensors (www.terradatum.com/about/licensors.td).
www.TaylorRealEstateAustin.com | www.EarlyBirdAustin.com | Direct: 512.796.4447 | Fax: 512.628.7720 | 1701 Spyglass Dr. Ste. 8 Austin, TX 78746
5 of 20
- 6. Blake Taylor Austin Board of REALTORS
Sold Properties by Month
Dec-08 vs. Dec-10: The number of Sold properties is up 58%
Full Market Bank Properties Non-Bank Properties
Time Period # Properties Median Price Average DOM # Properties % Bank Median Price # Properties % Non-Bank Median Price
Dec-10 19 161,000 83 5 26.3 152,000 14 73.7 164,500
Nov-10 16 141,500 96 3 18.8 105,000 13 81.2 199,000
Oct-10 13 169,500 129 1 7.7 77,777 12 92.3 179,750
Sep-10 18 141,750 103 2 11.1 92,375 16 88.9 148,000
Aug-10 21 178,000 87 3 14.3 157,000 18 85.7 193,000
Jul-10 26 164,725 124 4 15.4 94,125 22 84.6 171,975
Jun-10 33 167,900 88 3 9.1 77,500 30 90.9 174,950
May-10 35 160,000 36 3 8.6 135,000 32 91.4 160,000
Apr-10 29 165,000 96 1 3.5 170,000 28 96.5 165,000
Mar-10 43 172,000 67 7 16.3 65,000 36 83.7 182,500
Feb-10 22 139,950 82 3 13.6 72,500 19 86.4 154,500
Jan-10 19 155,000 68 0 19 100.0 155,000
Dec-09 26 150,455 88 7 26.9 103,000 19 73.1 167,500
Nov-09 34 151,500 67 1 2.9 292,000 33 97.1 151,000
Oct-09 36 167,000 54 4 11.1 167,000 32 88.9 166,500
Sep-09 24 158,250 77 2 8.3 174,925 22 91.7 155,000
Aug-09 16 177,875 75 1 6.2 181,750 15 93.8 174,000
Jul-09 40 166,000 76 2 5.0 54,000 38 95.0 169,000
Jun-09 23 159,900 61 1 4.3 179,000 22 95.7 157,450
May-09 25 146,400 52 4 16.0 138,200 21 84.0 154,000
Apr-09 27 168,000 68 2 7.4 77,100 25 92.6 171,000
Mar-09 15 139,000 84 4 26.7 121,750 11 73.3 155,000
Feb-09 15 169,900 63 2 13.3 107,700 13 86.7 183,125
Jan-09 16 169,225 93 2 12.5 96,250 14 87.5 190,835
Dec-08 12 199,500 105 0 12 100.0 199,500
Clarus MarketMetrics® 2 of 2 01/18/2011
Information not guaranteed. © 2009-2010 Terradatum and its suppliers and licensors (www.terradatum.com/about/licensors.td).
www.TaylorRealEstateAustin.com | www.EarlyBirdAustin.com | Direct: 512.796.4447 | Fax: 512.628.7720 | 1701 Spyglass Dr. Ste. 8 Austin, TX 78746
6 of 20
- 7. Blake Taylor Austin Board of REALTORS
Under Contract Properties by Month
Dec-08 vs. Dec-10: The number of Under Contract properties is down 55%
Dec-08 vs. Dec-10
Dec-08 Dec-10 Change %
20 9 -11 -55%
MLS: ACTRIS Period: 2 years (monthly) Price: All Construction Type: All Bedrooms: All Bathrooms: All Lot Size: All
Property Types: Residential: (House, Condo, Townhouse, Manufactured, Half Duplex, Mobile Home, Loft, Residential - Unknown) Sq Ft: All
MLS Areas: 5
Clarus MarketMetrics® 1 of 2 01/18/2011
Information not guaranteed. © 2009-2010 Terradatum and its suppliers and licensors (www.terradatum.com/about/licensors.td).
www.TaylorRealEstateAustin.com | www.EarlyBirdAustin.com | Direct: 512.796.4447 | Fax: 512.628.7720 | 1701 Spyglass Dr. Ste. 8 Austin, TX 78746
7 of 20
- 8. Blake Taylor Austin Board of REALTORS
Under Contract Properties by Month
Dec-08 vs. Dec-10: The number of Under Contract properties is down 55%
Full Market Bank Properties Non-Bank Properties
Time Period # Properties Median Price Average DOM # Properties % Bank Median Price # Properties % Non-Bank Median Price
Dec-10 9 165,000 73 5 55.6 205,500 4 44.4 158,450
Nov-10 18 129,450 78 2 11.1 134,900 16 88.9 129,450
Oct-10 17 165,000 95 6 35.3 133,000 11 64.7 222,500
Sep-10 16 192,400 125 0 16 100.0 192,400
Aug-10 15 150,000 90 3 20.0 89,900 12 80.0 169,500
Jul-10 26 171,950 108 5 19.2 149,000 21 80.8 179,900
Jun-10 20 168,475 92 1 5.0 110,000 19 95.0 169,000
May-10 23 175,000 77 3 13.0 82,170 20 87.0 179,250
Apr-10 41 178,000 74 3 7.3 145,900 38 92.7 181,500
Mar-10 35 165,000 64 4 11.4 67,075 31 88.6 169,900
Feb-10 41 170,000 73 5 12.2 80,000 36 87.8 184,950
Jan-10 27 179,600 78 3 11.1 84,500 24 88.9 179,750
Dec-09 17 155,000 79 0 17 100.0 155,000
Nov-09 29 154,000 104 7 24.1 114,900 22 75.9 154,500
Oct-09 29 175,500 72 2 6.9 128,450 27 93.1 179,400
Sep-09 37 157,500 52 2 5.4 173,700 35 94.6 156,500
Aug-09 18 177,250 69 2 11.1 224,900 16 88.9 164,800
Jul-09 22 179,900 71 1 4.5 76,000 21 95.5 179,900
Jun-09 32 189,000 61 2 6.2 112,400 30 93.8 189,450
May-09 22 169,200 53 1 4.5 185,000 21 95.5 159,900
Apr-09 35 142,000 65 5 14.3 74,900 30 85.7 152,450
Mar-09 23 179,500 71 1 4.3 146,400 22 95.7 181,000
Feb-09 15 139,900 82 4 26.7 120,700 11 73.3 159,900
Jan-09 16 184,950 64 1 6.2 134,900 15 93.8 194,900
Dec-08 20 197,875 92 4 20.0 102,400 16 80.0 199,900
Clarus MarketMetrics® 2 of 2 01/18/2011
Information not guaranteed. © 2009-2010 Terradatum and its suppliers and licensors (www.terradatum.com/about/licensors.td).
www.TaylorRealEstateAustin.com | www.EarlyBirdAustin.com | Direct: 512.796.4447 | Fax: 512.628.7720 | 1701 Spyglass Dr. Ste. 8 Austin, TX 78746
8 of 20
- 9. Blake Taylor Austin Board of REALTORS
New Properties by Month
Dec-08 vs. Dec-10: The number of New properties is down 11%
Dec-08 vs. Dec-10
Dec-08 Dec-10 Change %
36 32 -4 -11%
MLS: ACTRIS Period: 2 years (monthly) Price: All Construction Type: All Bedrooms: All Bathrooms: All Lot Size: All
Property Types: Residential: (House, Condo, Townhouse, Manufactured, Half Duplex, Mobile Home, Loft, Residential - Unknown) Sq Ft: All
MLS Areas: 5
Clarus MarketMetrics® 1 of 2 01/18/2011
Information not guaranteed. © 2009-2010 Terradatum and its suppliers and licensors (www.terradatum.com/about/licensors.td).
www.TaylorRealEstateAustin.com | www.EarlyBirdAustin.com | Direct: 512.796.4447 | Fax: 512.628.7720 | 1701 Spyglass Dr. Ste. 8 Austin, TX 78746
9 of 20
- 10. Blake Taylor Austin Board of REALTORS
New Properties by Month
Dec-08 vs. Dec-10: The number of New properties is down 11%
Full Market Bank Properties Non-Bank Properties
Time Period # Properties Median Price # Properties % Bank Median Price # Properties % Non-Bank Median Price
Dec-10 32 164,950 5 15.6 89,900 27 84.4 180,000
Nov-10 44 182,500 10 22.7 127,450 34 77.3 192,000
Oct-10 47 169,111 7 14.9 130,500 40 85.1 176,000
Sep-10 39 184,900 3 7.7 156,500 36 92.3 191,950
Aug-10 50 169,400 3 6.0 149,900 47 94.0 169,900
Jul-10 46 181,950 3 6.5 199,900 43 93.5 169,900
Jun-10 54 167,450 4 7.4 224,250 50 92.6 163,750
May-10 47 159,000 3 6.4 82,170 44 93.6 166,475
Apr-10 104 178,950 9 8.7 164,000 95 91.3 180,000
Mar-10 78 189,900 8 10.3 101,750 70 89.7 197,000
Feb-10 65 165,000 4 6.2 177,500 61 93.8 165,000
Jan-10 62 197,000 6 9.7 112,950 56 90.3 199,450
Dec-09 38 172,400 4 10.5 132,750 34 89.5 172,400
Nov-09 51 199,000 7 13.7 234,900 44 86.3 198,450
Oct-09 68 188,750 6 8.8 152,400 62 91.2 188,750
Sep-09 67 164,900 3 4.5 114,900 64 95.5 168,000
Aug-09 71 164,900 4 5.6 92,200 67 94.4 179,600
Jul-09 67 199,000 3 4.5 174,900 64 95.5 199,000
Jun-09 63 215,000 0 63 100.0 215,000
May-09 50 188,750 4 8.0 130,950 46 92.0 204,500
Apr-09 52 187,000 1 1.9 310,000 51 98.1 175,000
Mar-09 56 196,500 4 7.1 104,900 52 92.9 204,500
Feb-09 56 179,390 4 7.1 87,325 52 92.9 184,900
Jan-09 68 211,470 5 7.3 146,400 63 92.7 213,000
Dec-08 36 169,000 5 13.9 119,900 31 86.1 180,000
Clarus MarketMetrics® 2 of 2 01/18/2011
Information not guaranteed. © 2009-2010 Terradatum and its suppliers and licensors (www.terradatum.com/about/licensors.td).
www.TaylorRealEstateAustin.com | www.EarlyBirdAustin.com | Direct: 512.796.4447 | Fax: 512.628.7720 | 1701 Spyglass Dr. Ste. 8 Austin, TX 78746
10 of 20
- 11. Blake Taylor Austin Board of REALTORS
For Sale Properties by Month
Dec-08 vs. Dec-10: The number of For Sale properties is down 23%
Dec-08 vs. Dec-10
Dec-08 Dec-10 Change %
312 240 -72 -23%
MLS: ACTRIS Period: 2 years (monthly) Price: All Construction Type: All Bedrooms: All Bathrooms: All Lot Size: All
Property Types: Residential: (House, Condo, Townhouse, Manufactured, Half Duplex, Mobile Home, Loft, Residential - Unknown) Sq Ft: All
MLS Areas: 5
Clarus MarketMetrics® 1 of 2 01/18/2011
Information not guaranteed. © 2009-2010 Terradatum and its suppliers and licensors (www.terradatum.com/about/licensors.td).
www.TaylorRealEstateAustin.com | www.EarlyBirdAustin.com | Direct: 512.796.4447 | Fax: 512.628.7720 | 1701 Spyglass Dr. Ste. 8 Austin, TX 78746
11 of 20
- 12. Blake Taylor Austin Board of REALTORS
For Sale Properties by Month
Dec-08 vs. Dec-10: The number of For Sale properties is down 23%
Full Market Bank Properties Non-Bank Properties
Time Period # Properties Median Price Average DOM # Properties % Bank Median Price # Properties % Non-Bank Median Price
Dec-10 240 184,950 157 25 10.4 109,000 215 89.6 195,000
Nov-10 266 179,975 168 23 8.7 159,900 243 91.3 180,000
Oct-10 284 180,000 185 23 8.1 156,500 261 91.9 184,900
Sep-10 278 189,000 194 16 5.8 160,750 262 94.2 189,900
Aug-10 292 188,500 195 17 5.8 149,900 275 94.2 189,900
Jul-10 311 189,000 193 22 7.1 164,500 289 92.9 194,000
Jun-10 321 188,000 192 23 7.2 164,900 298 92.8 189,900
May-10 314 184,950 190 22 7.0 156,500 292 93.0 189,000
Apr-10 335 189,900 182 26 7.8 165,000 309 92.2 195,000
Mar-10 300 189,900 186 22 7.3 167,500 278 92.7 194,900
Feb-10 284 189,700 192 20 7.0 164,950 264 93.0 192,450
Jan-10 279 199,900 199 21 7.5 164,900 258 92.5 200,000
Dec-09 273 199,000 204 16 5.9 188,950 257 94.1 199,000
Nov-09 301 199,000 197 20 6.6 182,400 281 93.4 199,000
Oct-09 313 191,500 193 16 5.1 109,900 297 94.9 195,000
Sep-09 321 191,500 190 12 3.7 136,200 309 96.3 195,000
Aug-09 300 198,875 196 11 3.7 171,900 289 96.3 199,900
Jul-09 285 215,000 206 8 2.8 182,400 277 97.2 218,500
Jun-09 285 219,900 211 8 2.8 187,400 277 97.2 219,900
May-09 272 219,900 212 10 3.7 184,950 262 96.3 221,750
Apr-09 288 198,875 200 12 4.2 187,400 276 95.8 199,000
Mar-09 302 198,375 196 15 5.0 159,500 287 95.0 199,000
Feb-09 296 198,375 206 16 5.4 142,700 280 94.6 199,450
Jan-09 301 215,000 205 14 4.7 152,950 287 95.3 219,000
Dec-08 312 199,941 203 14 4.5 119,900 298 95.5 210,000
Clarus MarketMetrics® 2 of 2 01/18/2011
Information not guaranteed. © 2009-2010 Terradatum and its suppliers and licensors (www.terradatum.com/about/licensors.td).
www.TaylorRealEstateAustin.com | www.EarlyBirdAustin.com | Direct: 512.796.4447 | Fax: 512.628.7720 | 1701 Spyglass Dr. Ste. 8 Austin, TX 78746
12 of 20
- 13. Blake Taylor Austin Board of REALTORS
Expired Properties by Month
Dec-08 vs. Dec-10: The number of Expired properties is down 25%
Dec-08 vs. Dec-10
Dec-08 Dec-10 Change %
59 44 -15 -25%
MLS: ACTRIS Period: 2 years (monthly) Price: All Construction Type: All Bedrooms: All Bathrooms: All Lot Size: All
Property Types: Residential: (House, Condo, Townhouse, Manufactured, Half Duplex, Mobile Home, Loft, Residential - Unknown) Sq Ft: All
MLS Areas: 5
Clarus MarketMetrics® 1 of 2 01/18/2011
Information not guaranteed. © 2009-2010 Terradatum and its suppliers and licensors (www.terradatum.com/about/licensors.td).
www.TaylorRealEstateAustin.com | www.EarlyBirdAustin.com | Direct: 512.796.4447 | Fax: 512.628.7720 | 1701 Spyglass Dr. Ste. 8 Austin, TX 78746
13 of 20
- 14. Blake Taylor Austin Board of REALTORS
Expired Properties by Month
Dec-08 vs. Dec-10: The number of Expired properties is down 25%
Full Market Bank Properties Non-Bank Properties
Time Period # Properties Median Price Average DOM # Properties % Bank Median Price # Properties % Non-Bank Median Price
Dec-10 44 194,000 194 1 2.3 180,000 43 97.7 199,000
Nov-10 40 161,200 167 1 2.5 149,900 39 97.5 172,500
Oct-10 45 195,000 190 4 8.9 159,250 41 91.1 199,400
Sep-10 25 199,995 104 0 25 100.0 199,995
Aug-10 38 194,000 133 1 2.6 292,900 37 97.4 189,000
Jul-10 43 174,000 114 3 7.0 292,900 40 93.0 167,000
Jun-10 36 182,400 127 3 8.3 179,900 33 91.7 184,900
May-10 24 178,500 111 0 24 100.0 178,500
Apr-10 27 214,900 127 4 14.8 208,450 23 85.2 217,900
Mar-10 34 200,380 115 1 2.9 289,000 33 97.1 195,760
Feb-10 21 212,000 152 1 4.8 104,900 20 95.2 218,500
Jan-10 33 239,000 148 2 6.1 208,500 31 93.9 242,000
Dec-09 39 205,000 147 1 2.6 242,500 38 97.4 200,484
Nov-09 37 197,000 138 1 2.7 242,500 36 97.3 195,750
Oct-09 34 154,950 138 1 2.9 90,000 33 97.1 159,900
Sep-09 39 247,000 155 0 39 100.0 247,000
Aug-09 28 219,450 122 0 28 100.0 219,450
Jul-09 34 247,500 139 0 34 100.0 247,500
Jun-09 35 225,000 171 1 2.9 269,000 34 97.1 225,000
May-09 28 229,450 147 1 3.6 63,150 27 96.4 229,900
Apr-09 31 174,900 120 1 3.2 285,000 30 96.8 169,950
Mar-09 43 209,999 146 3 7.0 159,500 40 93.0 217,250
Feb-09 35 238,988 180 1 2.9 79,900 34 97.1 238,994
Jan-09 45 239,700 116 1 2.2 44,900 44 97.8 242,850
Dec-08 59 165,100 132 1 1.7 119,900 58 98.3 167,300
Clarus MarketMetrics® 2 of 2 01/18/2011
Information not guaranteed. © 2009-2010 Terradatum and its suppliers and licensors (www.terradatum.com/about/licensors.td).
www.TaylorRealEstateAustin.com | www.EarlyBirdAustin.com | Direct: 512.796.4447 | Fax: 512.628.7720 | 1701 Spyglass Dr. Ste. 8 Austin, TX 78746
14 of 20
- 15. Blake Taylor Austin Board of REALTORS
Supply & Demand by Month
Dec-08 vs. Dec-10: The number of for sale properties is down 23% and the number of sold properties is up 58%
Dec-08 vs. Dec-10 Dec-08 vs. Dec-10
Dec-08 Dec-10 Change % Dec-08 Dec-10 Change %
312 240 -72 -23% 12 19 7 +58%
MLS: ACTRIS Period: 2 years (monthly) Price: All Construction Type: All Bedrooms: All Bathrooms: All Lot Size: All
Property Types: Residential: (House, Condo, Townhouse, Manufactured, Half Duplex, Mobile Home, Loft, Residential - Unknown) Sq Ft: All
MLS Areas: 5
Clarus MarketMetrics® 1 of 2 01/18/2011
Information not guaranteed. © 2009-2010 Terradatum and its suppliers and licensors (www.terradatum.com/about/licensors.td).
www.TaylorRealEstateAustin.com | www.EarlyBirdAustin.com | Direct: 512.796.4447 | Fax: 512.628.7720 | 1701 Spyglass Dr. Ste. 8 Austin, TX 78746
15 of 20
- 16. Blake Taylor Austin Board of REALTORS
Supply & Demand by Month
Dec-08 vs. Dec-10: The number of for sale properties is down 23% and the number of sold properties is up 58%
# Properties Average DOM # Properties Average DOM
Time Period For Sale For Sale Sold Sold
Dec-10 240 157 19 83
Nov-10 266 168 16 96
Oct-10 284 185 13 129
Sep-10 278 194 18 103
Aug-10 292 195 21 87
Jul-10 311 193 26 124
Jun-10 321 192 33 88
May-10 314 190 35 36
Apr-10 335 182 29 96
Mar-10 300 186 43 67
Feb-10 284 192 22 82
Jan-10 279 199 19 68
Dec-09 273 204 26 88
Nov-09 301 197 34 67
Oct-09 313 193 36 54
Sep-09 321 190 24 77
Aug-09 300 196 16 75
Jul-09 285 206 40 76
Jun-09 285 211 23 61
May-09 272 212 25 52
Apr-09 288 200 27 68
Mar-09 302 196 15 84
Feb-09 296 206 15 63
Jan-09 301 205 16 93
Dec-08 312 203 12 105
Clarus MarketMetrics® 2 of 2 01/18/2011
Information not guaranteed. © 2009-2010 Terradatum and its suppliers and licensors (www.terradatum.com/about/licensors.td).
www.TaylorRealEstateAustin.com | www.EarlyBirdAustin.com | Direct: 512.796.4447 | Fax: 512.628.7720 | 1701 Spyglass Dr. Ste. 8 Austin, TX 78746
16 of 20
- 17. Blake Taylor Austin Board of REALTORS
The Average Days on Market by Month
Dec-08 vs. Dec-10: The average days on market is down 20%
Dec-08 vs. Dec-10
Dec-08 Dec-10 Change %
92 73 -18 -20%
MLS: ACTRIS Period: 2 years (monthly) Price: All Construction Type: All Bedrooms: All Bathrooms: All Lot Size: All
Property Types: Residential: (House, Condo, Townhouse, Manufactured, Half Duplex, Mobile Home, Loft, Residential - Unknown) Sq Ft: All
MLS Areas: 5
Clarus MarketMetrics® 1 of 2 01/18/2011
Information not guaranteed. © 2009-2010 Terradatum and its suppliers and licensors (www.terradatum.com/about/licensors.td).
www.TaylorRealEstateAustin.com | www.EarlyBirdAustin.com | Direct: 512.796.4447 | Fax: 512.628.7720 | 1701 Spyglass Dr. Ste. 8 Austin, TX 78746
17 of 20
- 18. Blake Taylor Austin Board of REALTORS
The Average Days on Market by Month
Dec-08 vs. Dec-10: The average days on market is down 20%
Time Period Average DOM # UC Units
Dec-10 73 9
Nov-10 78 18
Oct-10 95 17
Sep-10 125 16
Aug-10 90 15
Jul-10 108 26
Jun-10 92 20
May-10 77 23
Apr-10 74 41
Mar-10 64 35
Feb-10 73 41
Jan-10 78 27
Dec-09 79 17
Nov-09 104 29
Oct-09 72 29
Sep-09 52 37
Aug-09 69 18
Jul-09 71 22
Jun-09 61 32
May-09 53 22
Apr-09 65 35
Mar-09 71 23
Feb-09 82 15
Jan-09 64 16
Dec-08 92 20
Clarus MarketMetrics® 2 of 2 01/18/2011
Information not guaranteed. © 2009-2010 Terradatum and its suppliers and licensors (www.terradatum.com/about/licensors.td).
www.TaylorRealEstateAustin.com | www.EarlyBirdAustin.com | Direct: 512.796.4447 | Fax: 512.628.7720 | 1701 Spyglass Dr. Ste. 8 Austin, TX 78746
18 of 20
- 19. Blake Taylor Austin Board of REALTORS
Months Supply of Inventory
Dec-08 vs. Dec-10: The average months supply of inventory is up 78%
Dec-08 vs. Dec-10
Dec-08 Dec-10 Change %
11.6 20.8 9.1 +78%
MLS: ACTRIS Period: 2 years (monthly) Price: All Construction Type: All Bedrooms: All Bathrooms: All Lot Size: All
Property Types: Residential: (House, Condo, Townhouse, Manufactured, Half Duplex, Mobile Home, Loft, Residential - Unknown) Sq Ft: All
MLS Areas: 5
Clarus MarketMetrics® 1 of 2 01/18/2011
Information not guaranteed. © 2009-2010 Terradatum and its suppliers and licensors (www.terradatum.com/about/licensors.td).
www.TaylorRealEstateAustin.com | www.EarlyBirdAustin.com | Direct: 512.796.4447 | Fax: 512.628.7720 | 1701 Spyglass Dr. Ste. 8 Austin, TX 78746
19 of 20
- 20. Blake Taylor Austin Board of REALTORS
Months Supply of Inventory
Dec-08 vs. Dec-10: The average months supply of inventory is up 78%
# Units For Sale # UC Units UC Average
Time Period Last Day of Month During Month MSI DOM
Dec-10 187 9 20.8 73
Nov-10 208 18 11.6 78
Oct-10 222 17 13.1 95
Sep-10 237 16 14.8 125
Aug-10 239 15 15.9 90
Jul-10 242 26 9.3 108
Jun-10 265 20 13.2 92
May-10 267 23 11.6 77
Apr-10 267 41 6.5 74
Mar-10 231 35 6.6 64
Feb-10 222 41 5.4 73
Jan-10 219 27 8.1 78
Dec-09 217 17 12.8 79
Nov-09 235 29 8.1 104
Oct-09 250 29 8.6 72
Sep-09 245 37 6.6 52
Aug-09 254 18 14.1 69
Jul-09 229 22 10.4 71
Jun-09 218 32 6.8 61
May-09 222 22 10.1 53
Apr-09 222 35 6.3 65
Mar-09 236 23 10.3 71
Feb-09 246 15 16.4 82
Jan-09 240 16 15.0 64
Dec-08 233 20 11.7 92
Clarus MarketMetrics® 2 of 2 01/18/2011
Information not guaranteed. © 2009-2010 Terradatum and its suppliers and licensors (www.terradatum.com/about/licensors.td).
www.TaylorRealEstateAustin.com | www.EarlyBirdAustin.com | Direct: 512.796.4447 | Fax: 512.628.7720 | 1701 Spyglass Dr. Ste. 8 Austin, TX 78746
20 of 20