Week12sampling and feature selection technique to solve imbalanced dataset
MPH Thesis Tesfaye Kasaye
1. Science Journal of Public Health
2014; 3(1): 19-24
Published online December 29, 2014 (http://www.sciencepublishinggroup.com/j/sjph)
doi: 10.11648/j.sjph.20150301.14
ISSN: 2328-7942 (Print); ISSN: 2328-7950 (Online)
The sensitivity and specificity of mid-upper arm
circumference compared to body mass index in
screening malnutrition of adult HIV patients taking ART;
evidence from selected facilities of Addis Ababa, Ethiopia
Tesfaye Abrhame1
, Jemal Haidar2
1
Addis Ababa University, Medical Faculty, School of Public Health, Addis Ababa, Ethiopia
2
School of Public Health, Addis Ababa University, P.O. Box 27285/1000
Email address:
tesfakal.2009@gmail.com (T. Abrhame), hjemal@gmail.com (J. Haidar)
To cite this article:
Tesfaye Abrhame, Jemal Haidar. The Sensitivity and Specificity of Mid-Upper Arm Circumference Compared to Body Mass Index in
Screening Malnutrition of Adult HIV Patients taking ART; Evidence from Selected Facilities of Addis Ababa, Ethiopia. Science Journal
of Public Health. Vol. 3, No. 1, 2015, pp. 19-24. doi: 10.11648/j.sjph.20150301.14
Abstract: Introduction: For nutritional assessment of HIV-positive adults and adolescents, it is recommended to take
Weight, Height and MUAC (for pregnant and lactating women and/or adults who cannot stand straight) in every contact,
such measurements increase the waiting time and inconvenience(1). So that a simple and yet useful anthropometric
measurement is needed to screen malnutrition for an immediate nutrition support in developing countries. Objective: To
assess the sensitivity (SN) and specificity (SP) of mid-upper arm circumference (MUAC) in detecting under nutrition of
adult people with HIV who have a follow up at ART clinic. Methods: A cross-sectional study was conducted from January
to July 2013 among adults with HIV (PLHIV), who have follow-up in three selected Governmental Hospitals of Addis
Ababa city administration. A total of 594 study subjects were selected using a multi stage cluster sampling technique.
MUAC, Height and weight were measured for all subjects and BMI was calculated as Wt/Ht2
. Receivers operating
characteristic curve analyses were undertaken to discover the most suitable cut-off values of MUAC for both Men and
Women. Results: The prevalence of chronic energy deficiency (CED) based on BMI (BMI <18.5) was 39.4% for males and
24.21% for females, while based on MUAC <230 mm for male was 48.4% and < 220 mm for female was 35.7%. The
sensitivity and specificity of MUAC for Female with optimal criteria of ≤224 for females were 92.86 and 87.07, whereas
for Males MUAC with optimal criteria of ≤234 were 94.85 and 68.46, respectively. The area under curve (AUC) was 0.93
(p<0.001). A MUAC value of ≤239mm was identified as the best cut off-points to identify CED (BMI <18.5) with SN and
SP of 96.43% and 72.62%, respectively. The PPV was 56.6(95%CI=89.9 to 99.3) with the highest NPV 98.2 (95%CI=66.8
to 77.9), thus having the highest Youden Index of 0.21. A MUAC value of ≤242mm was identified as the best cut off point
to identify CED (BMI <18.5) with SN and SP of 96.91% and 58.39%, respectively. The PPV was 46.3(95%CI=91.2 to 99.4)
with the highest NPV 98.1 (95%CI=50.0 to 66.4), thus having the highest Youden Index of 0.32. Conclusion: a MUAC
value of close to 242 mm for male and 239mm for female seemed to be appropriate as a simple and efficient cut-off point
for the determination of under nutrition in adult PLHIV.
Keywords: Sensitivity, Specificity, BMI, CED, Mid-Upper Arm Circumference, Nutritional Status, ROC Curve
1. Introduction
Inadequate nutrition in patients living with HIV (PLHIV)
can put them at high risk of chronic diseases particularly if
combined with other adverse lifestyle behaviors, received
recognition of policy makers and launched national
nutritional programs to combat the threat of malnutrition(2).
For individual assessment of body composition and size,
anthropometry is being replaced by more accurate but also
more complicated methods. Calculation of individual BMI
from weight and height still remains a standard and valid
tool for the assessment of nutritional status(3),though the
complexity of calculations for health workers without
mathematical backgrounds or access to calculation software
2. 20 Tesfaye Abrhame and Jemal Haidar: The Sensitivity and Specificity of Mid-Upper Arm Circumference Compared to Body Mass
Index in Screening Malnutrition of Adult HIV Patients taking ART; Evidence from Selected Facilities of Addis Ababa, Ethiopia
is an issue and its use in clinical practice may mask
important weight changes and result in a failure to alert
healthcare staff to a nutritional problem(4). Furthermore,
charts and tables may not be available for those working in
traditional health/nutrition services which are often poorly
equipped(5).
Currently the national Guidelines for HIV/AIDS and
Nutrition in Ethiopia recommends weight, height and
MUAC (for pregnant and lactating women and/or adults
who cannot stand straight) measurements to be taken in
every contact(6) and this entails to increase the waiting
time and inconvenience for the patients underlines the need
for an alternative anthropometric measurements like Mid-
upper arm circumference (MUAC). MUAC measurement is
a reliable and a feasible method of assessment of nutritional
status of adults and can be used for screening. An important
advantage of using MUAC compared with BMI is that it
can be easily obtained in older persons using a simple
measuring tape. It has been used for many years as an
alternative index of nutritional status in situations like
famines and refugee crises, where the height and weight
measurements are difficult (7, 8). In addition to reliability
and simplicity, MUAC demonstrated superior sensitivity to
risk of death (9, 10), and can offer considerable cost
advantages because it only requires measuring tapes which
are less expensive than height boards. MUAC measurement
is easier to perform on severely malnourished adults than
BMI assessment(11)) but no studies have identified the use
of MUAC for patient with PLHIV. It is a potentially useful
indicator requiring only a cheap, widely available and
durable measuring tape that requires no calibration, and
having the advantage that it can be measured in patients
who have difficulty in standing. Therefore; identification of
simple practical ways to assess nutritional status and related
outcomes in patients with HIV/AIDS before and during
treatment with particular reference to resource-limited
settings is mandatory to provide appropriate interventions
(12). The purpose of this study was to determine a tool that
will be easier and more appropriate for screening of
malnutrition among PLHIV and assess the sensitivity and
specificity of MUAC in correctly identifying the patient
qualifying for supplementary feeding and examine whether
BMI can be substituted by MUAC in assessing the
nutritional status.
2. Methodology
2.1. Study Design and Settings
An institution based cross-sectional quantitative study
design was employed to assess the sensitivity and
specificity of MUAC in Addis Ababa, the capital and
largest city of Ethiopia as well as the country's commercial,
manufacturing, and cultural center. Its projected population
of 2013 is estimated to be 3,038,096 million that resides in
10 sub-cities and 116 Woreda. In the city, there were 36
private and 6 governmental hospitals, 52 health centers (of
which 45 are public and 7 are NGO health centres), 136
health stations, 700 private clinics. The numbers of health
facilities providing ART services were 66 in number and
patients currently on ART were 54,667. The number of
ART clients registered in each government hospitals
namely Tikur Anbesa specialized (1,302), Saint Paul (987),
Zewditu Memorial (1,018), Yekatit 12 (3,065), Ghandi
Memorial (987) and Ras Desta Damtew Memorial hospital
(1,011) at the time of the study; of these, only three
accessible hospitals with large number of clients were
purposively selected.
2.2. Sample Size
The Sample Size was estimated using single population
proportion formula assuming 50% prevalence of wasting
(since there is no information), 5% degree of precision and
95% confidence level of certainty and 5% non response
rate with a design effect of (1.5), a total of 594 subjects
were estimated and allocated proportionately across the
three hospital namely Zeweditu memorial (n=345); Yekatit
12 (n=135); Ras Desta Damtew memorial Hospital (n=114).
The required subjects in each facility were recruited and
enrolled consecutively until the required sample size was
reached.
2.3. Data Collection
Data were collected by trained health workers under the
supervision of the PI using anonymous pretested
questionnaire containing information on socio-demographic,
environmental, anthropometry, dietary. Each completed
questioner was checked immediately by the PI to ascertain
all the questions have been answered consistently. The
information entered was rechecked in 5% of randomly
selected respondents.
Middle upper arm circumference was measured in
centimeter with a non-stretched measuring tape with the
right arm hanging relaxed. The measurement was taken
midway between the tip of the acromion and olecranon
process. The tape was placed gently but firmly round the
arm to avoid compression of soft tissue. Measurement was
taken nearest to 0.1 cm; and subjects were categorized as
undernourished when MUAC was ≤230 mm for male and
≤220 mm for females(13).
Weight was measured in kilogram without shoes using a
digital bath scale with good precision. Checks on the scale
were made routinely before recording the weight of each
subject.
Height was taken barefooted in centimeter using
stadiometre. A vertical tape fixed perpendicular to the
ground on the wall was used as the scale. During the
anthropometric measurements the scale was repeatedly
checked for accuracy against a known weight. Height was
recorded to the nearest 1 cm.
Body mass index (BMI) was calculated as weight in
kg/height in m2
, and values below or equal to 18.5 kg/m2
was considered undernourished or CED(14)
3. Science Journal of Public Health 2014; 3(1): 19-24 21
2.4. Data Analysis
After sorting the data and performed quality control for
completeness and consistency, the data were then coded
and entered into computers and validated for consistency
using EPI version 7.1 and analysis was done using SPSS
version 16 for windows. The anthropometric variables were
described as mean (SD) and range values. The frequencies
of CED were expressed as percentages. Chi-square was
utilized to test the significance differences in frequencies of
CED among the MUAC categories and BMI and a p-value
<0.05 was considered statistically significant.
Receiver operating characteristic curve (ROC) analysis
was done using Medcalc software version 12.1 to locate the
optimal cut-off values of MUAC corresponding to the BMI
cut-off in identifying CED cases. Youden index (YI) was
calculated as: ‘sensitivity + specificity – 1’. Among the
different MUAC values, YIs were compared to discern the
optimal cut-off points for CED.
2.5. Ethical Issues
Ethical approval was obtained from the School of Public
Health Research Ethics Review Committee of Addis Ababa
University, College of Health Sciences; as well as Addis
Ababa Health bureau research ethics committee. Officials
of each facility were also contacted, and permission was
granted to conduct the study. Informed written consent was
obtained from each subject for their participation and the
right to withdraw from the study at any time was also
communicated to all of them.
3. Result
Of the total of 594 respondents, 593 participated making
the response rate 99.8%. Over half (58.5%) were females.
The mean age of study participant was 34. About one-third
(32.8%) were single and over half (51.0%) were Orthodox.
The proportion of respondents who had tertiary level of
schooling was 34.7%, and private employees constituted
45.3% and less than half (41.7%) earned less than or equal
to 500 Birr, Ethiopian currency, (Table 1).
Table 1. socio-demographic characters of the respondents, Addis Ababa,
2014
Characters Number(N=593) Percents
Sex
Male 246 41.5
Female 347 58.5
Age(years)
≤ 20 16 2.7
21 – 26 53 8.9
27 – 32 136 22.9
33 – 37 187 31.6
38 – 43 118 19.9
44+
Mean (SD)
83
34(7.2)
14.0
Marital status
Single 195 32.8
Married 231 39.0
Characters Number(N=593) Percents
Divorced 78 13.2
Widowed 89 15.0
Religion
Orthodox 304 51.3
Protestant 112 18.9
Muslim 82 13.8
Catholic 64 10.8
Educational status
No schooling 35 5.9
Grade 1-6 119 20.0
Grade 7-12 233 39.4
Tertiary schooling 206 34.7
Occupation
NGO 62 10.5
Government 139 23.4
Student 30 5.1
Housewife 81 13.7
Private/ Merchant 269 45.3
Daily laborer 12 2
Monthly HH Income
≤ 500 (Birr) 247 41.7
501 – 1,000 157 26.5
1,001+ 189 31.8
20 Birr=1USD
3.1. Anthropometric Data
Table 2 shows the anthropometric measurement of the
respondents. The mean (SD) MUAC, weight (SD, height
(SD) and BMI (SD) were 161.7 (±8) mm, 56.2 (±9.3) kg,
242(±31.5) mm, and 21.5±3.4 kg/m2
, respectively.
Table 2. Anthropometric result of the respondents in selected health
facilities of Addis Ababa, May 2013.
Variable Mean (±SD) Minimum
Maximu
m
Height(cm) 161.7 8.1 130.0 182.0
Weight(kg) 56.2 9.3 31.0 94.0
BMI(kg/m2
) 21.5 3.4 16.0 32.0
MUAC(mm) 242.0 33.5 150.0 350.0
SD=standard deviation
Table 3. Association of MUAC and BMI of the respondents in selected
health facilities of Addis Ababa, May 2013
CED BMI
(≤18.5kg/m2)
Well nourished BMI
(>18.5kg/m2)
Total
Female MUAC
<220mm CED 92 32 124
Well nourished 9 214 223
Total 124 223 347
Male MUAC
<230mm CED 76 43 119
Well nourished 4 123 127
Total 80 166 246
3.2. Sensitivity and Specificity of MUAC and BMI
Receiver operating characteristic curve analysis of
sensitivity and specificity of MUAC using the cutoff point
of 240mm and 220mm for male and female is computed
respectively using Medcalc version 12 Software. The
4. 22 Tesfaye Abrhame and Jemal Haidar: The Sensitivity and Specificity of Mid-Upper Arm Circumference Compared to Body Mass
Index in Screening Malnutrition of Adult HIV Patients taking ART; Evidence from Selected Facilities of Addis Ababa, Ethiopia
sensitivity and specificity of MUAC for Female with
optimal criteria of ≤220mm were 91.9% and 86.9%,
respectively whereas for Males MUAC with optimal
criteria of ≤230mm were 95% and 74% respectively.
Receiver operating characteristic curve analysis of
sensitivity and specificity of MUAC for Female with
optimal criteria of ≤226mm were 94.9% and 85.9%
respectively whereas for Males MUAC with optimal
criteria of ≤234 were 94.8% and 68.5% respectively.
The results of ROC curve analyses for Female MUAC
with optimal criteria of (≤226mm) shows sensitivity (SN)
94.9%, specificity (SP) 85.9%, positive predictive value
(PPV) 71.2% and negative predictive value (NPV) 97.5%
for each MUAC value to identify CED are presented in
(Table 4).
The results of ROC curve analyses of Male MUAC are
presented in (Table 6) with optimal criteria of (≤230 mm),
with the sensitivity (SN) , specificity (SP), positive
predictive value (PPV) and negative predictive value (NPV)
for each MUAC value to identify CED.
The use of MUAC for female correctly diagnosed 74.2%
of cases of CED and 96% with normal nutritional status
and the use of MUAC for male correctly diagnosed 96.9%
of cases of CED and 63.9% with normal nutritional status.
Similar study done on MUAC correctly diagnosed 82.35%
of cases of CED and 81.82% of women with normal
nutritional status.
Table 4. Receiver operating characteristic curve of MUAC with sensitivity and specificity of female respondents in selected health facilities of Addis
Ababa, May 2013.
Criterion Sensitivity 95% CI Specificity 95% CI PPV NPV YI
≤226mm 94.05 86.7 - 98.0 85.93 81.1 - 89.9 71.2 97.5 0.135
≤230mm 95.24 88.3 - 98.7 78.33 72.9 - 83.2 61.9 97.8 0.184
≤231mm 96.43 89.9 - 99.3 77.57 72.0 - 82.5 61.4 98.3 0.183
≤239mm 96.43 89.9 - 99.3 72.62 66.8 - 77.9 56.6 98.2 0.219
≤240mm 97.62 91.7 - 99.7 63.88 57.8 - 69.7 50 98.6 0.277
≤240.5mm 98.81 93.5 - 100.0 63.88 57.8 - 69.7 50.3 99.3 0.27
Table 5. Estimated specificity at fixed sensitivity of Female respondents in selected health facilities of Addis Ababa, May 2013.
Estimated specificity at fixed sensitivity
Sensitivity Specificity 95% CI Criterion
80 89.56 85.42 to 93.46 ≤221.7467
90 87.83 81.90 to 92.02 ≤223.43
95 79.85 58.92 to 89.35 ≤229.2
97.5 64.75 18.77 to 82.56 ≤239.9
80 94.98 88.78 to 98.79 ≤229.12
90 77.92 61.77 to 95.34 ≤221.63
95 64.83 36.60 to 78.47 ≤219.23
97.5 31.17 18.93 to 55.94 ≤209.7964
Table 6. Results of receiver operating characteristic curve analyses of mid-upper arm circumference with sensitivity and specificity of Male respondents in
selected health facilities of Addis Ababa, May 2013.
Criterion Sensitivity 95% CI Specificity 95% CI PPV NPV YI
≤234mm 94.85 88.4 - 98.3 68.46 60.3 - 75.8 52.7 97.3 0.258
≤239mm 94.85 88.4 - 98.3 66.44 58.3 - 74.0 51.1 97.2 0.273
≤240mm 96.91 91.2 - 99.4 59.06 50.7 - 67.0 46.7 98.1 0.316
≤242mm 96.91 91.2 - 99.4 58.39 50.0 - 66.4 46.3 98.1 0.32
≤244mm 97.94 92.7 - 99.7 58.39 50.0 - 66.4 46.5 98.7 0.315
Table 7. Estimated specificity at fixed sensitivity of Male respondents in
selected health facilities of Addis Ababa, May 2013.
Estimated specificity at fixed sensitivity
Sensitivity Specificity 95% CI Criterion
80 69.13 59.65 to 79.87 ≤230.32
90 69.13 61.07 to 76.36 ≤232.55
95 65.89 27.52 to 75.17 ≤239.075
97.5 58.39 4.70 to 73.15 ≤243.15
80 75.4 60.63 to 85.57 ≤228.0941
90 24.74 13.22 to 60.82 ≤212.45
95 18.07 1.78 to 28.04 ≤209.3062
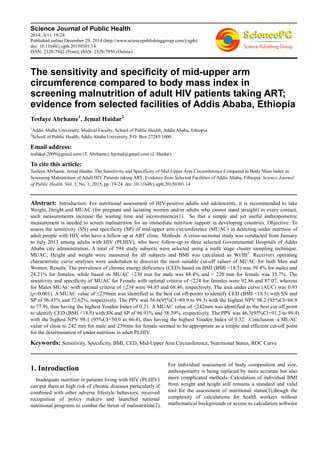
97.5 2.53 0.00 to 22.99 ≤187.525 Figure 1. Receiver operating characteristic curve of Female respondents
MUAC in selected health facilities of Addis Ababa, May 2013.
5. Science Journal of Public Health 2014; 3(1): 19-24 23
Figure 2. Receiver operating characteristic curve analysis of MUAC of
Male respondents in selected health facilities of Addis Ababa, May 2013.
4. Discussion
The present study found that thirty five percent of
women based on MUAC (≤220mm) and twenty-nine
percent based on BMI (less than 18.5 kg/m2
) were
Undernourished whereas forty-eight percent of men based
on MUAC (≤230mm) and thirty–two percent based on BMI
were undernourished. Since the study was aimed at
assessing the sensitivity and specificity of MUAC in
detecting under nutrition of PLWH. The determination of
an adult population’s Nutritional Status is recognized as of
prime importance when assessing for population health and
wellbeing. There are different modalities for this, BMI is
most often used and MUAC is also recognized as a useful
and simpler tool for screening adult individuals for poor
nutritional status(15) and has been shown to accurately
reflect adult nutritional status as defined by BMI(16).
The prevalence of CED (BMI ≤18.5) was 32.5% and
29.1% for male and female, were as the prevalence of
under nutrition based on (MUAC ≤230 mm&, ≤220mm)
were 48.4% and 35.7% in male and female respectively.
The sensitivity and specificity of MUAC for Female and
Male with optimal criteria of ≤220mm and ≤230mm were
91.9% and 95% respectively whereas for Males MUAC
with optimal criteria of ≤234mm were 94.8% and 68.4%
respectively. The sensitivity and specificity of MUAC for
Female and male with optimal criteria of ≤224mm were
92.8% and 87.0%, respectively whereas for Males MUAC
with optimal criteria of ≤234mm were 94.8% and 68.4%
respectively.
There was a significant positive association between
MUAC and BMI, regression analysis demonstrated that
MUAC had a significant positive relation with BMI; the
percentage of the variation in BMI explained by MUAC
was 71%. The binary Logistic regression analysis
demonstrated that overall, 82.2% of cases of CED were
correctly classified by using MUAC. The use of MUAC for
female correctly diagnosed 74.2% of cases of CED and
96% with normal nutritional status and the use of MUAC
for male correctly diagnosed 96.9% of cases of CED and
63.9% with normal nutritional status this finding is similar
with other studies done on MUAC which correctly
diagnosed 82.4% of cases of CED and 81.82% of women
with normal nutritional status.
The present study demonstrated a significant positive
correlation between MUAC and BMI(r=.71, p<0.01).
MUAC value of 239 mm was found to be most appropriate
in identification of female subjects with CED, and a value
of 242 mm was most useful in identifying men with CED.
Both of these values are higher than the internationally
recommended men’s MUAC cut-off value of 230 mm and
females 220mm.
It is also recognized as an effective means of screening
for poor NS in adults(17)-(15). However, the recommended
MUAC cut-off value of 230 mm to define in men(3) may
not be the most appropriate for all ethnic groups. A study
from Nigeria(18) reported that a MUAC cut-off point of
230 mm was optimal for the north of the country, while a
240 mm Cut-off point was more appropriate for the south.
Thus, there is a need to establish ethno-specific MUAC cut-
off points. Similarly, a cut-off point of 240 mm was
reported to be suitable in a recent study from the south of
India(19); however, a recent study(20) of non-tribal adult
slum dwellers of Bengalee ethnicity in West Bengal, India,
reported a MUAC value of 240 mm to be the most
appropriate cut-off point for identifying CED (BMI<18.5).
A possible reason for cut-off points being higher than that
suggested by James et al(3) is that persons of South Asian
origin (eg the Oraon) have higher levels of regional
adiposity (irrespective of BMI) compared with other ethnic
groups(21)-(22).
Under nutrition is more prevalent in males than females
this might be due to the peripheral adiposity of females,
Individuals with a MUAC less than 240 mm were
approximately twice as likely to report recent illness
compared with those with a MUAC equal to or above 240
mm(20). Again in this study, MUAC close to 240 mm was
appropriately sensitive to reported illness. However, this
study combined with the similar findings discussed,
suggests an urgent need to revisit BMI and MUAC cut-off
values as the measures of CED and under-nutrition.
The area under curve (AUC) was 0.93 (p<0.001) (Table
9). A MUAC value of ≤ 239mm for female was identified
as the best cut off to identify CED (BMI <18.5kg/m2
) with
SN and SP of 96.43% and 72.62%, respectively. The PPV
was 56.6(CI 89.9-99.3) with the highest NPV 98.2 (CI
66.8-77.9), thus having the highest YI of 0.21.
Another result of ROC curve analyses for Male MUAC
are presented, with the sensitivity (SN), specificity (SP),
positive predictive value (PPV) and negative predictive
value (NPV) for each MUAC value to identify CED. The
area under the curve (AUC) was 0.83 (p<0.0001) (Table
11). A MUAC value of <= 242mm for males was identified
as the best cut off to identify CED (BMI <18.5) with SN
and SP of 96.91% and 58.39%, respectively. The PPV was
46.3(CI 91.2-99.4) with the highest NPV 98.1 (CI 50.0-
66.4), thus having the highest Youden Index of 0.32.
The mean BMI in this study for age group15-49 is 21.85
kg/m2 and 21.02 kg/m2 for women and men respectively.
Forty-two percent of women have a normal BMI (between
6. 24 Tesfaye Abrhame and Jemal Haidar: The Sensitivity and Specificity of Mid-Upper Arm Circumference Compared to Body Mass
Index in Screening Malnutrition of Adult HIV Patients taking ART; Evidence from Selected Facilities of Addis Ababa, Ethiopia
18.5 and 24.9 kg/m2), while 29 percent of women are thin
or undernourished (BMI less than 18.5 kg/m2) and 7
percent are overweight or obese (BMI 25 kg/m2 or above)
this finding is supported by other studies except
undernourished27% (23). Thirty –two percent of men have
normal BMI (between 18.5 and 24.9 kg/m2), while 39.4
percent of men are thin or undernourished (BMI less than
18.5 kg/m2) and 4.5 percent are overweight or obese (BMI
25 kg/m2 or above).
Acknowledgement
We thank all the study subjects including the staffs of
Addis Ababa Health Bureau, Zewditu Memorial Hospital,
Ras-Desta Memorial Hospital and Yekatit 12 Hospital for
their unreserved support during the data collection process.
Reference
[1] Ferro-Luzzi A SS, Franklin M, James WPT. A simplified
approach to assessing adult chronic energy deficiency.
European Journal of Clinical Nutrition 1992;46:173-86.
[2] WHO. Physical status: the use and interpretation of
anthropometry. Report of a WHO Expert Committee. World
Health Organ Technical Report Series. 1995.
[3] James WP M-TG, Norgan NG, Bistrian BR, Shetty PS,
Ferro-Luzzi A. The value of arm circumference
measurements in assessing chronic energy deficiency in
Third World adults. European Journal of Clinical Nutrition
1994;48:883-94.
[4] Bisai S BK. Undernutrition in the Kora Mudi tribal
population, West Bengal, India: a comparison of body mass
index and mid-upper-arm circumference. Food Nutr
Bull2009;30(1):63-7.
[5] Gustafson VFG, C>S> Vieira, B. Samb, A. Naucler,.
Predictors for Death in HIV-positive and HIV-negative
Tuberculosis Patients in Guinea-Bissau. 2007;35(2):69-80.
[6] EFMOH. National Guidelines for HIV/AIDS and
Nutrition in Ethiopia. 2000.
[7] Jelliffe DB JE. The arm circumference as a public health
index of protein-calorie malnutrition in early childhood.
Journal of tropical pediatrics. 1996;15(177-260.).
[8] Velzeboer Mea. Evaluation of arm circumference as a public
health index of protein-calorie malnutrition in early
childhood. Joumal of tropical pediatrics1983;29(135-44).
[9] Briend A DC, Graven K, Mazumder RN, Wojtyniak B.
Usefulness of nutritional indices and classifications in
predicting death of malnourished children.
BMJ1986;923:373=5.
[10] Vella V TA, Ndiku J, Marshal T, Cortinovis I Anthropometry
as a predictor for mortality among Ugandan children,
allowing for socio-economic variables. Eur J Clin Nutr
1994;48:189-97.
[11] Steve Collins M, BS. Using Middle Upper Arm
Circumference to Assess Severe Adult Malnutrition During
Famine JAMA1996;276(5):391-5.
[12] WHO. Executive Summary of a scientific review.
Consultation on Nutrition and HIV/AIDS in
Africa.(Evidence, lessons and recommendations for action.
Durban, South Africa); 2005.
[13] BAPEN. Malnutrition universal screening tool (MUST);
British Dietetic Association, 2011.
[14] Z. Cook SK SLaSS. Use of BMI in the assessment of
undernutrition in older subjects: reflecting on practice.
2005;64:313.
[15] T.Khadivzadeh. Mid-upper arm and calf circumferences as
indicators of nutritional status in women of reproductive age.
Eastern and Mediterranean Health Journal 2002; 8:612-8.
[16] Collins.S. Using middle upper arm circumference to assess
severe adult malnutrition during famine. JAMA
1996;276:391-5.
[17] Bose K GS, Mamtaz H, Mukhopadhyay A, Bhadra M. High
prevalence of undernutrition among adult Kora Mudi tribals
of Bankura District, West Bengal, India. Anthropological
Sciences 2006;114:65-8.
[18] AAO. Identification of underweight women by
measurement of the arm circumference. International
Journal of Gynecology and Obstetrics 1990;31:231-5.
[19] Rodrigues VC RR, Lena A. . Utility of arm circumference as
a screening instrument to identify women at nutritional risk.
Tropical Doctor1994;24:164-6.
[20] India Go. Census of India. (Online) 2001.
http:/wwwcensusindiagovin 2010.
[21] K. B. Generalised obesity and regional adiposity in adult
White and migrant Muslim males from Pakistan in
Peterborough. Journal of Royal Society of Health
1996;116:161-7.
[22] Deurenberg P YM, van Staveren WA. Body mass index and
percent body fat: a meta- analysis among different ethnic
groups. International Journal of Obesity Related Metabolic
Disorder 1998;22(12):1164.
[23] Calverton M, USA, Central Statistical Agency Ethiopia
Ethiopia Demographic and Health Survey 2011. Central
Statistical Agency and ICF International2012:152-88.