Contenu connexe
Similaire à Textura q1 15 earnings release presentation v4
Similaire à Textura q1 15 earnings release presentation v4 (20)
Textura q1 15 earnings release presentation v4
- 1. 1©2015 Textura Corporation
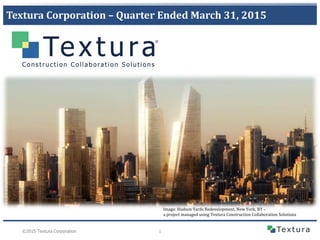
Textura Corporation – Quarter Ended March 31, 2015
Image: Hudson Yards Redevelopment, New York, NY –
a project managed using Textura Construction Collaboration Solutions
- 2. 2©2015 Textura Corporation
Safe Harbor
This presentation includes forward-looking statements, including statements regarding our future financial performance, market
growth, total addressable market, demand for our solutions, and general business conditions and outlook. Any forward looking
statements contained in this presentation are based upon our historical performance and our current expectations and
projections about future events and financial trends affecting the financial condition of our business. These forward-looking
statements should not be read as a guarantee of future performance or results, and will not necessarily be accurate indications of
the times at, or by, which such performance or results will be achieved. These forward-looking statements are based on
information available to us as of April 30, 2015, and are subject to risks and uncertainties that could cause actual performance or
results to differ materially from those expressed in or suggested by the forward-looking statements. Important factors that could
cause such differences include, but are not limited to, trends in the global and domestic economy and the commercial
construction industry; our ability to effectively manage our growth; our ability to develop the market for our solutions;
competition with our business; abnormal severe winter weather conditions; our dependence on a limited number of client
relationships for a significant portion of our revenues; our dependence on a single software solution for a substantial portion of
our revenues; the length of the selling cycle to secure new enterprise relationships for our CPM solution, which requires
significant investment of resources; our ability to cross-sell our solutions; the continued growth of the market for on-demand
software solutions; our ability to develop and bring to market new solutions in a timely manner; our success in expanding our
international business and entering new industries; and the availability of suitable acquisitions or partners and our ability to
achieve expected benefits from such acquisitions or partnerships. Forward-looking statements speak only as of April 30, 2015,
and we assume no obligation to update forward-looking statements to reflect actual results, changes in assumptions or changes
in other factors affecting forward-looking information, except to the extent required by applicable laws. If we update one or more
forward-looking statements, no inference should be drawn that we will make additional updates with respect to those or other
forward-looking statements. Further information on potential factors that could affect actual results is included under the
heading “Risk Factors” in our Annual Report on Form 10-K for the fiscal year ended December 31, 2014 filed on March 6, 2015,
and our other reports filed with the SEC.
This presentation should be read in conjunction with our Q1 2015 Earnings Release on our Investor Relations website at
investors.texturacorp.com.
In addition to U.S. GAAP financial information, this presentation includes certain non-GAAP financial measures. These historical
and forward-looking non-GAAP measures are in addition to, not a substitute for or superior to, measures of financial
performance prepared in accordance with GAAP. A reconciliation between GAAP and non-GAAP measures is included in our Q1
2015 Earnings Release on our Investor Relations website at investors.texturacorp.com, and at the end of this presentation.
- 3. 3©2015 Textura Corporation
Q1 2015 Highlights – Continuing to Execute our Strategy
• Year-over-year revenue growth of 39% (all organic)
• Revenue of $19.2MM and billings of $21.5MM (36% year-over-year growth)
• Approximately $167B in construction value active on our solutions
Strong Revenue
Growth
Growth Strategy
• Improving Adjusted EBITDA, EPS and cash flow trajectory
• Adjusted EBITDA of $0.9MM, Adjusted EPS of $0.00 vs. ($0.16) in Q1 2014
• Positive operating cash flow for fourth consecutive quarter
• 8% Adjusted Operating Expense year-over-year increase
• Increased functionality and expanding market penetration
• EPP roll-out in April 2015
• Continuing to invest in the development of our solution suite
• Continued focus on international growth strategy
Expense Trends
and Operating
Leverage
Balance Sheet
• $67.5MM cash position at March 31, 2015
• Ample liquidity to fund our growth initiatives
- 4. 4©2015 Textura Corporation
Consistently High Growth Rates
86% 70% 54%
Year-over-year growth
65% 72% 77% 61% 60% 51% 49% 39%
Year-over-year growth
38% 45% 49% 46% 52% 43% 44% 39% 60% 45% 46%
Year-over-year organic growth Year-over-year organic growth
$24.0
$40.8
$63.0
FY 2012 FY 2013 FY 2014
$9.4
$10.9
$12.0
$13.8
$15.0
$16.4
$17.9
$19.2
Jun 13 Sep 13 Dec 13 Mar 14 Jun 14 Sep 14 Dec 14 Mar 15
- 5. 5©2015 Textura Corporation
2015 Guidance
• 37 – 44% year-over-year revenue growth
• $20.5 – $21.5MM
• Adjusted EPS of $0.02– $0.04
• Excludes stock based comp of $2.6MM & amortization of acquired
intangible assets of $1.1MM
• Assumes ~25.8MM weighted-average shares outstanding
Quarter Ending
June 30, 2015
Year Ending
December 31,
2015
• 40 – 46% year-over-year revenue growth
• $88.0 – $92.0MM
• Adjusted EPS of $0.15 – $0.20
• Excludes stock based comp of $9.7MM & amortization of acquired
intangible assets of $4.2MM
• Assumes ~25.9MM weighted-average shares outstanding
• Cash flow from operations of $16 to $20 million
- 6. 6©2015 Textura Corporation
Long-term Operating Model Yields Attractive Margins
March
2014
June
2014
Sept
2014
Dec
2014
March
2015 2013 2014
Guidance
2015
Target
Model
Revenue ($MMs) 13.8$ 15.0$ 16.4$ 17.9$ 19.2$ 40.8$ 63.0$ $88 - 92 $150 - 180
Adjusted Operating Expenses as a % of revenue:*
Cost of services 20% 19% 18% 18% 18% 22% 19% 10 - 13%
General and administrative 34% 36% 31% 29% 28% 44% 32% 13 - 15%
Sales and marketing 33% 29% 29% 27% 26% 30% 29% 17 - 20%
Technology and development 37% 31% 28% 24% 23% 41% 30% 15 - 17%
Total Adjusted Operating Expenses, excluding
depreciation and amortization 124% 115% 106% 98% 95% 137% 110% 55 - 65%
Adjusted Gross Margin 80% 81% 82% 82% 82% 78% 82% 87 - 90%
Adjusted EBITDA margin** (24%) (15%) (6%) 2% 4% (37%) (10%) 10 - 11% 35 - 45%
**Adjusted EBITDA represents revenueless Adjusted OperatingExpenses, excludingdepreciation and amortization.
*Adjusted OperatingExpenses is calculated as total operatingexpenses adjusted for share-based compensation expense, amortization expense, severanceexpense, and
acquisition-related and other expenses recognized duringtheperiod.
Fiscal YearQuarter
- 8. 8©2015 Textura Corporation
Quarter Ended March 31, 2015
GAAP
Share-Based
Compensation
and
Amortization of
Intangible
Assets As Adjusted
% of
Revenue
Revenues 19,201$ -$ 19,201$ 100%
Operating expenses
Cost of services 3,578 187 3,391 18%
General and administrative 6,832 1,316 5,516 28%
Sales and marketing 5,193 266 4,927 26%
Technology and development 4,709 202 4,507 23%
Depreciation and amortization 1,876 1,053 823 4%
Total operating expenses 22,188 3,024 19,164 100%
Total operating expenses, excluding
depreciation and amortization
20,312 1,971 18,341 96%
Loss from operations (2,987) (3,024) 37
Total other expense, net 4 - 4
Loss before income taxes (2,983) (3,024) 41
Income tax provision 84 - 84
Net loss (3,067)$ (3,024)$ (43)$
Gross profit 15,623$ 15,810$
Gross margin 81% 82%
Adjusted EBITDA* 860$
Adjusted EBITDA Margin 4%
*Adjusted EBITDA represents revenue less Adjusted Operating Expenses, excluding depreciation and amortization.
(dollars in thousands)
- 9. 9©2015 Textura Corporation
Adjusted EPS – Year over Year
March 31, 2015 March 31, 2014
Net loss per share (0.12)$ (0.30)$
Accretion of redeemable non-controlling interest - 0.01
Share-based compensation expense 0.08 0.08
Amortization of intangible assets 0.04 0.05
Adjusted EPS 0.00$ (0.16)$
Three Months Ended
- 10. 10©2015 Textura Corporation
Quarter Ended March 31, 2014
GAAP
Share-Based
Compensation
and
Amortization of
Intangible
Assets
Other Non-
Recurring
Expenses* As Adjusted
% of
Revenue
Revenues 13,787$ -$ -$ 13,787$ 100%
Operating expenses
Cost of services 2,882 152 - 2,730 20%
General and administrative 6,055 1,191 74 4,790 34%
Sales and marketing 4,843 312 - 4,531 33%
Technology and development 5,356 281 - 5,075 37%
Depreciation and amortization 1,886 1,282 - 604 4%
Total operating expenses 21,022 3,218 74 17,730 129%
Total operating expenses, excluding
depreciation and amortization
19,136 1,936 74 17,126 124%
Loss from operations (7,235) (3,218) (74) (3,943)
Total other expense, net (25) - - (25)
Loss before income taxes (7,260) (3,218) (74) (3,968)
Income tax provision 80 - - 80
Net loss (7,340)$ (3,218)$ (74)$ (4,048)$
Gross profit 10,905$ 11,057$
Gross margin 79% 80%
Adjusted EBITDA** (3,339)$
Adjusted EBITDA Margin (24%)
*Other non-recurring expenses represent acquisition-related costs.
**Adjusted EBITDA represents revenue less Adjusted Operating Expenses, excluding depreciation and amortization.
(dollars in thousands)
- 11. 11©2015 Textura Corporation
Quarter Ended June 30, 2014
GAAP
Share-Based
Compensation
and
Amortization of
Intangible
Assets As Adjusted
% of
Revenue
Revenues 14,965$ -$ 14,965$ 100%
Operating expenses
Cost of services 3,028 156 2,872 19%
General and administrative 6,473 1,049 5,424 36%
Sales and marketing 4,663 324 4,339 29%
Technology and development 4,819 301 4,518 31%
Depreciation and amortization 1,962 1,282 680 5%
Total operating expenses 20,945 3,112 17,833 119%
Total operating expenses, excluding
depreciation and amortization
18,983 1,830 17,153 115%
Loss from operations (5,980) (3,112) (2,868)
Total other expense, net (8) - (8)
Loss before income taxes (5,988) (3,112) (2,876)
Income tax provision 80 - 80
Net loss (6,068)$ (3,112)$ (2,956)$
Gross profit 11,937$ 12,093$
Gross margin 80% 81%
Adjusted EBITDA* (2,188)$
Adjusted EBITDA Margin (15%)
*Adjusted EBITDA represents revenue less Adjusted Operating Expenses, excluding depreciation and amortization.
(dollars in thousands)
- 12. 12©2015 Textura Corporation
Quarter Ended September 30, 2014
GAAP
Share-Based
Compensation
and
Amortization of
Intangible
Assets
Other Non-
Recurring
Expenses* As Adjusted
% of
Revenue
Revenues 16,354$ -$ -$ 16,354$ 100%
Operating expenses
Cost of services 3,335 90 344 2,901 18%
General and administrative 6,232 1,049 120 5,063 31%
Sales and marketing 5,869 586 592 4,691 29%
Technology and development 6,366 913 802 4,651 28%
Depreciation and amortization 1,990 1,282 - 708 4%
Total operating expenses 23,792 3,920 1,858 18,014 110%
Total operating expenses, excluding
depreciation and amortization
21,802 2,638 1,858 17,306 106%
Loss from operations (7,438) (3,920) (1,858) (1,660)
Total other expense, net (22) - - (22)
Loss before income taxes (7,460) (3,920) (1,858) (1,682)
Income tax provision 80 - - 80
Net loss (7,540)$ (3,920)$ (1,858)$ (1,762)$
Gross profit 13,019$ 13,453$
Gross margin 80% 82%
Adjusted EBITDA** (952)$
Adjusted EBITDA Margin (6%)
*Other non-recurring expenses include severance expense and acquisition-related and other expenses. Acquisition-related
and other expenses represent acquisition, strategic transaction and certain tax-related costs.
**Adjusted EBITDA represents revenue less Adjusted Operating Expenses, excluding depreciation and amortization.
(dollars in thousands)
- 13. 13©2015 Textura Corporation
Quarter Ended December 31, 2014
GAAP
Share-Based
Compensation
and
Amortization of
Intangible
Assets
Other Non-
Recurring
Expenses* As Adjusted
% of
Revenue
Revenues 17,862$ -$ -$ 17,862$ 100%
Operating expenses
Cost of services 3,606 196 275 3,135 18%
General and administrative 6,489 1,328 45 5,116 29%
Sales and marketing 5,143 279 - 4,864 27%
Technology and development 4,490 168 - 4,322 24%
Depreciation and amortization 1,903 1,131 - 772 4%
Total operating expenses 21,631 3,102 320 18,209 102%
Total operating expenses, excluding
depreciation and amortization
19,728 1,971 320 17,437 98%
Loss from operations (3,769) (3,102) (320) (347)
Total other expense, net (8) - - (8)
Loss before income taxes (3,777) (3,102) (320) (355)
Income tax provision 130 - - 130
Net loss (3,907)$ (3,102)$ (320)$ (485)$
Gross profit 14,256$ 14,727$
Gross margin 80% 82%
Adjusted EBITDA** 425$
Adjusted EBITDA Margin 2%
*Other non-recurring expenses include severance expense and acquisition-related and other expenses. Acquisition-related
and other expenses represent acquisition, strategic transaction and certain tax-related costs.
**Adjusted EBITDA represents revenue less Adjusted Operating Expenses, excluding depreciation and amortization.
(dollars in thousands)
- 14. 14©2015 Textura Corporation
Year Ended December 31, 2013
GAAP
Share-Based
Compensation
and
Amortization
of Intangible
Assets
Other Non-
Recurring
Expenses* As Adjusted
% of
Revenue
Revenues 40,766$ -$ -$ 40,766$ 100%
Operating expenses
Cost of services 12,808 2,198 1,446 9,164 22%
General and administrative 25,152 5,700 1,501 17,951 44%
Sales and marketing 15,153 2,789 308 12,056 30%
Technology and development 20,820 2,863 1,288 16,669 41%
Depreciation and amortization 5,325 3,397 - 1,928 5%
Total operating expenses 79,258 16,947 4,543 57,768 142%
Total operating expenses, excluding
depreciation and amortization
73,933 13,550 4,543 55,840 137%
Loss from operations (38,492) (16,947) (4,543) (17,002)
Total other expense, net (2,530) - - (2,530)
Loss before income taxes (41,022) (16,947) (4,543) (19,532)
Income tax provision (767) (1,086) 319
Net loss (40,255)$ (16,947)$ (3,457)$ (19,851)$
Gross profit 27,958$ 31,602$
Gross margin 69% 78%
Adjusted EBITDA** (14,923)$
Adjusted EBITDA Margin (37%)
*Other non-recurring expenses include offering-related expense and acquisition-related and other expenses. Acquisition-related
and other expenses represent acquisition, strategic transaction and certain tax-related costs.
**Adjusted EBITDA represents revenue less Adjusted Operating Expenses, excluding depreciation and amortization.
(dollars in thousands)
- 15. 15©2015 Textura Corporation
Year Ended December 31, 2014
GAAP
Share-Based
Compensation
and
Amortization
of Intangible
Assets
Other Non-
Recurring
Expenses* As Adjusted
% of
Revenue
Revenues 62,968$ -$ -$ 62,968$ 100%
Operating expenses
Cost of services 12,851 594 619 11,638 19%
General and administrative 25,249 4,617 239 20,393 32%
Sales and marketing 20,518 1,501 592 18,425 29%
Technology and development 21,031 1,663 802 18,566 30%
Depreciation and amortization 7,741 4,977 - 2,764 4%
Total operating expenses 87,390 13,352 2,252 71,786 114%
Total operating expenses, excluding
depreciation and amortization
79,649 8,375 2,252 69,022 110%
Loss from operations (24,422) (13,352) (2,252) (8,818)
Total other expense, net (63) - - (63)
Loss before income taxes (24,485) (13,352) (2,252) (8,881)
Income tax provision 370 370
Net loss (24,855)$ (13,352)$ (2,252)$ (9,251)$
Gross profit 50,117$ 51,330$
Gross margin 80% 82%
Adjusted EBITDA** (6,054)$
Adjusted EBITDA Margin (10%)
*Other non-recurring expenses include severance expense, offering-related expense and acquisition-related and other expenses.
Acquisition-related and other expenses represent acquisition, strategic transaction and certain tax-related costs.
**Adjusted EBITDA represents revenue less Adjusted Operating Expenses, excluding depreciation and amortization.
(dollars in thousands)
- 16. 16©2015 Textura Corporation
Guidance
High End Low End High End Low End
Net loss per share (0.10)$ (0.12)$ (0.33)$ (0.38)$
Share-based compensation expense 0.10 0.10 0.37 0.37
Amortization of intangible assets 0.04 0.04 0.16 0.16
Adjusted EPS 0.04$ 0.02$ 0.20$ 0.15$
Three Months Ended
June 30, 2015
Twelve Months Ended
December 31, 2015