SlideShare une entreprise Scribd logo
1  sur  19
LESSON 13COST AND OUTPUT RELATIONSHIP


                                 Learning outcomes

  After            studying this unit, you should be able to:

                   relate the concepts of production and costs
                   define     different types of cost relevant for         production
                   planning and control

                              distinguish between economic costs
             and              accounting costs identify the sources of
                   costs
                              indication of cost concept


                              INTRODUCTION

In       theprevious chapterwe have illustrated the concept of production. And in this
lesson I amgoing to tell youabout the cost and its related factors. You will also come to
know aboutcost and outputrelationship. Cost and revenue are the two major
factors    that    a    profit maximising firm needs to monitor continuously. It is the
level of cost relative torevenue that determines the firm’s overall profitability. In
order to maximise profits, afirm tries to increase its revenue and lower its cost. While
the market factors determinethe level of revenue to a great extent, the cost can be
brought down either byproducing the optimum level of output using the least
cost combination of inputs, or increasing factor productivities, or by improving the
organisational efficiency. The firm’s output level is determined by its cost.
                                    The producer has to pay for factors of production for
their services. The expenses incurred on these factors of production are known as the cost
of production, or in short cost.

Product prices are determined by the interaction of the forces of demand
and supply. The basic factor underlying the ability and willingness of firms to
supply a product in the market is the cost of production. Thus, cost of production
provides the floor to pricing. It is the cost that forms the basis for many
managerial decisions like which price to quote, whether to accept a particular
order or not, whether to abandon or add a product to the existing product line,
whether or not to increase the volume of output, whether to use idle
capacity or rent out the facilities, whether to make or buy a product, etc.
However, it is essential to underline here that all costs are not
relevant for every decision under consideration.
The purpose of this unit is to explore cost and its relevance to decision-making.
We begin by developing the important cost concepts, an understanding of which can
aid managers in making correct decisions. We shall examine the difference between
economic and accounting concepts of costs and profits. We shall then consider the
concepts of short-run and long-run costs and show that they, in conjunction
with the concepts of production studies in the preceding unit, can
give us a more complete understanding of the applications of cost theory
to decision-making.


VARIOUS TYPES OF COSTS


There are different types of costs that a firm may consider relevant for decision-
making under varying situations. The manner in which costs are classified
or defined is largely dependent on the purpose for which the cost data
are being outlined.

Explicit and Implicit Costs
The opportunity cost (or cost of the foregone alternative) of a resource is a
definition cost in the most basic form. While this particular definition of cost is the
preferred baseline for economists in describing cost, not all costs in decision-
making situations are completely obvious; one of the skills of a good manager is the
ability to uncover hidden costs. for dissimilar purposes. Traditionally, the
accountants have been primarily connected with collection of historical cost data for
use in reporting a firm’s financial behaviour and position and in calculating its
taxes.They report or record what was happened, present information that will
protect the interests of various shareholders in the firm, and provide
standards against which performance can be judged. All these have only
indirect relationship to decision-making. Business economists, on the other
hand, have been primarily concerned with using cost data in decisions
making. These purposes call for different types of cost data and classification.

For example, the opportunity cost of a student’s doing a full time MBA could be
the income that he would have earned if he had employed his labour resources
on a job, rather than spending them in studying managerial
economics, accounting, and so on. The time cost in money terms can be
referred to as implicit cost of doing an MBA.

The out-of-pocket costs on tuition and teaching materials are the explicit
costs that a student incurs while attending MBA. Thus, the total cost of doing an
MBA to a student is implicit costs (opportunity cost) plus the explicit (out-
of-pocket) costs.

Direct and Indirect Costs
There are some costs which can be directly attributed to production of a
given product.
The use of raw material, labour input, and machine time involved in
the production of each unit can usually be determined. On the other hand, there are
certain costs like stationery and other office and administrative expenses,
electricity charges, depreciation of plant and buildings, and other such expenses
that cannot easily and accurately be separated and attributed to individual units
of production, except on arbitrary basis. When referring to the separable costs of
first category accountants call them the direct, or prime costs per unit. The joint
costs of the second category are referred to as indirect or overhead costs by the
accountants. Direct and indirect costs are not exactly synonymous to what
economists refer to as variable costs and fixed costs.

Private Costs versus Social Costs
Private costs are those that accrue directly to the individuals or firms engaged in
relevant activity. External costs, on the other hand, are passed on to persons not
involved in the activity in any direct way (i.e., they are passed on to society
at large). While the private cost to the firm of dumping is zero, it is definitely positive
to the society. It affects adversely the people located down current who are
adversely affected and incur higher costs in terms of treating the water for their use,
or having to travel a great deal to fetch potable water. If these external costs were
included in the production costs of the producing firm a true picture of real, or social
costs of the output would be obtained. Ignoring external costs may lead to an
inefficient and undesirable allocation of resources in society.

Relevant Costs and Irrelevant Costs
The relevant costs for decision-making purposes are those costs which are
incurred as a result of the decision under consideration and which are relevant
for the business purpose. The relevant costs are also referred to as
the incremental costs.
There are three main categories of relevant or incremental costs. These are the
present-period explicit costs, the opportunity costs implicitly involved in the
decision, and the future cost implications that flow from the decision. For
example, direct labour and material costs, and changes in the variable overhead
costs are the natural consequences of a decision to increase the output level.
Many decisions will have implications for future costs, both explicit and implicit. If
a firm expects to incur some costs in future as a consequence of the
present analysis, such future costs should be included in the present
value terms if known for certain.

Economic Costs and Profits
Accounting profits are the firm’s total revenue less its explicit costs.
But according to economists profit is different. Economic profits are total revenue
less all costs (explicit and implicit, the latter including a normal profit required to
retain resources in a given line of production). Therefore, when an economist
says that a firm is just covering its costs. It is meant that all explicit and implicit
costs are being met, and that, the entrepreneur is receiving a return just large
enough to retain his or her talents in the present line of production. If a firm’s
total receipts exceed all its economic costs, the residual accruing to the
entrepreneur is called an economic, or pure profit. In short:

Economic Profit = Total Revenue-Opportunity Cost of all Inputs
This is depicted in the following figure :
                           Economic Profits                                            Accounting Profit
Total Revenue              Economic or Opportunity                                     Accounting Costs
                           Cost
                           (Explicit plus implicit
                           costs,

                                          including a normal profit)

An economic profit is not a cost, because by definition it is a return in excess of
the normal profit required to retain the entrepreneur in a particular line of
production.

Separable and Common Costs
Costs can also be classified on the basis of their tractability. The costs that can be
easily attributed to a product, a division, or a process are called separable
costs, and the rest are called non-separable or common costs. The separable
and common costs are also referred to as direct and indirect costs. The
distinction between direct and indirect costs is of particular significance in a multi-
product firm for setting up economic prices for different products.

Fixed and Variable costs
Fixed costs are those costs which in total do not vary with changes in
output. Fixed costs are associated with the very existence of a firm’s rate of
output is zero. Such costs as interest on borrowed capital, rental payments, a
portion of depreciation charges on equipment and buildings, and the
salaries of top management and key personnel are generally fixed costs.

On the other hand, variable costs are those costs which increase with the level of
output. They include payment for raw materials, charges on fuel and electricity,
wages and salaries of temporary staff, depreciation charges associated
with wear and tear of this distinctions true only for the short-run. It is similar to
the distinction that we made in the previous unit between fixed and variable
factors of production under the short-run production analysis. The costs
associated with fixed factors are called the fixed costs and the ones
associated with variable factors, the variable costs. Thus, if capital is the
fixed factor, capital rental is taken as the fixed cost and if labour is the variable
factor, wage bill is treated as the variable cost.

Activity :-
a) Can you give specific examples of: Implicit
     costs:
..............................................................................................................................
     Social costs:
...............................................................................................................................
Directcosts:
................................................................................................................................
     IndirectCosts:
.............................................................................................................................
    Sunkcosts:
.................................................................................................................................
.
    Traceablecosts:
..........................................................................................................................
    Commoncosts:
............................................................................................................................


RELATIONSHIP BETWEEN PRODUCTION AND COSTS

The cost is closely related to production theory. A cost function is the relationship
between a firm’s costs and the firm’s output. While the production function
specifies the technological maximum quantity of output that can be
produced from various combinations of inputs, the cost function combines this
information with input price data and gives information on various outputs
and their prices. The cost function can thus be thought of as a combination of
the two pieces of information i.e., production function and input prices
Now consider a short-run production function with only one variable input.
The output grows at an increasing rate in the initial stages implying increasing
retunes to the variable input, and then diminishing returns to the variable
input start. Assuming that the input prices remain constant, the above
production function will yield the variable cost function which has a shape
that is characteristic of many variable cost function; increasing at a decreasing
rate and then increasing at an increasing rate.

Relationship between average product and average costs, and marginal product
and marginal costs. For example.

TVC = Pr. V

AVC = TVC = Pr. V = Pr
Q               Q      Q/V
and MC = ∆TVC = Pr. ∆V
=                       Pr
                        ∆Q/∆
∆Q              ∆Q      V

Where Pr stands for the price of the variable factor and V stands for amount of
variable factor.

You may note that Pr being given, AVC is inversely related to the
average product of the variable factors.
In the same way, given the wage rage, MC is inversely related to the marginal
product of labour.

We shall explore this relationship in greater detail subsequently.

SHORT-RUN COST FUNCTIONS

During short run some factors are fixed and others are variable.The short-run is
normally defined as a time period over which some factors of production are fixed
and others are variable. Needless to emphasize here that these periods are not
defined by some specified length of time but, rather, are determined by
the variability of factors of production. Thus, what one firm may consider the
long-run may correspond to the short-run for another firm. Long run and short
run costs of every firms varies.

In the short-run, a firm incurs some costs that are associated with variable factors
and others that result from fixed factors. The former are called variable costs and
the latter represent fixed costs. Variable costs (VC) change as the level of output
changes and therefore can be expressed as a function of output (Q), that is VC = f
(Q). Variable costs typically include such things as raw material, labour, and
utilities. In Column 3 of Table 1, we find that the total of variable costs changes
directly with output. But note that the increases in variable costs associated with
each one-unit increase in output are not constant. As production begins, variable
costs will, for a time, increase by a decreasing amount, this is true through the fourth
unit of the output. Beyond the fourth unit, however, variable costs rise by increasing
amount for each successive unit of output. The explanation of this behaviour
of variable costs lies in the law of diminishing returns.
The following table will give you an idea about all

                                      Table I
  Total and Average-Cost Schedules for an Individual Firm in the Short-
                            Rum (Hypothetical Data in Rupees)
Total cost data, per week                Average-cost data, per week
(1)         (2)       (3)       (4)      (5)       (6)        (7)    (8)
                                                                     Margin
Total       Total     Total     Total    Average Average Average al
Product Fixed         variable cost      fixed     variable total    cost
            Cost      cost      (TC)     cost      cost       cost   (MC)
            (TFC)     (TVC)     TC =     (AFC)     (AVC)      (ATC)  MC =
                                TFC +    AFC =     AVC =      ATC =  change
                                TVC      TFC/Q     TVC/Q      TC/Q   in TC
                                                                     change
                                                                     in Q
0           100               0 100
1           100              90 190        100.00 90.00       190.00 90
2         100             170   270           50.00 85.00        135.00      80
3               100       240   340           33.33    80.00     113.33            70
4               100       300   400           25.00    75.00     100.00            60
5               100       370   470           20.00    74.00     94.00             70
6               100       450   550           16.67    75.00     91.67             80
7               100       540   640           14.29    77.14     91.43             90
8               100       650   750           12.50    81.25     93.75            110
9               100       780   880           11.11    86.25     97.78            130
10              100       930   1030          10.00    86.67     103.00           150
                                                       93.00


Total Cost
Total cost is the sum of fixed and variable cost at each level of output. It is shown
in column 4 of Table-1. At zero unit of output, total cost is equal to the firm’s fixed
cost. Then for each unit of production (through 1 to 10), total cost varies at the
same rate as does variable cost.
Per Unit, or Average Costs
Besides their total costs, producers are equally concerned with their per unit, or
average costs. In particular, average cost data is more relevant for making
comparisons with product price,

AVERAGE COST:
AC    =TC/Q Where
TC =total cost ;
        AC = average cost
          Q = quantity

Average Fixed Costs
Average fixed cost (AFC) is derived by dividing total fixed cost (TFC) by
the corresponding output (Q). That is
        TFC
AFC = ----- -
          Q
While total fixed cost is, by definition, independent of output, AFC will decline so
long as output increases. As output increases, a given total fixed cost of Rs. 100
is obviously being spread over a larger and larger output. This is what business
executives commonly refer to as ‘spreading the overhead’. We find in Figure-III
that the AFC curve is continuously declining as the output is increasing.
The shape of this curve is of an asymptotic hyperbola.

Average Variable Costs
Average variable cost (AVC) is found by dividing total variable cost (TVC) by the
corresponding output (Q):
TVC
AVC = ----- -
         Q

AVC declines initially, reaches a minimum, and then increases again,
AFC + AVC = ATC
∆ ATC
-------- - = MC
∆Q

Average Total Costs
Average total cost (ATC) can be found by dividing total cost (TC) by total output
(Q) or, by adding AFC and AVC for each level of output. That is:
         TC
ATC = ---- - = AFC + AVC
         Q

These data are shown in column 7 of the above Table.
Marginal Cost
Marginal cost (MC) is defined as the extra, or additional, cost of producing one more
unit of output. MC can be determined for each additional unit of output
simply by noting the change in total cost which that unit’s production entails:
       Change in TC∆TC
MC = ------------------ = -------- -
       Change in Q ∆Q

The marginal cost concept is very crucial from the manager’s point of view. Marginal
cost is a strategic concept because it designates those costs over which the firm has the
most direct control. More specifically, MC indicates those costs which are incurred in the
production of the last unit of output and therefore, also the cost which can be “saved” by
reducing total output by the last unit. Average cost figures do not provide this
information. A firm’s decisions as to what output level to produce is largely influenced
by its marginal cost. When coupled with marginal revenue, which indicates the change in
revenue from one more or one less unit of output, marginal cost allows a firm to
determine whether it is profitable to expand or contract its level of production.

Relationship of MC to AVC and ATC
It is also notable that marginal cost cuts both AVC and ATC at their
minimum (Figure III). When both the marginal and average variable costs are
falling, average will fall at a slower rate. And when MC and AVC are both rising, MC
will rise at a faster rate. As a result, MC will attain its minimum before the AVC. In
other words, when MC is less than AVC, the AVC will fall, and when MC exceeds
AVC, AVC will rise. This means (Figure III) that so long as MC lies below AVC, the
latter will fall and where MC is above AVC,AVC will rise. Therefore, at the
point of intersection where MC=AVC,AVC has just ceased to fall and attained its
minimum, but has not yet begun to rise. Similarly, the marginal cost curve cuts the
average total cost curve at the latter’s minimum point. This is because MC
can be defined as the addition either to total cost or to total cost or to total
variable cost resulting from one more unit of output. However, no such
relationship exists between MC and the average fixed cost, because the two are not
related; marginal cost by definition includes only those costs which change
with output, and fixed costs by definition are independent of output.
Managerial Uses of the Short-Run Cost Concepts
As already emphasized the relevant costs to be considered for decision-making
will differ from one situation to the other depending on the problem faced by the
manager. In general, the total cost concept is quite useful in finding out
the break-even quantity of output. The total cost concept is also used to
find out whether firm is making profits or not. The average cost concept is
important for calculating the per unit profit of a business firm. The marginal
and incremental cost concepts are essential to decide whether a firm
should expand its production or not.

LONG-RUN COST FUNCTIONS
Long-run total cost curves are derived from the long-run production functions in
which all inputs are variable. Such a production function is represented by
the five asquint curves showing five different levels of output. The five cost
curves tangent to these is equates at the points A,B,C,D and E represent total cost
on resources. Since the cost per unit of capital (v) and, labour (w) are assumed to
be constant, these five cost curves are parallel to one another, and the distance
between them is constant along the expansion path traced out by A,B,C,D and E.

Taking the values for total cost and output from the expansion path of Figure V
(the most efficient points), we can construct the following table for total cost and
output:


     Figure V EXPANSIONPATH AND RETURNS TO SCALE
LABOU
                                        R
Output                                                Long-run Total Cost
(Q)                                                                 (LTC)

                50                                                        150
                125                                                       200
                250                                                       250
                300                                                       300
                325                                                       350


These points are graphed in Figure VI as the long-run total cost (LTC) curve. The points
A,B,C,D and E correspond to the equilibrium points in Figure V. Note that the LTC
curve at first increases at a decreasing rate, then at a constant rate, and finally at an
increasing rate. The LTC curve starts from the origin implying thereby that in the long-
run all costs are variable and if nothing is produced, no resources will be used (i.e., the
firm will quit the industry altogether). Thus, the LTC curve is analogous to the short-run
VC curve. Only difference is, while the shape of VC is due to the law of variable
proportions in the short-run, the shape of LTC is due to the existence of increasing,
constant, and decreasing returns to scale in the long-run.
LONG-RUN TOTAL COST


 Unit Costs in the Long-Run
 In the long-run, costs are not divided into fixed and variable components; all costs are
 variable. Thus, the only long-run unit cost functions of interest are long-run average cost
 (LAC) and long-run marginal cost (LMC). These are defined as follows :

                       LTC
                       LAC = ------ -
                                    Q

                       ∆LTC
                          LMC = ---------- -
                       ∆Q

                       d (LTC)
                       LMC = ---------- -
                       dQ
                                                                        can be
For the long-run total cost given in Figure VI, these unit costs        presented
in tabular form as follows:

Output                 Long Run Total                Long Run           Long Run
Q Cost                                      Average Cost                 Marginal Cost
                          (LTC)                                        (LAC)                     (LMC)
                        0                                0                                  --                 --
                       50                              150                  3.00                             3.00
                      125                              200                  1.60                             0.67
                      250                              250                  1.00                             0.67
                      300                              300                  1.00                             1.00

                      325                              350                  1.08                             2.00

These LAC and LMC values are graphed in Figure VII. We see, both in the table
and in the graph, that LAC and LMC are U-shaped and that they are equal at the
minimum of LAC. The values of LMC are graphed at the midpoints of the output
intervals they represent.


                                    Figure VII Long-run average & marginal costs


Activity
a) Why are all costs variable in the long-run?
.................................................................................................................................
.......................................
.................................................................................................................................
.......................................
.................................................................................................................................
.......................................

b) Why is the LAC called an “enveloped curve”?
      Why cannot the LMC be can envelope as well?
.................................................................................................................................
.......................................
.................................................................................................................................
.......................................
.................................................................................................................................
.......................................

3) What do you understand by “cost-efficiency”?
   Draw a long-run cost diagram and explain.


2) Comment on the nature of costs involved in depreciation from both economic
and accounting standpoints.
.................................................................................................................................
.................................................................................................................................
.................................................................................................................................
.................................................................................................................................
........................................................................................................

3) Distinguish between historical costs and replacement costs. Why is this
distinction useful?
.................................................................................................................................
.................................................................................................................................
.................................................................................................................................
.................................................................................................................................
........................................................................................................

4) Give examples to distinguish between ‘fixed overheads’ and
‘variable overheads’.
.................................................................................................................................
.................................................................................................................................
.................................................................................................................................
.................................................................................................................................
........................................................................................................

5) Can all ‘direct costs’ be treated as ‘variable costs’?
.................................................................................................................................
.................................................................................................................................
...................................................... Activity
                                2                   3
Given Q = 100 + 0.L – 0.0005 L
Where Q is output; L is labour.

Suppose the wage rate is Rs. 10 and that 100 laborers are being employed.

Find the AVC and MC.
.................................................................................................................................
.................................................................................................................................
.................................................................................................................................
.................................................................................................................................
.................................................................................................................................
.................................................................................................................................
.

.................................................................................................................................
.................................................................................................................................
..................................................
Activity 3
     1) Fill in the blanks in the Table below.
     2) Take a separate graph paper and draw all the curves.

Sort-run Cost-Schedules


Q        TFC               TVC               TC                AFC            AVC              ATC              MC
1        50                                  55
2        50                8                                   25
3        50                                  60.5
4                          13
5        50                                  65
6        50                18                                                 3                11.34            3
7        50                                  72.5
8        50                28
9                                            86
10       50                45                                  5                               9.5              9
11       50                54.5                                4.55                            9.5              9.5
12       50                65.2
13       50                                  130
14       50                99.1
15       50                                  174.75
16       50                162
17       50                                  259.25
18                         269.5
19       50                                  399
20       50                450                                 2.5            22.5             25               101

-Output O is measured in 000 units
-All costs are measured in Rs. 000

Contenu connexe

Tendances

Tendances (20)

Cost concept and analysis
Cost concept and analysisCost concept and analysis
Cost concept and analysis
 
Relation between production and cost
Relation between production and costRelation between production and cost
Relation between production and cost
 
Cost analysis
Cost analysisCost analysis
Cost analysis
 
Long run average total costs Chapter 22
Long run average total costs Chapter 22Long run average total costs Chapter 22
Long run average total costs Chapter 22
 
production funcation
production funcationproduction funcation
production funcation
 
Cost & Revenue
Cost & RevenueCost & Revenue
Cost & Revenue
 
cost analysis
cost analysiscost analysis
cost analysis
 
Cost analysis
Cost analysisCost analysis
Cost analysis
 
Cost concept
Cost conceptCost concept
Cost concept
 
Cost analysis
Cost analysis Cost analysis
Cost analysis
 
Cost curves
Cost curvesCost curves
Cost curves
 
Managerial economics-CVP Analysis and AC,TC, MC cost curves
Managerial economics-CVP Analysis  and AC,TC, MC cost curvesManagerial economics-CVP Analysis  and AC,TC, MC cost curves
Managerial economics-CVP Analysis and AC,TC, MC cost curves
 
Managerial Economics
Managerial EconomicsManagerial Economics
Managerial Economics
 
Managerial Economics Cost PPT
Managerial Economics Cost PPTManagerial Economics Cost PPT
Managerial Economics Cost PPT
 
Concepts Of Cost
Concepts Of CostConcepts Of Cost
Concepts Of Cost
 
Theory of costs
Theory of costsTheory of costs
Theory of costs
 
Costs and revenues
Costs and revenuesCosts and revenues
Costs and revenues
 
Cost and Cost Concepts
Cost and Cost ConceptsCost and Cost Concepts
Cost and Cost Concepts
 
CONCEPTS OF COST
CONCEPTS OF COSTCONCEPTS OF COST
CONCEPTS OF COST
 
9 costs class
9 costs class9 costs class
9 costs class
 

Similaire à Cost n output relation

Accounting chapter-11
Accounting chapter-11Accounting chapter-11
Accounting chapter-11Gyanbikash
 
Business Economics - Unit-4 - Osmania University
Business Economics - Unit-4 - Osmania UniversityBusiness Economics - Unit-4 - Osmania University
Business Economics - Unit-4 - Osmania UniversityBalasri Kamarapu
 
Cost accounting
Cost accountingCost accounting
Cost accountingAmar Tomar
 
409881206-Full-project-komul-1-docx.pdf
409881206-Full-project-komul-1-docx.pdf409881206-Full-project-komul-1-docx.pdf
409881206-Full-project-komul-1-docx.pdfmanju192075
 
Cost accounting project on AMUL ice cream
Cost accounting project on AMUL ice creamCost accounting project on AMUL ice cream
Cost accounting project on AMUL ice creamAnjali Modi
 
104774114 mb0042-mb0042-–-managerial-economics-november-2012
104774114 mb0042-mb0042-–-managerial-economics-november-2012104774114 mb0042-mb0042-–-managerial-economics-november-2012
104774114 mb0042-mb0042-–-managerial-economics-november-2012yahoopankaj
 
Module 3 Economics VTU
Module 3 Economics VTUModule 3 Economics VTU
Module 3 Economics VTUIndependent
 
ARKA RAJ SAHA 27332020003.....pdf
ARKA RAJ SAHA 27332020003.....pdfARKA RAJ SAHA 27332020003.....pdf
ARKA RAJ SAHA 27332020003.....pdfARKARAJSAHA
 
COST EFFECTIVENES & COST ACCOUNTING
COST EFFECTIVENES & COST ACCOUNTINGCOST EFFECTIVENES & COST ACCOUNTING
COST EFFECTIVENES & COST ACCOUNTINGHrishikesh Kakde
 
Cost Concepts- CMA
Cost Concepts- CMACost Concepts- CMA
Cost Concepts- CMAZoha Qureshi
 

Similaire à Cost n output relation (20)

9 Cost analysis
9 Cost analysis9 Cost analysis
9 Cost analysis
 
Accounting chapter-11
Accounting chapter-11Accounting chapter-11
Accounting chapter-11
 
Cost analysis
Cost analysisCost analysis
Cost analysis
 
Business Economics - Unit-4 - Osmania University
Business Economics - Unit-4 - Osmania UniversityBusiness Economics - Unit-4 - Osmania University
Business Economics - Unit-4 - Osmania University
 
Student Name.docx
Student Name.docxStudent Name.docx
Student Name.docx
 
Cost theory
Cost theoryCost theory
Cost theory
 
Cost accounting
Cost accountingCost accounting
Cost accounting
 
409881206-Full-project-komul-1-docx.pdf
409881206-Full-project-komul-1-docx.pdf409881206-Full-project-komul-1-docx.pdf
409881206-Full-project-komul-1-docx.pdf
 
Cost analysis & Break even analysis
Cost analysis & Break even analysisCost analysis & Break even analysis
Cost analysis & Break even analysis
 
Cost analysis
Cost analysisCost analysis
Cost analysis
 
Cost accounting project on AMUL ice cream
Cost accounting project on AMUL ice creamCost accounting project on AMUL ice cream
Cost accounting project on AMUL ice cream
 
THEORY OF COST.pptx
THEORY OF COST.pptxTHEORY OF COST.pptx
THEORY OF COST.pptx
 
104774114 mb0042-mb0042-–-managerial-economics-november-2012
104774114 mb0042-mb0042-–-managerial-economics-november-2012104774114 mb0042-mb0042-–-managerial-economics-november-2012
104774114 mb0042-mb0042-–-managerial-economics-november-2012
 
Module 3 Economics VTU
Module 3 Economics VTUModule 3 Economics VTU
Module 3 Economics VTU
 
MSC in Finance.docx
MSC in Finance.docxMSC in Finance.docx
MSC in Finance.docx
 
ARKA RAJ SAHA 27332020003.....pdf
ARKA RAJ SAHA 27332020003.....pdfARKA RAJ SAHA 27332020003.....pdf
ARKA RAJ SAHA 27332020003.....pdf
 
COST EFFECTIVENES & COST ACCOUNTING
COST EFFECTIVENES & COST ACCOUNTINGCOST EFFECTIVENES & COST ACCOUNTING
COST EFFECTIVENES & COST ACCOUNTING
 
Lecture 2
Lecture 2Lecture 2
Lecture 2
 
Marginal costing
Marginal costingMarginal costing
Marginal costing
 
Cost Concepts- CMA
Cost Concepts- CMACost Concepts- CMA
Cost Concepts- CMA
 

Plus de Tinku Kumar

Commuication unit 1
Commuication unit 1Commuication unit 1
Commuication unit 1Tinku Kumar
 
Management principles and practices
Management principles and practices Management principles and practices
Management principles and practices Tinku Kumar
 
Non verbal communication
Non verbal communicationNon verbal communication
Non verbal communicationTinku Kumar
 
Minutes of the academic meeting
Minutes of the academic meetingMinutes of the academic meeting
Minutes of the academic meetingTinku Kumar
 
Executive communication completion
Executive communication completionExecutive communication completion
Executive communication completionTinku Kumar
 
Dyadic communication
Dyadic communicationDyadic communication
Dyadic communicationTinku Kumar
 
Barriers to communication
Barriers to communicationBarriers to communication
Barriers to communicationTinku Kumar
 
Business Finance Chapter 11 Risk and return
Business Finance Chapter 11 Risk and returnBusiness Finance Chapter 11 Risk and return
Business Finance Chapter 11 Risk and returnTinku Kumar
 
Business Finance Chapter 8
Business Finance Chapter 8Business Finance Chapter 8
Business Finance Chapter 8Tinku Kumar
 
Business Finance Chapter 10
Business Finance Chapter 10Business Finance Chapter 10
Business Finance Chapter 10Tinku Kumar
 
Business Finance Chapter 9
Business Finance Chapter 9Business Finance Chapter 9
Business Finance Chapter 9Tinku Kumar
 
Business Finance Chapter 7
Business Finance Chapter 7Business Finance Chapter 7
Business Finance Chapter 7Tinku Kumar
 
97044413 international-financial-management-11
97044413 international-financial-management-1197044413 international-financial-management-11
97044413 international-financial-management-11Tinku Kumar
 
97044292 international-financial-management-6
97044292 international-financial-management-697044292 international-financial-management-6
97044292 international-financial-management-6Tinku Kumar
 
76345446 foreign-exchange-management-act
76345446 foreign-exchange-management-act76345446 foreign-exchange-management-act
76345446 foreign-exchange-management-actTinku Kumar
 
72653145 international-financial-management-1
72653145 international-financial-management-172653145 international-financial-management-1
72653145 international-financial-management-1Tinku Kumar
 
71521831 international-financial-management-3
71521831 international-financial-management-371521831 international-financial-management-3
71521831 international-financial-management-3Tinku Kumar
 
63983288 foreign-exchange-management-act
63983288 foreign-exchange-management-act63983288 foreign-exchange-management-act
63983288 foreign-exchange-management-actTinku Kumar
 

Plus de Tinku Kumar (20)

Commuication unit 1
Commuication unit 1Commuication unit 1
Commuication unit 1
 
Management principles and practices
Management principles and practices Management principles and practices
Management principles and practices
 
Non verbal communication
Non verbal communicationNon verbal communication
Non verbal communication
 
Minutes of the academic meeting
Minutes of the academic meetingMinutes of the academic meeting
Minutes of the academic meeting
 
Executive communication completion
Executive communication completionExecutive communication completion
Executive communication completion
 
Dyadic communication
Dyadic communicationDyadic communication
Dyadic communication
 
Barriers to communication
Barriers to communicationBarriers to communication
Barriers to communication
 
Business Finance Chapter 11 Risk and return
Business Finance Chapter 11 Risk and returnBusiness Finance Chapter 11 Risk and return
Business Finance Chapter 11 Risk and return
 
Business Finance Chapter 8
Business Finance Chapter 8Business Finance Chapter 8
Business Finance Chapter 8
 
Business Finance Chapter 10
Business Finance Chapter 10Business Finance Chapter 10
Business Finance Chapter 10
 
Business Finance Chapter 9
Business Finance Chapter 9Business Finance Chapter 9
Business Finance Chapter 9
 
Business Finance Chapter 7
Business Finance Chapter 7Business Finance Chapter 7
Business Finance Chapter 7
 
Chapter 20 IFM
Chapter 20 IFMChapter 20 IFM
Chapter 20 IFM
 
97044413 international-financial-management-11
97044413 international-financial-management-1197044413 international-financial-management-11
97044413 international-financial-management-11
 
97044292 international-financial-management-6
97044292 international-financial-management-697044292 international-financial-management-6
97044292 international-financial-management-6
 
76345446 foreign-exchange-management-act
76345446 foreign-exchange-management-act76345446 foreign-exchange-management-act
76345446 foreign-exchange-management-act
 
72653145 international-financial-management-1
72653145 international-financial-management-172653145 international-financial-management-1
72653145 international-financial-management-1
 
71521831 international-financial-management-3
71521831 international-financial-management-371521831 international-financial-management-3
71521831 international-financial-management-3
 
63983288 foreign-exchange-management-act
63983288 foreign-exchange-management-act63983288 foreign-exchange-management-act
63983288 foreign-exchange-management-act
 
Chapter 20 IFM
Chapter 20 IFMChapter 20 IFM
Chapter 20 IFM
 

Cost n output relation

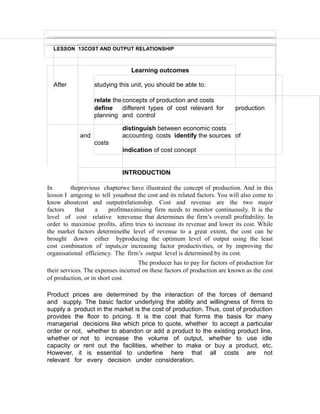
  • 1. LESSON 13COST AND OUTPUT RELATIONSHIP Learning outcomes After studying this unit, you should be able to: relate the concepts of production and costs define different types of cost relevant for production planning and control distinguish between economic costs and accounting costs identify the sources of costs indication of cost concept INTRODUCTION In theprevious chapterwe have illustrated the concept of production. And in this lesson I amgoing to tell youabout the cost and its related factors. You will also come to know aboutcost and outputrelationship. Cost and revenue are the two major factors that a profit maximising firm needs to monitor continuously. It is the level of cost relative torevenue that determines the firm’s overall profitability. In order to maximise profits, afirm tries to increase its revenue and lower its cost. While the market factors determinethe level of revenue to a great extent, the cost can be brought down either byproducing the optimum level of output using the least cost combination of inputs, or increasing factor productivities, or by improving the organisational efficiency. The firm’s output level is determined by its cost. The producer has to pay for factors of production for their services. The expenses incurred on these factors of production are known as the cost of production, or in short cost. Product prices are determined by the interaction of the forces of demand and supply. The basic factor underlying the ability and willingness of firms to supply a product in the market is the cost of production. Thus, cost of production provides the floor to pricing. It is the cost that forms the basis for many managerial decisions like which price to quote, whether to accept a particular order or not, whether to abandon or add a product to the existing product line, whether or not to increase the volume of output, whether to use idle capacity or rent out the facilities, whether to make or buy a product, etc. However, it is essential to underline here that all costs are not relevant for every decision under consideration.
  • 2. The purpose of this unit is to explore cost and its relevance to decision-making. We begin by developing the important cost concepts, an understanding of which can aid managers in making correct decisions. We shall examine the difference between economic and accounting concepts of costs and profits. We shall then consider the concepts of short-run and long-run costs and show that they, in conjunction with the concepts of production studies in the preceding unit, can
  • 3. give us a more complete understanding of the applications of cost theory to decision-making. VARIOUS TYPES OF COSTS There are different types of costs that a firm may consider relevant for decision- making under varying situations. The manner in which costs are classified or defined is largely dependent on the purpose for which the cost data are being outlined. Explicit and Implicit Costs The opportunity cost (or cost of the foregone alternative) of a resource is a definition cost in the most basic form. While this particular definition of cost is the preferred baseline for economists in describing cost, not all costs in decision- making situations are completely obvious; one of the skills of a good manager is the ability to uncover hidden costs. for dissimilar purposes. Traditionally, the accountants have been primarily connected with collection of historical cost data for use in reporting a firm’s financial behaviour and position and in calculating its taxes.They report or record what was happened, present information that will protect the interests of various shareholders in the firm, and provide standards against which performance can be judged. All these have only indirect relationship to decision-making. Business economists, on the other hand, have been primarily concerned with using cost data in decisions making. These purposes call for different types of cost data and classification. For example, the opportunity cost of a student’s doing a full time MBA could be the income that he would have earned if he had employed his labour resources on a job, rather than spending them in studying managerial economics, accounting, and so on. The time cost in money terms can be referred to as implicit cost of doing an MBA. The out-of-pocket costs on tuition and teaching materials are the explicit costs that a student incurs while attending MBA. Thus, the total cost of doing an MBA to a student is implicit costs (opportunity cost) plus the explicit (out- of-pocket) costs. Direct and Indirect Costs There are some costs which can be directly attributed to production of a given product. The use of raw material, labour input, and machine time involved in the production of each unit can usually be determined. On the other hand, there are certain costs like stationery and other office and administrative expenses, electricity charges, depreciation of plant and buildings, and other such expenses
  • 4. that cannot easily and accurately be separated and attributed to individual units of production, except on arbitrary basis. When referring to the separable costs of first category accountants call them the direct, or prime costs per unit. The joint costs of the second category are referred to as indirect or overhead costs by the accountants. Direct and indirect costs are not exactly synonymous to what economists refer to as variable costs and fixed costs. Private Costs versus Social Costs Private costs are those that accrue directly to the individuals or firms engaged in relevant activity. External costs, on the other hand, are passed on to persons not involved in the activity in any direct way (i.e., they are passed on to society at large). While the private cost to the firm of dumping is zero, it is definitely positive to the society. It affects adversely the people located down current who are adversely affected and incur higher costs in terms of treating the water for their use, or having to travel a great deal to fetch potable water. If these external costs were included in the production costs of the producing firm a true picture of real, or social costs of the output would be obtained. Ignoring external costs may lead to an inefficient and undesirable allocation of resources in society. Relevant Costs and Irrelevant Costs The relevant costs for decision-making purposes are those costs which are incurred as a result of the decision under consideration and which are relevant for the business purpose. The relevant costs are also referred to as the incremental costs. There are three main categories of relevant or incremental costs. These are the present-period explicit costs, the opportunity costs implicitly involved in the decision, and the future cost implications that flow from the decision. For example, direct labour and material costs, and changes in the variable overhead costs are the natural consequences of a decision to increase the output level. Many decisions will have implications for future costs, both explicit and implicit. If a firm expects to incur some costs in future as a consequence of the present analysis, such future costs should be included in the present value terms if known for certain. Economic Costs and Profits Accounting profits are the firm’s total revenue less its explicit costs. But according to economists profit is different. Economic profits are total revenue less all costs (explicit and implicit, the latter including a normal profit required to retain resources in a given line of production). Therefore, when an economist says that a firm is just covering its costs. It is meant that all explicit and implicit costs are being met, and that, the entrepreneur is receiving a return just large enough to retain his or her talents in the present line of production. If a firm’s total receipts exceed all its economic costs, the residual accruing to the entrepreneur is called an economic, or pure profit. In short: Economic Profit = Total Revenue-Opportunity Cost of all Inputs
  • 5. This is depicted in the following figure : Economic Profits Accounting Profit Total Revenue Economic or Opportunity Accounting Costs Cost (Explicit plus implicit costs, including a normal profit) An economic profit is not a cost, because by definition it is a return in excess of the normal profit required to retain the entrepreneur in a particular line of production. Separable and Common Costs Costs can also be classified on the basis of their tractability. The costs that can be easily attributed to a product, a division, or a process are called separable costs, and the rest are called non-separable or common costs. The separable and common costs are also referred to as direct and indirect costs. The distinction between direct and indirect costs is of particular significance in a multi- product firm for setting up economic prices for different products. Fixed and Variable costs Fixed costs are those costs which in total do not vary with changes in output. Fixed costs are associated with the very existence of a firm’s rate of output is zero. Such costs as interest on borrowed capital, rental payments, a portion of depreciation charges on equipment and buildings, and the salaries of top management and key personnel are generally fixed costs. On the other hand, variable costs are those costs which increase with the level of output. They include payment for raw materials, charges on fuel and electricity, wages and salaries of temporary staff, depreciation charges associated with wear and tear of this distinctions true only for the short-run. It is similar to the distinction that we made in the previous unit between fixed and variable factors of production under the short-run production analysis. The costs associated with fixed factors are called the fixed costs and the ones associated with variable factors, the variable costs. Thus, if capital is the fixed factor, capital rental is taken as the fixed cost and if labour is the variable factor, wage bill is treated as the variable cost. Activity :- a) Can you give specific examples of: Implicit costs: .............................................................................................................................. Social costs: ...............................................................................................................................
  • 6. Directcosts: ................................................................................................................................ IndirectCosts: ............................................................................................................................. Sunkcosts: ................................................................................................................................. . Traceablecosts: .......................................................................................................................... Commoncosts: ............................................................................................................................ RELATIONSHIP BETWEEN PRODUCTION AND COSTS The cost is closely related to production theory. A cost function is the relationship between a firm’s costs and the firm’s output. While the production function specifies the technological maximum quantity of output that can be produced from various combinations of inputs, the cost function combines this information with input price data and gives information on various outputs and their prices. The cost function can thus be thought of as a combination of the two pieces of information i.e., production function and input prices Now consider a short-run production function with only one variable input. The output grows at an increasing rate in the initial stages implying increasing retunes to the variable input, and then diminishing returns to the variable input start. Assuming that the input prices remain constant, the above production function will yield the variable cost function which has a shape that is characteristic of many variable cost function; increasing at a decreasing rate and then increasing at an increasing rate. Relationship between average product and average costs, and marginal product and marginal costs. For example. TVC = Pr. V AVC = TVC = Pr. V = Pr Q Q Q/V and MC = ∆TVC = Pr. ∆V = Pr ∆Q/∆ ∆Q ∆Q V Where Pr stands for the price of the variable factor and V stands for amount of variable factor. You may note that Pr being given, AVC is inversely related to the
  • 7. average product of the variable factors.
  • 8. In the same way, given the wage rage, MC is inversely related to the marginal product of labour. We shall explore this relationship in greater detail subsequently. SHORT-RUN COST FUNCTIONS During short run some factors are fixed and others are variable.The short-run is normally defined as a time period over which some factors of production are fixed and others are variable. Needless to emphasize here that these periods are not defined by some specified length of time but, rather, are determined by the variability of factors of production. Thus, what one firm may consider the long-run may correspond to the short-run for another firm. Long run and short run costs of every firms varies. In the short-run, a firm incurs some costs that are associated with variable factors and others that result from fixed factors. The former are called variable costs and the latter represent fixed costs. Variable costs (VC) change as the level of output changes and therefore can be expressed as a function of output (Q), that is VC = f (Q). Variable costs typically include such things as raw material, labour, and utilities. In Column 3 of Table 1, we find that the total of variable costs changes directly with output. But note that the increases in variable costs associated with each one-unit increase in output are not constant. As production begins, variable costs will, for a time, increase by a decreasing amount, this is true through the fourth unit of the output. Beyond the fourth unit, however, variable costs rise by increasing amount for each successive unit of output. The explanation of this behaviour of variable costs lies in the law of diminishing returns. The following table will give you an idea about all Table I Total and Average-Cost Schedules for an Individual Firm in the Short- Rum (Hypothetical Data in Rupees) Total cost data, per week Average-cost data, per week (1) (2) (3) (4) (5) (6) (7) (8) Margin Total Total Total Total Average Average Average al Product Fixed variable cost fixed variable total cost Cost cost (TC) cost cost cost (MC) (TFC) (TVC) TC = (AFC) (AVC) (ATC) MC = TFC + AFC = AVC = ATC = change TVC TFC/Q TVC/Q TC/Q in TC change in Q 0 100 0 100 1 100 90 190 100.00 90.00 190.00 90
  • 9. 2 100 170 270 50.00 85.00 135.00 80 3 100 240 340 33.33 80.00 113.33 70 4 100 300 400 25.00 75.00 100.00 60 5 100 370 470 20.00 74.00 94.00 70 6 100 450 550 16.67 75.00 91.67 80 7 100 540 640 14.29 77.14 91.43 90 8 100 650 750 12.50 81.25 93.75 110 9 100 780 880 11.11 86.25 97.78 130 10 100 930 1030 10.00 86.67 103.00 150 93.00 Total Cost Total cost is the sum of fixed and variable cost at each level of output. It is shown in column 4 of Table-1. At zero unit of output, total cost is equal to the firm’s fixed cost. Then for each unit of production (through 1 to 10), total cost varies at the same rate as does variable cost. Per Unit, or Average Costs Besides their total costs, producers are equally concerned with their per unit, or average costs. In particular, average cost data is more relevant for making comparisons with product price, AVERAGE COST: AC =TC/Q Where TC =total cost ; AC = average cost Q = quantity Average Fixed Costs Average fixed cost (AFC) is derived by dividing total fixed cost (TFC) by the corresponding output (Q). That is TFC AFC = ----- - Q While total fixed cost is, by definition, independent of output, AFC will decline so long as output increases. As output increases, a given total fixed cost of Rs. 100 is obviously being spread over a larger and larger output. This is what business executives commonly refer to as ‘spreading the overhead’. We find in Figure-III that the AFC curve is continuously declining as the output is increasing. The shape of this curve is of an asymptotic hyperbola. Average Variable Costs Average variable cost (AVC) is found by dividing total variable cost (TVC) by the corresponding output (Q):
  • 10. TVC
  • 11. AVC = ----- - Q AVC declines initially, reaches a minimum, and then increases again, AFC + AVC = ATC ∆ ATC -------- - = MC ∆Q Average Total Costs Average total cost (ATC) can be found by dividing total cost (TC) by total output (Q) or, by adding AFC and AVC for each level of output. That is: TC ATC = ---- - = AFC + AVC Q These data are shown in column 7 of the above Table. Marginal Cost Marginal cost (MC) is defined as the extra, or additional, cost of producing one more unit of output. MC can be determined for each additional unit of output simply by noting the change in total cost which that unit’s production entails: Change in TC∆TC MC = ------------------ = -------- - Change in Q ∆Q The marginal cost concept is very crucial from the manager’s point of view. Marginal cost is a strategic concept because it designates those costs over which the firm has the most direct control. More specifically, MC indicates those costs which are incurred in the production of the last unit of output and therefore, also the cost which can be “saved” by reducing total output by the last unit. Average cost figures do not provide this information. A firm’s decisions as to what output level to produce is largely influenced by its marginal cost. When coupled with marginal revenue, which indicates the change in revenue from one more or one less unit of output, marginal cost allows a firm to determine whether it is profitable to expand or contract its level of production. Relationship of MC to AVC and ATC It is also notable that marginal cost cuts both AVC and ATC at their minimum (Figure III). When both the marginal and average variable costs are falling, average will fall at a slower rate. And when MC and AVC are both rising, MC will rise at a faster rate. As a result, MC will attain its minimum before the AVC. In other words, when MC is less than AVC, the AVC will fall, and when MC exceeds AVC, AVC will rise. This means (Figure III) that so long as MC lies below AVC, the latter will fall and where MC is above AVC,AVC will rise. Therefore, at the point of intersection where MC=AVC,AVC has just ceased to fall and attained its minimum, but has not yet begun to rise. Similarly, the marginal cost curve cuts the average total cost curve at the latter’s minimum point. This is because MC
  • 12. can be defined as the addition either to total cost or to total cost or to total variable cost resulting from one more unit of output. However, no such relationship exists between MC and the average fixed cost, because the two are not related; marginal cost by definition includes only those costs which change with output, and fixed costs by definition are independent of output. Managerial Uses of the Short-Run Cost Concepts As already emphasized the relevant costs to be considered for decision-making will differ from one situation to the other depending on the problem faced by the manager. In general, the total cost concept is quite useful in finding out the break-even quantity of output. The total cost concept is also used to find out whether firm is making profits or not. The average cost concept is important for calculating the per unit profit of a business firm. The marginal and incremental cost concepts are essential to decide whether a firm should expand its production or not. LONG-RUN COST FUNCTIONS Long-run total cost curves are derived from the long-run production functions in which all inputs are variable. Such a production function is represented by the five asquint curves showing five different levels of output. The five cost curves tangent to these is equates at the points A,B,C,D and E represent total cost on resources. Since the cost per unit of capital (v) and, labour (w) are assumed to be constant, these five cost curves are parallel to one another, and the distance between them is constant along the expansion path traced out by A,B,C,D and E. Taking the values for total cost and output from the expansion path of Figure V (the most efficient points), we can construct the following table for total cost and output: Figure V EXPANSIONPATH AND RETURNS TO SCALE
  • 13. LABOU R Output Long-run Total Cost (Q) (LTC) 50 150 125 200 250 250 300 300 325 350 These points are graphed in Figure VI as the long-run total cost (LTC) curve. The points A,B,C,D and E correspond to the equilibrium points in Figure V. Note that the LTC curve at first increases at a decreasing rate, then at a constant rate, and finally at an increasing rate. The LTC curve starts from the origin implying thereby that in the long- run all costs are variable and if nothing is produced, no resources will be used (i.e., the firm will quit the industry altogether). Thus, the LTC curve is analogous to the short-run VC curve. Only difference is, while the shape of VC is due to the law of variable proportions in the short-run, the shape of LTC is due to the existence of increasing, constant, and decreasing returns to scale in the long-run.
  • 14. LONG-RUN TOTAL COST Unit Costs in the Long-Run In the long-run, costs are not divided into fixed and variable components; all costs are variable. Thus, the only long-run unit cost functions of interest are long-run average cost (LAC) and long-run marginal cost (LMC). These are defined as follows : LTC LAC = ------ - Q ∆LTC LMC = ---------- - ∆Q d (LTC) LMC = ---------- - dQ can be For the long-run total cost given in Figure VI, these unit costs presented in tabular form as follows: Output Long Run Total Long Run Long Run
  • 15. Q Cost Average Cost Marginal Cost (LTC) (LAC) (LMC) 0 0 -- -- 50 150 3.00 3.00 125 200 1.60 0.67 250 250 1.00 0.67 300 300 1.00 1.00 325 350 1.08 2.00 These LAC and LMC values are graphed in Figure VII. We see, both in the table and in the graph, that LAC and LMC are U-shaped and that they are equal at the minimum of LAC. The values of LMC are graphed at the midpoints of the output intervals they represent. Figure VII Long-run average & marginal costs Activity a) Why are all costs variable in the long-run? ................................................................................................................................. ....................................... ................................................................................................................................. .......................................
  • 16. ................................................................................................................................. ....................................... b) Why is the LAC called an “enveloped curve”? Why cannot the LMC be can envelope as well? ................................................................................................................................. ....................................... ................................................................................................................................. ....................................... ................................................................................................................................. ....................................... 3) What do you understand by “cost-efficiency”? Draw a long-run cost diagram and explain. 2) Comment on the nature of costs involved in depreciation from both economic and accounting standpoints. ................................................................................................................................. ................................................................................................................................. ................................................................................................................................. ................................................................................................................................. ........................................................................................................ 3) Distinguish between historical costs and replacement costs. Why is this distinction useful? ................................................................................................................................. ................................................................................................................................. ................................................................................................................................. ................................................................................................................................. ........................................................................................................ 4) Give examples to distinguish between ‘fixed overheads’ and ‘variable overheads’. ................................................................................................................................. ................................................................................................................................. ................................................................................................................................. ................................................................................................................................. ........................................................................................................ 5) Can all ‘direct costs’ be treated as ‘variable costs’? ................................................................................................................................. ................................................................................................................................. ...................................................... Activity 2 3 Given Q = 100 + 0.L – 0.0005 L
  • 17. Where Q is output; L is labour. Suppose the wage rate is Rs. 10 and that 100 laborers are being employed. Find the AVC and MC. ................................................................................................................................. ................................................................................................................................. ................................................................................................................................. ................................................................................................................................. ................................................................................................................................. ................................................................................................................................. . ................................................................................................................................. ................................................................................................................................. .................................................. Activity 3 1) Fill in the blanks in the Table below. 2) Take a separate graph paper and draw all the curves. Sort-run Cost-Schedules Q TFC TVC TC AFC AVC ATC MC 1 50 55 2 50 8 25 3 50 60.5 4 13 5 50 65 6 50 18 3 11.34 3 7 50 72.5 8 50 28 9 86 10 50 45 5 9.5 9 11 50 54.5 4.55 9.5 9.5 12 50 65.2 13 50 130 14 50 99.1 15 50 174.75 16 50 162 17 50 259.25 18 269.5 19 50 399 20 50 450 2.5 22.5 25 101 -Output O is measured in 000 units -All costs are measured in Rs. 000
  • 18. Where Q is output; L is labour. Suppose the wage rate is Rs. 10 and that 100 laborers are being employed. Find the AVC and MC. ................................................................................................................................. ................................................................................................................................. ................................................................................................................................. ................................................................................................................................. ................................................................................................................................. ................................................................................................................................. . ................................................................................................................................. ................................................................................................................................. .................................................. Activity 3 1) Fill in the blanks in the Table below. 2) Take a separate graph paper and draw all the curves. Sort-run Cost-Schedules Q TFC TVC TC AFC AVC ATC MC 1 50 55 2 50 8 25 3 50 60.5 4 13 5 50 65 6 50 18 3 11.34 3 7 50 72.5 8 50 28 9 86 10 50 45 5 9.5 9 11 50 54.5 4.55 9.5 9.5 12 50 65.2 13 50 130 14 50 99.1 15 50 174.75 16 50 162 17 50 259.25 18 269.5 19 50 399 20 50 450 2.5 22.5 25 101 -Output O is measured in 000 units -All costs are measured in Rs. 000
  • 19. Where Q is output; L is labour. Suppose the wage rate is Rs. 10 and that 100 laborers are being employed. Find the AVC and MC. ................................................................................................................................. ................................................................................................................................. ................................................................................................................................. ................................................................................................................................. ................................................................................................................................. ................................................................................................................................. . ................................................................................................................................. ................................................................................................................................. .................................................. Activity 3 1) Fill in the blanks in the Table below. 2) Take a separate graph paper and draw all the curves. Sort-run Cost-Schedules Q TFC TVC TC AFC AVC ATC MC 1 50 55 2 50 8 25 3 50 60.5 4 13 5 50 65 6 50 18 3 11.34 3 7 50 72.5 8 50 28 9 86 10 50 45 5 9.5 9 11 50 54.5 4.55 9.5 9.5 12 50 65.2 13 50 130 14 50 99.1 15 50 174.75 16 50 162 17 50 259.25 18 269.5 19 50 399 20 50 450 2.5 22.5 25 101 -Output O is measured in 000 units -All costs are measured in Rs. 000