1. September 7, 2012
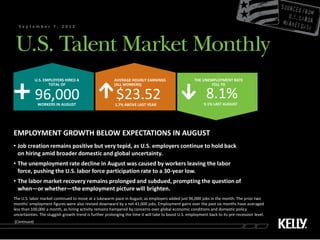
U.S. EMPLOYERS HIRED A AVERAGE HOURLY EARNINGS THE UNEMPLOYMENT RATE
TOTAL OF (ALL WORKERS) FELL TO
96,000
WORKERS IN AUGUST
$23.52
1.7% ABOVE LAST YEAR
8.1%
9.1% LAST AUGUST
EMPLOYMENT GROWTH BELOW EXPECTATIONS IN AUGUST
• Job creation remains positive but very tepid, as U.S. employers continue to hold back
on hiring amid broader domestic and global uncertainty.
• The unemployment rate decline in August was caused by workers leaving the labor
force, pushing the U.S. labor force participation rate to a 30-year low.
• The labor market recovery remains prolonged and subdued, prompting the question of
when—or whether—the employment picture will brighten.
The U.S. labor market continued to move at a lukewarm pace in August, as employers added just 96,000 jobs in the month. The prior two
months’ employment figures were also revised downward by a net 41,000 jobs. Employment gains over the past six months have averaged
less than 100,000 a month, as hiring activity remains hampered by concerns over global economic conditions and domestic policy
uncertainties. The sluggish growth trend is further prolonging the time it will take to boost U.S. employment back to its pre-recession level.
(Continued)