SlideShare une entreprise Scribd logo
1  sur  5
Télécharger pour lire hors ligne
May 2009
This pulse survey on relocation assistance provided to employees relocated within the U.S. is based on data collected
in April 2009. Of the 816 member organizations invited to participate in the online survey, 182 responded—a 22
percent response rate. Data pertains to employees relocated domestically within the U.S.

Just under half of organizations reported that their U.S. domestic transfer activity for both current employees and new
hires dropped between 2008 and 2007. About 70 percent anticipate further declines for both of these groups in activity
in 2009 from 2008. Just over half of organizations indicated having a hiring freeze currently in effect for at least non-
critical employees and virtually all of them reported that the freeze had taken affect within the last 12 months. Nearly
three-quarters of companies are experiencing problems with employee reluctance to relocate—41 percent cited
moderate to major problems. Of those experiencing problems, almost all of them indicated that the depressed housing
market was the major reason for employee reluctance to move.

Two-thirds of respondents provide homesale assistance. Looking for ways to help employees manage through a
difficult housing market, a small percentage of organizations (13 percent) with homesale programs offer property
management assistance to employees who are ineligible for the homesale program. Most companies assist at least
some employees with purchase closing costs when buying a home in the new location. However, it may be difficult to
buy a home right away in the current market and so transferees must rent for a period of time. When an employee
eventually does buy a home, the large majority of companies will still assist with the purchase closing costs but only if
the employee does so within 12 months of the relocation. Only 13 percent provide assistance with no time limit.

Approximately 70 percent of organizations have made changes to their policies within the last year—most of which
address challenges created by the housing market. Most commonly, these changes included: restriction on the listing
prices of homes being processed through the homesale program to a certain percentage of the company buyout offer,
extension of the temporary living period, the addition or enhancement of a homesale bonus for those employees who
find buyers for their homes, and restriction of the availability of the guaranteed buyout to selected employees.

1. Compared to 2007, was your organization’s 2008 U.S. domestic transfer volume for                          %
   current employees:                                                                                     (N=180)
           Significantly less                                                                               19%
             Somewhat less                                                                                  28%
             About the same                                                                                 30%
             Somewhat more                                                                                  17%
             Significantly more                                                                              6%
             Total                                                                                          100%


2. How do you anticipate your organization’s 2009 U.S. domestic transfer activity for                         %
   current employees will compare to 2008:                                                                 (N=179)
           Significantly less                                                                               36%
           Somewhat less                                                                                    35%
           About the same                                                                                   20%
           Somewhat more                                                                                     7%
           Significantly more                                                                                2%
           Total                                                                                            100%
                                  Copyright © 2009 by Worldwide ERC®. All rights reserved.
3. Compared to 2007, was your organization’s 2008 U.S. domestic transfer volume for              %
   new hires:                                                                                 (N=177)
           Significantly less                                                                   15%
              Somewhat less                                                                    27%
              About the same                                                                   41%
              Somewhat more                                                                    11%
              Significantly more                                                                7%
              Total                                                                           100%*
* Percentages do not total 100% due to rounding.

4. How do you anticipate your organization’s 2009 U.S. domestic transfer activity for            %
   new hires will compare to 2008:                                                            (N=177)
           Significantly less                                                                   40%
           Somewhat less                                                                        31%
           About the same                                                                       24%
           Somewhat more                                                                        6%
           Significantly more                                                                   1%
           Total                                                                               100%*
* Percentages do not total 100% due to rounding.

5. Estimate the percentage of your total 2008 U.S. domestic transfer volume that was:            %
                                                                                              (N=173)
              Current employees                                                                 58%
              New hires                                                                         42%
              Total                                                                            100%

6. Estimate the percentage of your total 2009 U.S. domestic transfer volume that will be:        %
                                                                                              (N=176)
              Current employees                                                                 63%
              New hires                                                                         37%
              Total                                                                            100%

7. Estimate the percentage of your total 2008 U.S. domestic transfer volume that was:            %
                                                                                              (N=171)
              Homeowners                                                                        58%
              Renters                                                                           42%
              Total                                                                            100%

8. Estimate the percentage of your total 2009 U.S. domestic transfer volume that will be:        %
                                                                                              (N=172)
              Homeowners                                                                        56%
              Renters                                                                           44%
              Total                                                                            100%

9. Is your organization experiencing any problems with respect to employees’ reluctance          %
   to accept transfers? Do not consider new hires.                                            (N=178)
            Yes, major problems                                                                 6%
            Yes, moderate problems                                                              35%
            Yes, minor                                                                          31%
            No                                                                                  28%
            Total                                                                              100%


                                   Copyright © 2009 by Worldwide ERC®. All rights reserved.
10. If yes, what are the major reasons for employees’ reluctance to accept transfers?            %*
                                                                                              (N=129)
              Slowed real estate appreciation/depressed housing market at old location          95%
              High housing cost areas                                                           29%
              Employee/family resistance to move                                                22%
              High cost-of-living areas                                                         19%
              Spouse reluctance to leave his/her job                                            16%
              Less than adequate relocation policy                                              9%
              Undesirable areas                                                                 4%
              Employee satisfaction with current position                                       1%
              Other                                                                             1%
* Percentages do not total 100% due to multiple responses.

11. Does your organization currently have a hiring freeze?                                       %
                                                                                              (N=179)
              Yes, for almost all critical and non-critical positions                           9%
              Yes, for non-critical positions but can hire for critical positions               42%
              No                                                                                47%
              Total                                                                            100%*
* Percentages do not total 100% due to rounding.

11. If yes, for how long has your organization been under a hiring freeze?                       %
                                                                                              (N=91)
              Less than 6 months                                                               55%
              6 -12 months                                                                     42%
              13 – 18 months                                                                    1%
              19 – 24 months                                                                    1%
              More than 2 years                                                                 1%
              Total                                                                            100%

12. Do you have a homesale program in which your organization or your organization’s             %
    relocation management company offers to purchase at least some employees’ homes?          (N=180)
             Yes                                                                                66%
             No                                                                                 34%
             Total                                                                             100%

13. If yes, does your company ever offer any assistance for property management to               %
    transferees whose homes are ineligible for the company’s homesale program?                (N=119)
             Yes, to all employees whose homes are ineligible for the homesale program          3%
             Yes, to certain employees (varies by policy tier, type of employee, etc.)          10%
             No                                                                                 87%
             Total                                                                             100%

14. If yes, for how long has your organization made property management assistance              %
    available to U.S. domestic transferees?                                                   (N=16)
              Less than 1 year                                                                 19%
              1 year                                                                           13%
              2 years                                                                          13%
              More than 2 years                                                                56%
              Total                                                                           100%*
* Percentages do not total 100% due to rounding.


                                   Copyright © 2009 by Worldwide ERC®. All rights reserved.
15. In general, are home-owning employees that move to the new location and rent for a
    period of time (e.g., having difficulty selling their homes in the old location) eligible for
    purchase closing cost assistance from your company when they eventually are able to                  %
    purchase a home?                                                                                  (N=179)
            Not applicable, company never assists transferees with purchase closing costs               6%
            No                                                                                          7%
            Yes, and there is no time limit imposed on how soon the employee must purchase a            13%
            home once they arrive in the new location
            Yes, but only if home is purchased within a specified period of time after the employee    73%
            moves to the new location. Average = 1 year; Most common = 1 year (117 cos.)
            Total                                                                                     100%*
* Percentages do not total 100% due to rounding.

16. In the past year, has your organization made any of the following changes to it’s                    %*
    relocation policy(ies)? (Check all that apply.)                                                   (N=182)
             Not applicable, no changes have been made to our policy(ies) within the last year          30%
             Added or enhanced a homesale bonus/incentive for employees who find buyers for             18%
             their homes
             Added or enhanced a homesale incentive for buyers                                         10%
             Added loss-on-sale assistance                                                             12%
             Modified policy to provide loss-on-sale assistance to more employees                      10%
             Modified policy to provide loss-on-sale assistance to fewer employees                      --
             Modified policy to provide loss-on-sale assistance in greater dollar amounts              12%
             Modified policy to provide loss-on-sale assistance in more limited dollar amounts         6%
             Extended temporary living period                                                          18%
             Increased lump sum for temporary living                                                   2%
             Added or enhanced home fix-up allowance for employees marketing their homes                --
             Added or enhanced a guaranteed buyout provision to homesale program                        --
             Limited the availability of the guaranteed buyout provision to selected employees          --
             Added or enhanced an equity loan/advance                                                  2%
             Added or enhanced negative equity protection                                              2%
             Added a requirement to homesale program that employees use selected real estate           14%
             agents to market their homes in order to qualify for homesale assistance
             Added a requirement to homesale program that employees list their homes within a          20%
             certain percentage of the buyout offer (or BMA or appraisal) in order to qualify for
             homesale assistance
             Added a dollar cap or percentage cap to the reimbursement for direct reimbursement         2%
             program
             Increased use of appraisals in homesale program                                            6%
             Changed methodology to determine the guaranteed offer (e.g., if three appraisals are       4%
             needed, average two lowest vs. two highest)
             Now use appraisals to determine buyout offers                                              2%
             Added preference or requirement that employees select appraisers from a list of            3%
             approved appraisers
             Added preference or requirement that appraisers conducting relocation appraisals           2%
             have certain qualifications (e.g., selected designations, specific training, minimum
             number of years of experience conducting relocation appraisals)
             Added or enhanced duplicate housing assistance for employees who purchase a               10%
             home in the new location prior to selling the one in the old location
             Added or enhanced mortgage subsidy                                                        4%
             Added or enhanced COLA                                                                    3%
             Added or enhanced down payment assistance                                                 1%
             Added or enhanced coverage for home purchase closing costs                                3%
             Other                                                                                     14%
* Percentages do not total 100% due to multiple responses.


                                   Copyright © 2009 by Worldwide ERC®. All rights reserved.
17. Industry                                                                                            %
                                                                                                     (N=176)
               Aeronautics, aerospace, electronics/electrical, business machines, computers,           12%
               computer software, computer services, semiconductor
               Automobiles, automotive parts, industrial machinery/equipment, metals and alloys,       8%
               transportation
               Chemicals, plastics, rubber/rubber products, cement products, wood/paper products,      5%
               glass/glass products, polymers and fibers
               Communications, telecommunications, publishing, printing                               6%
               Government, military services, public utilities, non-profit                            3%
               Professional services: accounting, auditing, consulting, law & advertising             5%
               Financial services: insurance, banking, finance                                        15%
               Petroleum, gas, refining, distribution, pipeline construction, engineering, mining,    7%
               forestry, energy, construction
               Retail, wholesale, distribution, food service, entertainment, hospitality, consumer    21%
               products
               Pharmaceuticals, medical devices, healthcare                                           7%
               Manufacturing                                                                          5%
               Conglomerate (diversified)                                                             2%
               Other: (please specify)                                                                6%
               Total                                                                                 100%*
* Percentages do not total 100% due to rounding.


                                  Copyright © 2009 by Worldwide ERC®. All rights reserved.

Contenu connexe

Plus de Tom Cryer

MyTownCryer Mid Year 2010 Analysis
MyTownCryer Mid Year 2010 AnalysisMyTownCryer Mid Year 2010 Analysis
MyTownCryer Mid Year 2010 AnalysisTom Cryer
 
MyTownCryer July, 2010
MyTownCryer July, 2010MyTownCryer July, 2010
MyTownCryer July, 2010Tom Cryer
 
MyTownCryer June, 2010
MyTownCryer June, 2010MyTownCryer June, 2010
MyTownCryer June, 2010Tom Cryer
 
A Three Year Sales History for Foxfield, Colorado 80016
A Three Year Sales History for Foxfield, Colorado 80016A Three Year Sales History for Foxfield, Colorado 80016
A Three Year Sales History for Foxfield, Colorado 80016Tom Cryer
 
AVERAGE PRICE AND TRANSACTION COUNT FOR HIGHLANDS RANCH COLORADO 2010
AVERAGE PRICE AND TRANSACTION COUNT FOR HIGHLANDS RANCH COLORADO 2010AVERAGE PRICE AND TRANSACTION COUNT FOR HIGHLANDS RANCH COLORADO 2010
AVERAGE PRICE AND TRANSACTION COUNT FOR HIGHLANDS RANCH COLORADO 2010Tom Cryer
 
The Social Benefits Of Stable Housing
The Social Benefits Of Stable HousingThe Social Benefits Of Stable Housing
The Social Benefits Of Stable HousingTom Cryer
 
Mother\'s Day Denver 2010
Mother\'s Day Denver 2010Mother\'s Day Denver 2010
Mother\'s Day Denver 2010Tom Cryer
 
AVERAGE PRICE HISTORY LAST THREE YEARS IN GREENWOOD VILLAGE, COLORADO
AVERAGE PRICE HISTORY LAST THREE YEARS IN GREENWOOD VILLAGE, COLORADOAVERAGE PRICE HISTORY LAST THREE YEARS IN GREENWOOD VILLAGE, COLORADO
AVERAGE PRICE HISTORY LAST THREE YEARS IN GREENWOOD VILLAGE, COLORADOTom Cryer
 
Denver, Colorado Monthly Mls Stats 2010
Denver, Colorado Monthly Mls Stats 2010Denver, Colorado Monthly Mls Stats 2010
Denver, Colorado Monthly Mls Stats 2010Tom Cryer
 
Weekly Economic Financial Commentary March 26, 2010
Weekly Economic Financial Commentary March 26, 2010Weekly Economic Financial Commentary March 26, 2010
Weekly Economic Financial Commentary March 26, 2010Tom Cryer
 
It Pays to Buy Now!
It Pays to Buy Now!It Pays to Buy Now!
It Pays to Buy Now!Tom Cryer
 
Cherry Hills Village March 2010
Cherry Hills Village March 2010Cherry Hills Village March 2010
Cherry Hills Village March 2010Tom Cryer
 
DENVER MARKET WATCH YEAR END 2009
DENVER MARKET WATCH YEAR END 2009DENVER MARKET WATCH YEAR END 2009
DENVER MARKET WATCH YEAR END 2009Tom Cryer
 
February Foreclosure List for Denver, Colorado
February Foreclosure List for Denver, ColoradoFebruary Foreclosure List for Denver, Colorado
February Foreclosure List for Denver, ColoradoTom Cryer
 
Wells Fargo 2010 Annual Outlook
Wells Fargo 2010 Annual OutlookWells Fargo 2010 Annual Outlook
Wells Fargo 2010 Annual OutlookTom Cryer
 
A COMPREHENSIVE ANALYSIS OF $1M+ TRANSACTIONS IN THE DENVER METRO AREA AS OF ...
A COMPREHENSIVE ANALYSIS OF $1M+ TRANSACTIONS IN THE DENVER METRO AREA AS OF ...A COMPREHENSIVE ANALYSIS OF $1M+ TRANSACTIONS IN THE DENVER METRO AREA AS OF ...
A COMPREHENSIVE ANALYSIS OF $1M+ TRANSACTIONS IN THE DENVER METRO AREA AS OF ...Tom Cryer
 
University Hills Denver, CO Real Estate Report
University Hills Denver, CO Real Estate ReportUniversity Hills Denver, CO Real Estate Report
University Hills Denver, CO Real Estate ReportTom Cryer
 
University of Denver Community Residential Real Estate Trends
University of Denver Community Residential Real Estate TrendsUniversity of Denver Community Residential Real Estate Trends
University of Denver Community Residential Real Estate TrendsTom Cryer
 
Mortgage Brokers Association Data
Mortgage Brokers Association DataMortgage Brokers Association Data
Mortgage Brokers Association DataTom Cryer
 
Defeating Procrastination
Defeating ProcrastinationDefeating Procrastination
Defeating ProcrastinationTom Cryer
 

Plus de Tom Cryer (20)

MyTownCryer Mid Year 2010 Analysis
MyTownCryer Mid Year 2010 AnalysisMyTownCryer Mid Year 2010 Analysis
MyTownCryer Mid Year 2010 Analysis
 
MyTownCryer July, 2010
MyTownCryer July, 2010MyTownCryer July, 2010
MyTownCryer July, 2010
 
MyTownCryer June, 2010
MyTownCryer June, 2010MyTownCryer June, 2010
MyTownCryer June, 2010
 
A Three Year Sales History for Foxfield, Colorado 80016
A Three Year Sales History for Foxfield, Colorado 80016A Three Year Sales History for Foxfield, Colorado 80016
A Three Year Sales History for Foxfield, Colorado 80016
 
AVERAGE PRICE AND TRANSACTION COUNT FOR HIGHLANDS RANCH COLORADO 2010
AVERAGE PRICE AND TRANSACTION COUNT FOR HIGHLANDS RANCH COLORADO 2010AVERAGE PRICE AND TRANSACTION COUNT FOR HIGHLANDS RANCH COLORADO 2010
AVERAGE PRICE AND TRANSACTION COUNT FOR HIGHLANDS RANCH COLORADO 2010
 
The Social Benefits Of Stable Housing
The Social Benefits Of Stable HousingThe Social Benefits Of Stable Housing
The Social Benefits Of Stable Housing
 
Mother\'s Day Denver 2010
Mother\'s Day Denver 2010Mother\'s Day Denver 2010
Mother\'s Day Denver 2010
 
AVERAGE PRICE HISTORY LAST THREE YEARS IN GREENWOOD VILLAGE, COLORADO
AVERAGE PRICE HISTORY LAST THREE YEARS IN GREENWOOD VILLAGE, COLORADOAVERAGE PRICE HISTORY LAST THREE YEARS IN GREENWOOD VILLAGE, COLORADO
AVERAGE PRICE HISTORY LAST THREE YEARS IN GREENWOOD VILLAGE, COLORADO
 
Denver, Colorado Monthly Mls Stats 2010
Denver, Colorado Monthly Mls Stats 2010Denver, Colorado Monthly Mls Stats 2010
Denver, Colorado Monthly Mls Stats 2010
 
Weekly Economic Financial Commentary March 26, 2010
Weekly Economic Financial Commentary March 26, 2010Weekly Economic Financial Commentary March 26, 2010
Weekly Economic Financial Commentary March 26, 2010
 
It Pays to Buy Now!
It Pays to Buy Now!It Pays to Buy Now!
It Pays to Buy Now!
 
Cherry Hills Village March 2010
Cherry Hills Village March 2010Cherry Hills Village March 2010
Cherry Hills Village March 2010
 
DENVER MARKET WATCH YEAR END 2009
DENVER MARKET WATCH YEAR END 2009DENVER MARKET WATCH YEAR END 2009
DENVER MARKET WATCH YEAR END 2009
 
February Foreclosure List for Denver, Colorado
February Foreclosure List for Denver, ColoradoFebruary Foreclosure List for Denver, Colorado
February Foreclosure List for Denver, Colorado
 
Wells Fargo 2010 Annual Outlook
Wells Fargo 2010 Annual OutlookWells Fargo 2010 Annual Outlook
Wells Fargo 2010 Annual Outlook
 
A COMPREHENSIVE ANALYSIS OF $1M+ TRANSACTIONS IN THE DENVER METRO AREA AS OF ...
A COMPREHENSIVE ANALYSIS OF $1M+ TRANSACTIONS IN THE DENVER METRO AREA AS OF ...A COMPREHENSIVE ANALYSIS OF $1M+ TRANSACTIONS IN THE DENVER METRO AREA AS OF ...
A COMPREHENSIVE ANALYSIS OF $1M+ TRANSACTIONS IN THE DENVER METRO AREA AS OF ...
 
University Hills Denver, CO Real Estate Report
University Hills Denver, CO Real Estate ReportUniversity Hills Denver, CO Real Estate Report
University Hills Denver, CO Real Estate Report
 
University of Denver Community Residential Real Estate Trends
University of Denver Community Residential Real Estate TrendsUniversity of Denver Community Residential Real Estate Trends
University of Denver Community Residential Real Estate Trends
 
Mortgage Brokers Association Data
Mortgage Brokers Association DataMortgage Brokers Association Data
Mortgage Brokers Association Data
 
Defeating Procrastination
Defeating ProcrastinationDefeating Procrastination
Defeating Procrastination
 

Dernier

The Path to Product Excellence: Avoiding Common Pitfalls and Enhancing Commun...
The Path to Product Excellence: Avoiding Common Pitfalls and Enhancing Commun...The Path to Product Excellence: Avoiding Common Pitfalls and Enhancing Commun...
The Path to Product Excellence: Avoiding Common Pitfalls and Enhancing Commun...Aggregage
 
Monthly Social Media Update April 2024 pptx.pptx
Monthly Social Media Update April 2024 pptx.pptxMonthly Social Media Update April 2024 pptx.pptx
Monthly Social Media Update April 2024 pptx.pptxAndy Lambert
 
B.COM Unit – 4 ( CORPORATE SOCIAL RESPONSIBILITY ( CSR ).pptx
B.COM Unit – 4 ( CORPORATE SOCIAL RESPONSIBILITY ( CSR ).pptxB.COM Unit – 4 ( CORPORATE SOCIAL RESPONSIBILITY ( CSR ).pptx
B.COM Unit – 4 ( CORPORATE SOCIAL RESPONSIBILITY ( CSR ).pptxpriyanshujha201
 
0183760ssssssssssssssssssssssssssss00101011 (27).pdf
0183760ssssssssssssssssssssssssssss00101011 (27).pdf0183760ssssssssssssssssssssssssssss00101011 (27).pdf
0183760ssssssssssssssssssssssssssss00101011 (27).pdfRenandantas16
 
Call Girls In Holiday Inn Express Gurugram➥99902@11544 ( Best price)100% Genu...
Call Girls In Holiday Inn Express Gurugram➥99902@11544 ( Best price)100% Genu...Call Girls In Holiday Inn Express Gurugram➥99902@11544 ( Best price)100% Genu...
Call Girls In Holiday Inn Express Gurugram➥99902@11544 ( Best price)100% Genu...lizamodels9
 
Understanding the Pakistan Budgeting Process: Basics and Key Insights
Understanding the Pakistan Budgeting Process: Basics and Key InsightsUnderstanding the Pakistan Budgeting Process: Basics and Key Insights
Understanding the Pakistan Budgeting Process: Basics and Key Insightsseri bangash
 
Best VIP Call Girls Noida Sector 40 Call Me: 8448380779
Best VIP Call Girls Noida Sector 40 Call Me: 8448380779Best VIP Call Girls Noida Sector 40 Call Me: 8448380779
Best VIP Call Girls Noida Sector 40 Call Me: 8448380779Delhi Call girls
 
Mysore Call Girls 8617370543 WhatsApp Number 24x7 Best Services
Mysore Call Girls 8617370543 WhatsApp Number 24x7 Best ServicesMysore Call Girls 8617370543 WhatsApp Number 24x7 Best Services
Mysore Call Girls 8617370543 WhatsApp Number 24x7 Best ServicesDipal Arora
 
MONA 98765-12871 CALL GIRLS IN LUDHIANA LUDHIANA CALL GIRL
MONA 98765-12871 CALL GIRLS IN LUDHIANA LUDHIANA CALL GIRLMONA 98765-12871 CALL GIRLS IN LUDHIANA LUDHIANA CALL GIRL
MONA 98765-12871 CALL GIRLS IN LUDHIANA LUDHIANA CALL GIRLSeo
 
Famous Olympic Siblings from the 21st Century
Famous Olympic Siblings from the 21st CenturyFamous Olympic Siblings from the 21st Century
Famous Olympic Siblings from the 21st Centuryrwgiffor
 
Boost the utilization of your HCL environment by reevaluating use cases and f...
Boost the utilization of your HCL environment by reevaluating use cases and f...Boost the utilization of your HCL environment by reevaluating use cases and f...
Boost the utilization of your HCL environment by reevaluating use cases and f...Roland Driesen
 
Best Basmati Rice Manufacturers in India
Best Basmati Rice Manufacturers in IndiaBest Basmati Rice Manufacturers in India
Best Basmati Rice Manufacturers in IndiaShree Krishna Exports
 
Event mailer assignment progress report .pdf
Event mailer assignment progress report .pdfEvent mailer assignment progress report .pdf
Event mailer assignment progress report .pdftbatkhuu1
 
Value Proposition canvas- Customer needs and pains
Value Proposition canvas- Customer needs and painsValue Proposition canvas- Customer needs and pains
Value Proposition canvas- Customer needs and painsP&CO
 
VIP Call Girls In Saharaganj ( Lucknow ) 🔝 8923113531 🔝 Cash Payment (COD) 👒
VIP Call Girls In Saharaganj ( Lucknow  ) 🔝 8923113531 🔝  Cash Payment (COD) 👒VIP Call Girls In Saharaganj ( Lucknow  ) 🔝 8923113531 🔝  Cash Payment (COD) 👒
VIP Call Girls In Saharaganj ( Lucknow ) 🔝 8923113531 🔝 Cash Payment (COD) 👒anilsa9823
 
Cracking the Cultural Competence Code.pptx
Cracking the Cultural Competence Code.pptxCracking the Cultural Competence Code.pptx
Cracking the Cultural Competence Code.pptxWorkforce Group
 
Enhancing and Restoring Safety & Quality Cultures - Dave Litwiller - May 2024...
Enhancing and Restoring Safety & Quality Cultures - Dave Litwiller - May 2024...Enhancing and Restoring Safety & Quality Cultures - Dave Litwiller - May 2024...
Enhancing and Restoring Safety & Quality Cultures - Dave Litwiller - May 2024...Dave Litwiller
 
Unlocking the Secrets of Affiliate Marketing.pdf
Unlocking the Secrets of Affiliate Marketing.pdfUnlocking the Secrets of Affiliate Marketing.pdf
Unlocking the Secrets of Affiliate Marketing.pdfOnline Income Engine
 

Dernier (20)

The Path to Product Excellence: Avoiding Common Pitfalls and Enhancing Commun...
The Path to Product Excellence: Avoiding Common Pitfalls and Enhancing Commun...The Path to Product Excellence: Avoiding Common Pitfalls and Enhancing Commun...
The Path to Product Excellence: Avoiding Common Pitfalls and Enhancing Commun...
 
Monthly Social Media Update April 2024 pptx.pptx
Monthly Social Media Update April 2024 pptx.pptxMonthly Social Media Update April 2024 pptx.pptx
Monthly Social Media Update April 2024 pptx.pptx
 
B.COM Unit – 4 ( CORPORATE SOCIAL RESPONSIBILITY ( CSR ).pptx
B.COM Unit – 4 ( CORPORATE SOCIAL RESPONSIBILITY ( CSR ).pptxB.COM Unit – 4 ( CORPORATE SOCIAL RESPONSIBILITY ( CSR ).pptx
B.COM Unit – 4 ( CORPORATE SOCIAL RESPONSIBILITY ( CSR ).pptx
 
0183760ssssssssssssssssssssssssssss00101011 (27).pdf
0183760ssssssssssssssssssssssssssss00101011 (27).pdf0183760ssssssssssssssssssssssssssss00101011 (27).pdf
0183760ssssssssssssssssssssssssssss00101011 (27).pdf
 
Call Girls In Holiday Inn Express Gurugram➥99902@11544 ( Best price)100% Genu...
Call Girls In Holiday Inn Express Gurugram➥99902@11544 ( Best price)100% Genu...Call Girls In Holiday Inn Express Gurugram➥99902@11544 ( Best price)100% Genu...
Call Girls In Holiday Inn Express Gurugram➥99902@11544 ( Best price)100% Genu...
 
Understanding the Pakistan Budgeting Process: Basics and Key Insights
Understanding the Pakistan Budgeting Process: Basics and Key InsightsUnderstanding the Pakistan Budgeting Process: Basics and Key Insights
Understanding the Pakistan Budgeting Process: Basics and Key Insights
 
Best VIP Call Girls Noida Sector 40 Call Me: 8448380779
Best VIP Call Girls Noida Sector 40 Call Me: 8448380779Best VIP Call Girls Noida Sector 40 Call Me: 8448380779
Best VIP Call Girls Noida Sector 40 Call Me: 8448380779
 
Mysore Call Girls 8617370543 WhatsApp Number 24x7 Best Services
Mysore Call Girls 8617370543 WhatsApp Number 24x7 Best ServicesMysore Call Girls 8617370543 WhatsApp Number 24x7 Best Services
Mysore Call Girls 8617370543 WhatsApp Number 24x7 Best Services
 
MONA 98765-12871 CALL GIRLS IN LUDHIANA LUDHIANA CALL GIRL
MONA 98765-12871 CALL GIRLS IN LUDHIANA LUDHIANA CALL GIRLMONA 98765-12871 CALL GIRLS IN LUDHIANA LUDHIANA CALL GIRL
MONA 98765-12871 CALL GIRLS IN LUDHIANA LUDHIANA CALL GIRL
 
Famous Olympic Siblings from the 21st Century
Famous Olympic Siblings from the 21st CenturyFamous Olympic Siblings from the 21st Century
Famous Olympic Siblings from the 21st Century
 
Boost the utilization of your HCL environment by reevaluating use cases and f...
Boost the utilization of your HCL environment by reevaluating use cases and f...Boost the utilization of your HCL environment by reevaluating use cases and f...
Boost the utilization of your HCL environment by reevaluating use cases and f...
 
unwanted pregnancy Kit [+918133066128] Abortion Pills IN Dubai UAE Abudhabi
unwanted pregnancy Kit [+918133066128] Abortion Pills IN Dubai UAE Abudhabiunwanted pregnancy Kit [+918133066128] Abortion Pills IN Dubai UAE Abudhabi
unwanted pregnancy Kit [+918133066128] Abortion Pills IN Dubai UAE Abudhabi
 
Best Basmati Rice Manufacturers in India
Best Basmati Rice Manufacturers in IndiaBest Basmati Rice Manufacturers in India
Best Basmati Rice Manufacturers in India
 
Event mailer assignment progress report .pdf
Event mailer assignment progress report .pdfEvent mailer assignment progress report .pdf
Event mailer assignment progress report .pdf
 
VVVIP Call Girls In Greater Kailash ➡️ Delhi ➡️ 9999965857 🚀 No Advance 24HRS...
VVVIP Call Girls In Greater Kailash ➡️ Delhi ➡️ 9999965857 🚀 No Advance 24HRS...VVVIP Call Girls In Greater Kailash ➡️ Delhi ➡️ 9999965857 🚀 No Advance 24HRS...
VVVIP Call Girls In Greater Kailash ➡️ Delhi ➡️ 9999965857 🚀 No Advance 24HRS...
 
Value Proposition canvas- Customer needs and pains
Value Proposition canvas- Customer needs and painsValue Proposition canvas- Customer needs and pains
Value Proposition canvas- Customer needs and pains
 
VIP Call Girls In Saharaganj ( Lucknow ) 🔝 8923113531 🔝 Cash Payment (COD) 👒
VIP Call Girls In Saharaganj ( Lucknow  ) 🔝 8923113531 🔝  Cash Payment (COD) 👒VIP Call Girls In Saharaganj ( Lucknow  ) 🔝 8923113531 🔝  Cash Payment (COD) 👒
VIP Call Girls In Saharaganj ( Lucknow ) 🔝 8923113531 🔝 Cash Payment (COD) 👒
 
Cracking the Cultural Competence Code.pptx
Cracking the Cultural Competence Code.pptxCracking the Cultural Competence Code.pptx
Cracking the Cultural Competence Code.pptx
 
Enhancing and Restoring Safety & Quality Cultures - Dave Litwiller - May 2024...
Enhancing and Restoring Safety & Quality Cultures - Dave Litwiller - May 2024...Enhancing and Restoring Safety & Quality Cultures - Dave Litwiller - May 2024...
Enhancing and Restoring Safety & Quality Cultures - Dave Litwiller - May 2024...
 
Unlocking the Secrets of Affiliate Marketing.pdf
Unlocking the Secrets of Affiliate Marketing.pdfUnlocking the Secrets of Affiliate Marketing.pdf
Unlocking the Secrets of Affiliate Marketing.pdf
 

2009 Us Corporate Relocation Benchmarking Survey

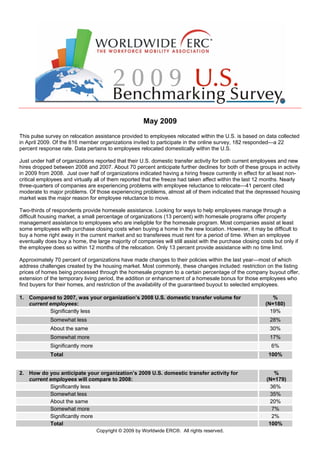
  • 1. May 2009 This pulse survey on relocation assistance provided to employees relocated within the U.S. is based on data collected in April 2009. Of the 816 member organizations invited to participate in the online survey, 182 responded—a 22 percent response rate. Data pertains to employees relocated domestically within the U.S. Just under half of organizations reported that their U.S. domestic transfer activity for both current employees and new hires dropped between 2008 and 2007. About 70 percent anticipate further declines for both of these groups in activity in 2009 from 2008. Just over half of organizations indicated having a hiring freeze currently in effect for at least non- critical employees and virtually all of them reported that the freeze had taken affect within the last 12 months. Nearly three-quarters of companies are experiencing problems with employee reluctance to relocate—41 percent cited moderate to major problems. Of those experiencing problems, almost all of them indicated that the depressed housing market was the major reason for employee reluctance to move. Two-thirds of respondents provide homesale assistance. Looking for ways to help employees manage through a difficult housing market, a small percentage of organizations (13 percent) with homesale programs offer property management assistance to employees who are ineligible for the homesale program. Most companies assist at least some employees with purchase closing costs when buying a home in the new location. However, it may be difficult to buy a home right away in the current market and so transferees must rent for a period of time. When an employee eventually does buy a home, the large majority of companies will still assist with the purchase closing costs but only if the employee does so within 12 months of the relocation. Only 13 percent provide assistance with no time limit. Approximately 70 percent of organizations have made changes to their policies within the last year—most of which address challenges created by the housing market. Most commonly, these changes included: restriction on the listing prices of homes being processed through the homesale program to a certain percentage of the company buyout offer, extension of the temporary living period, the addition or enhancement of a homesale bonus for those employees who find buyers for their homes, and restriction of the availability of the guaranteed buyout to selected employees. 1. Compared to 2007, was your organization’s 2008 U.S. domestic transfer volume for % current employees: (N=180) Significantly less 19% Somewhat less 28% About the same 30% Somewhat more 17% Significantly more 6% Total 100% 2. How do you anticipate your organization’s 2009 U.S. domestic transfer activity for % current employees will compare to 2008: (N=179) Significantly less 36% Somewhat less 35% About the same 20% Somewhat more 7% Significantly more 2% Total 100% Copyright © 2009 by Worldwide ERC®. All rights reserved.
  • 2. 3. Compared to 2007, was your organization’s 2008 U.S. domestic transfer volume for % new hires: (N=177) Significantly less 15% Somewhat less 27% About the same 41% Somewhat more 11% Significantly more 7% Total 100%* * Percentages do not total 100% due to rounding. 4. How do you anticipate your organization’s 2009 U.S. domestic transfer activity for % new hires will compare to 2008: (N=177) Significantly less 40% Somewhat less 31% About the same 24% Somewhat more 6% Significantly more 1% Total 100%* * Percentages do not total 100% due to rounding. 5. Estimate the percentage of your total 2008 U.S. domestic transfer volume that was: % (N=173) Current employees 58% New hires 42% Total 100% 6. Estimate the percentage of your total 2009 U.S. domestic transfer volume that will be: % (N=176) Current employees 63% New hires 37% Total 100% 7. Estimate the percentage of your total 2008 U.S. domestic transfer volume that was: % (N=171) Homeowners 58% Renters 42% Total 100% 8. Estimate the percentage of your total 2009 U.S. domestic transfer volume that will be: % (N=172) Homeowners 56% Renters 44% Total 100% 9. Is your organization experiencing any problems with respect to employees’ reluctance % to accept transfers? Do not consider new hires. (N=178) Yes, major problems 6% Yes, moderate problems 35% Yes, minor 31% No 28% Total 100% Copyright © 2009 by Worldwide ERC®. All rights reserved.
  • 3. 10. If yes, what are the major reasons for employees’ reluctance to accept transfers? %* (N=129) Slowed real estate appreciation/depressed housing market at old location 95% High housing cost areas 29% Employee/family resistance to move 22% High cost-of-living areas 19% Spouse reluctance to leave his/her job 16% Less than adequate relocation policy 9% Undesirable areas 4% Employee satisfaction with current position 1% Other 1% * Percentages do not total 100% due to multiple responses. 11. Does your organization currently have a hiring freeze? % (N=179) Yes, for almost all critical and non-critical positions 9% Yes, for non-critical positions but can hire for critical positions 42% No 47% Total 100%* * Percentages do not total 100% due to rounding. 11. If yes, for how long has your organization been under a hiring freeze? % (N=91) Less than 6 months 55% 6 -12 months 42% 13 – 18 months 1% 19 – 24 months 1% More than 2 years 1% Total 100% 12. Do you have a homesale program in which your organization or your organization’s % relocation management company offers to purchase at least some employees’ homes? (N=180) Yes 66% No 34% Total 100% 13. If yes, does your company ever offer any assistance for property management to % transferees whose homes are ineligible for the company’s homesale program? (N=119) Yes, to all employees whose homes are ineligible for the homesale program 3% Yes, to certain employees (varies by policy tier, type of employee, etc.) 10% No 87% Total 100% 14. If yes, for how long has your organization made property management assistance % available to U.S. domestic transferees? (N=16) Less than 1 year 19% 1 year 13% 2 years 13% More than 2 years 56% Total 100%* * Percentages do not total 100% due to rounding. Copyright © 2009 by Worldwide ERC®. All rights reserved.
  • 4. 15. In general, are home-owning employees that move to the new location and rent for a period of time (e.g., having difficulty selling their homes in the old location) eligible for purchase closing cost assistance from your company when they eventually are able to % purchase a home? (N=179) Not applicable, company never assists transferees with purchase closing costs 6% No 7% Yes, and there is no time limit imposed on how soon the employee must purchase a 13% home once they arrive in the new location Yes, but only if home is purchased within a specified period of time after the employee 73% moves to the new location. Average = 1 year; Most common = 1 year (117 cos.) Total 100%* * Percentages do not total 100% due to rounding. 16. In the past year, has your organization made any of the following changes to it’s %* relocation policy(ies)? (Check all that apply.) (N=182) Not applicable, no changes have been made to our policy(ies) within the last year 30% Added or enhanced a homesale bonus/incentive for employees who find buyers for 18% their homes Added or enhanced a homesale incentive for buyers 10% Added loss-on-sale assistance 12% Modified policy to provide loss-on-sale assistance to more employees 10% Modified policy to provide loss-on-sale assistance to fewer employees -- Modified policy to provide loss-on-sale assistance in greater dollar amounts 12% Modified policy to provide loss-on-sale assistance in more limited dollar amounts 6% Extended temporary living period 18% Increased lump sum for temporary living 2% Added or enhanced home fix-up allowance for employees marketing their homes -- Added or enhanced a guaranteed buyout provision to homesale program -- Limited the availability of the guaranteed buyout provision to selected employees -- Added or enhanced an equity loan/advance 2% Added or enhanced negative equity protection 2% Added a requirement to homesale program that employees use selected real estate 14% agents to market their homes in order to qualify for homesale assistance Added a requirement to homesale program that employees list their homes within a 20% certain percentage of the buyout offer (or BMA or appraisal) in order to qualify for homesale assistance Added a dollar cap or percentage cap to the reimbursement for direct reimbursement 2% program Increased use of appraisals in homesale program 6% Changed methodology to determine the guaranteed offer (e.g., if three appraisals are 4% needed, average two lowest vs. two highest) Now use appraisals to determine buyout offers 2% Added preference or requirement that employees select appraisers from a list of 3% approved appraisers Added preference or requirement that appraisers conducting relocation appraisals 2% have certain qualifications (e.g., selected designations, specific training, minimum number of years of experience conducting relocation appraisals) Added or enhanced duplicate housing assistance for employees who purchase a 10% home in the new location prior to selling the one in the old location Added or enhanced mortgage subsidy 4% Added or enhanced COLA 3% Added or enhanced down payment assistance 1% Added or enhanced coverage for home purchase closing costs 3% Other 14% * Percentages do not total 100% due to multiple responses. Copyright © 2009 by Worldwide ERC®. All rights reserved.
  • 5. 17. Industry % (N=176) Aeronautics, aerospace, electronics/electrical, business machines, computers, 12% computer software, computer services, semiconductor Automobiles, automotive parts, industrial machinery/equipment, metals and alloys, 8% transportation Chemicals, plastics, rubber/rubber products, cement products, wood/paper products, 5% glass/glass products, polymers and fibers Communications, telecommunications, publishing, printing 6% Government, military services, public utilities, non-profit 3% Professional services: accounting, auditing, consulting, law & advertising 5% Financial services: insurance, banking, finance 15% Petroleum, gas, refining, distribution, pipeline construction, engineering, mining, 7% forestry, energy, construction Retail, wholesale, distribution, food service, entertainment, hospitality, consumer 21% products Pharmaceuticals, medical devices, healthcare 7% Manufacturing 5% Conglomerate (diversified) 2% Other: (please specify) 6% Total 100%* * Percentages do not total 100% due to rounding. Copyright © 2009 by Worldwide ERC®. All rights reserved.