Contenu connexe Similaire à Jens valloe christiansen Similaire à Jens valloe christiansen (20) Plus de Tomasz Waszczyk (20) 2.
1
SUMMARY
The use of computer technology has been an important part of financial markets for decades. For
some time, banks, hedge funds and other sophisticated market participants have used computer
programs, known as trading algorithms, to trade directly in the market. As electronic trading has
become more widespread, computer‐based access to the markets has become more broadly available
as well. Many banks and brokerages offer their clients, including private investors, access to the
financial markets by means of advanced computer systems that route orders to the optimal price. The
consequence has been increased trading volume, better liquidity, and tighter spreads. On major stock
exchanges such as NASDAQ in the United States, trading algorithms now represent the majority of
daily volume. This means that the majority of trading takes part without direct contact between
human traders.
There are two main types of trading algorithms, those that are used for optimal execution, i.e.
obtaining the best possible price for an order, and those used for speculation. This paper describes
both from a theoretical perspective, and shows how two types of speculative algorithms can be
designed. The first is a strategy that uses exponential moving averages to capture price momentum.
The second is a market neutral relative‐value strategy that trades individual stocks against each other
known as pairs trading. Both are tested using empirical data and the results are encouraging. Despite
the widespread use of algorithms in the markets, evidence remains of positive excess returns. In
particular, the results of Gatev et al (2006) based on pairs trading are confirmed using more recent
data from the London Stock Exchange. The idea of univariate pairs trading is extended to a
multivariate framework in two ways. The second is based on state space methods. The results show
that for the data sample used, higher transaction costs outweigh any benefits from this extension.
The theoretical foundation of trading algorithms is market microstructure theory. This theory deals
with the dynamics of trading and the interaction that takes place between market participants.
Among the important issues are the existence of asymmetric information and the adjustment of
market prices to new information, either private or public. The methodology of Hasbrouck (1991) is
used to analyze the information content of high‐frequency transaction data, also from the London
Page | 2
AEF Thesis
6. 3. Introduction
3
3.1
INTRODUCTION
Overview
Over the last few decades algorithmic trading has become an important part of modern financial
markets. As the use of computer technology has become more broad based, investors are demanding
faster, cheaper, more reliable, and more intelligent access to financial markets. Banks and hedge
funds are taking advantage of this trend and have begun an arms race towards creating the best
electronic trading systems and algorithms. Algorithmic trading represents an ever‐growing share of
trading volume, and in some markets the majority (KIM, K., 2007).
The theoretical foundation for algorithmic trading is found primarily in the fields of financial
econometrics and market microstructure. The study of the time series properties of security prices is
among the most pervasive subjects in the financial literature, and has grown rapidly in tandem with
cheaper access to computing power. The field is characterized by the vast amount of data available to
researchers in the form of databases of historical transaction data. The statistical theory needed to
analyze such data is different from the datasets known from conventional economics with less
frequent observations, and is often much more computationally intensive. Traditional methods in
exploratory data analysis such as vector autoregression have been joined by new methods such as
autoregressive conditional duration models, to take into account the nonsynchronous nature of high‐
frequency transaction data (ENGLE, R. and Russell, J., 1998).
The primary ambition of this paper is to provide a brief introduction to an extensive subject. The
content has been selected with the aim of covering core areas of the theory while maintaining a
coherent whole. The papers and models that will be covered are particularly well suited to empirical
testing as opposed to much theory in the microstructure literature. The secondary aim of the paper is
to determine whether it is possible to create speculative trading algorithms that earn positive excess
returns.
The analysis will focus on two main areas, the microstructure of financial markets and trading
algorithms. The two are connected in the sense that microstructure theory provides the theoretical
basis for the development of trading algorithms. The distinction between microstructure theory and
financial econometrics is often blurry, and elements from each field will be used as deemed
Page | 6
AEF Thesis
7. 3. Introduction
appropriate. The structure of the paper is thus divided into two main parts, a part that presents
theoretical background, and an empirical analysis using market data.
In the first part, sections 4‐6 present the background for the empirical analysis. Section 4 presents a
method for the analysis of high‐frequency equity transaction data. Section 5 covers trading
algorithms, both for optimal execution and speculation. Section 6 outlines the general theory of state
space models which can be used to design speculative algorithms.
In the second part, sections 7 & 8 apply the theory to market data. Section 7 carries out an empirical
analysis of equity tick data based on the methodology of section 4. Section 8 proceeds to test two
kinds of speculative algorithms, one based on security price momentum, the other based on the
relative value of securities. Section 9 concludes.
3.2
Literature
The academic literature on the subject of market microstructure is vast. In this paper the main
sources used were Hasbrouck (1991) and Hasbrouck (2007). For optimal execution the main sources
were Almgren & Chriss (2001) and McCulloch & Kazakov (2007). Academic work on speculative
trading algorithms is scarce, and pairs trading in particular, but Gatev et al (2006) gives a useful
overview. The empirical analysis was done using MATLAB1, and to this end Kassam (2008) was a great
help.
Shumway & Stoffer (2006) was the source for general theory of time series analysis, and Campbell et
al (2006) for financial econometrics, including a chapter on market microstructure. Durbin &
Koopman (2001) was the main reference for state space models.
1
The author may be contacted at jenschristiansen@gmail.com for the MATLAB code used in the empirical analysis.
AEF Thesis
Page | 7
9. 4. Background Part I: Market microstructure theory
4
4.1
BACKGROUND PART I: MARKET MICROSTRUCTURE THEORY
Introduction and overview
This section will present select parts of the theory of market microstructure, and prepare the reader
for the empirical analysis in section 7. What follows is a brief description of the dynamics of a modern
securities market.
The main market mechanism in modern electronic markets is the limit order book. The limit order
book consists of a list of buy and sell orders at different prices and for different quantities. An
example could be an order to ‘buy 100 shares at $30.10 or less’ or ‘sell 300 shares at $30.50 or more
in 100 share increments’. By consolidating all such orders in a central system, as for example a stock
exchange, it is possible to know the best bid (buy order) and best offer (sell order) at any given time.
The difference between the bid and the ask is known as the spread. Trades take place when a trader
is willing to ‘cross’ the spread, that is, to buy at the offer or sell at the bid of someone else. The
market is typically anonymous, and trades may be made based only on the price and quantity being
bought or sold. This is known as a continuous auction.
An active limit order that hasn’t yet been executed is known as a quote. Once an order is executed,
i.e. a transaction takes place at a quoted price (either at the bid or ask), the quote disappears and is
replaced by the next best available bid or ask. Note that a quote may be withdrawn before it is ever
executed. The historical observations of interest to market participants are thus both historical
quotes and historical trades. These are also the quantities that will be used for empirical analysis.
The effectiveness of continuous auction market depends on the amount of active market
participants, and the amount of a given security they are willing to trade at any given time. This
evasive concept is known as market ‘liquidity’. One of the main challenges of market microstructure
theory is to define and quantify it. In a well‐functioning market there are many participants that trade
significant amounts of a security with each other – continuously. The price of the security being
quoted at any given point in time will thus reflect what many participants believe it should be –
otherwise the orders would be filled, and the market would move up or down in the order book. This
process is known as price discovery. See Hasbrouck (2007) for further details.
AEF Thesis
Page | 9
10. 4. Background Part I: Market microstructure theory
The following section will touch briefly upon some of the main institutional features of modern
electronic markets.
4.2
Liquidity pools and aggregators
Modern markets are characterized more by their fragmentation than their consolidation. This is
despite of the progress of technology and electronic trading in particular. The main reason is that
market participants constantly seek cheaper and better venues for their trading. A good example is
the recent success of multilateral trading facilities (MTFs) such as Chi‐X and Turquoise in Europe.
MTFs are hybrid trading venues in the sense that they connect market participants to decentralized
‘liquidity pools’. The term liquidity pool is used to describe the existence of a market in a security
outside a central exchange. Liquidity pools are typically operated by large banks, and are intended to
lower the cost of trading by moving it off the central exchanges (TURQUOISE, 2008).
The obvious implication of this is market fragmentation, and this is the gap that MTFs bridge by
connecting the various liquidity pools at low cost. Market participants communicate across the MTFs,
centralized exchanges and private ‘dark pools’ using common communication protocols. The most
popular is called the Financial Information eXchange (FIX) (WIKIPEDIA, 2008a).
Market participants naturally want to access as many different liquidity pools as possible, to obtain
the best possible price available. To this end they use ‘aggregators’, computer systems designed to
route orders to the best possible price, wherever this price may be quoted. Aggregators are typically
provided by investment banks, for example Deutsche Bank’s autobahn system (DB, 2008). The
importance of price aggregators has been further increased by the need to provide clients with ‘best
execution’ in accordance with securities regulation such as MiFID in Europe (Markets in Financial
Instruments Directive) (WIKIPEDIA, 2008b).
4.3
The information content of stock trades
This section will provide the theoretical background for the subsequent empirical analysis of tick data
from the London Stock Exchange. The theoretical framework is that of Hasbrouck (1991) and involves
the use of vector autoregression to extract the information content of stock trades.
Page | 10
AEF Thesis
11. 4. Background Part I: Market microstructure theory
4.3.1 Bins and transaction time
A common way to analyze stock data is to observe the daily closing prices of a given stock for an
arbitrary number of trading days. The frequency of price observation is merely a matter of scaling,
however, and this paper will analyze stock data from a more detailed perspective, namely at the tick
level. The highest possible frequency of observation for a given stock is the observation of every
single trade event. This may be combined with the observation of every single quote event to give a
detailed view of the intra‐day trading process. Large company stocks trade very frequently2 however,
so trade events are typically grouped in fixed time intervals known as bins. Daily price observations
for a given stock may be seen as the creation of one‐day bins of transaction data. Each bin has an
opening price and a closing price. The price may in this case be the bid, the ask, the quote midpoint
(the average of the bid and the ask) or the last traded price. Typically the last traded price is used for
daily observations. Possible bin sizes range from a year or more to a minute or less. Bins are
particularly useful for graphing price data. Figure 4‐1 shows a ‘candle’ graph of Anglo American PLC
(AAL.LN) with hourly bins. The green candles indicate that AAL.LN closed at a higher price than the
opening price of a given one‐hour period. The red candles indicate the opposite and the black
‘whiskers’ at the top or bottom of a candle indicate the range in which the stock traded during the
time interval.
2
As an example, on March 3, 2008 between 8:00 and 16:30, Anglo American PLC (AAL.LN) listed on London Stock
Exchange experienced 51,412 events of which 9,941 were trade events and 41,471 were quote events.
AEF Thesis
Page | 11
12. 4. Background Part I: Market microstructure theory
Figure 4‐1: AAL.LN hourly bins March 3‐12, 2008. Source: E*TRADE.
When every trade and quote event of a stock is observed, each event is a new point in what is known
as transaction time. Clock time increments in transaction time can vary from event to event. On
March 3, 2008, the average transaction time increment of AAL.LN was 0.5945 seconds with a
standard deviation of 1.8413, a minimum of 0 and a maximum of 50.92.
4.3.2 Model specification
Following the analysis in Hasbrouck (1991), the primary price variable of interest is the quote
midpoint. At time t the best bid and ask quote in the market are denoted by
and
respectively,
and transactions are characterized by their signed volume (purchases are positive, sales are
negative). Define the value of the security at some convenient terminal time in the distant future as
, and let
be the public information set at time t. Then the symmetry assumption is:
/2
I.e. the quote midpoint at time ,
future value of the security,
|
/2
0
(4.1)
/2, contains all available public information of the
. The information inferred from the time t trade ( ) can then be
summarized as the subsequent change in the quote midpoint:
Page | 12
|
AEF Thesis
13. 4. Background Part I: Market microstructure theory
r
⁄2
1
1
⁄2
(4.2)
Conveniently, due to the symmetry assumption in (4.1), the information impact of is not affected
by the transaction cost‐based component of the spread. This specification is characterized by a trade
impact that is fully contemporaneous and can be written as
,
. In reality, quote
revisions are likely to show a lagged response to trade innovations for various reasons related to the
market microstructure. Hasbrouck mentions threshold effects due to price discreteness, inventory
control effects, and lagged adjustment to information (HASBROUCK, J., 1991). Threshold effects are of
psychological nature, market participants respond to some price levels different than other because
of their numerical value (round numbers or historical highs and lows). For example, a stock that
approaches the GBp 1,000 mark for the first time is likely to motivate a different kind of behavior
from market participants than the behavior seen when the stock was range‐bound between GBp 920
and GBp 960.3 Inventory control effects are probably less prominent in today’s largely electronic
markets compared to the market on the NYSE in 1989 that Hasbrouck was investigating. Lagged
adjustment to information is likely to remain an issue, but has possibly diminished since 1989 due to
the presence of more market participants, the emergence of computerized trading algorithms, and
more efficient trading systems in general (HASBROUCK, J., 2007).
4.3.3 Vector autoregression
A more flexible structure that allows the current quote revision to be affected by past quote revisions
and trades, can be made using vector autoregression. A vector autoregressive model of order ,
VAR( ), is written as
where each γ is a
v
α
γv
w
(4.3)
transition matrix that expresses the dependence of vt on vt j . The vector
white noise process wt is assumed to be multivariate normal with mean‐zero and covariance matrix
3
GBp is an abbreviation for one penny, which is 1/100 of a British pound sterling, the price unit used for stocks in Great
Britain.
AEF Thesis
Page | 13
14. 4. Background Part I: Market microstructure theory
Σ . As an example, a bivariate VAR(1) model, i.e.
w
2, consists of the following two
equations:
v
α
γ v
,
γ v
,
w
(4.4)
v
α
γ v
,
γ v
,
w
(4.5)
(SHUMWAY, R. H. and Stoffer, D. S., 2006). The relationship between quote revisions and trades may
be modeled using the structure in (4.4). We get
a r
where
,
a r
b x
b x
,
(4.6)
is a disturbance term. The quote revision at time is expressed as a function of past quote
revisions and past trades. This implies that there is serial correlation in the quote revisions. Since the
symmetry assumption in (4.1) is incompatible with such serial correlation in the quote revisions, it is
replaced by a weaker assumption:
T,
As s
For some future time s,
|
/2
0
(4.7)
, conditional on the information set at time t. This allows any
deviation in the quote midpoint from the efficient price to be transient.
To allow for causality running from quotes to trades, trades may be modeled in a similar fashion:
x
The innovation,
,
c r
c r
d x
d x
,
(4.8)
, captures the unanticipated component of the trade relative to an expectation
formed from linear projection on the trade and quote revision history. Jointly equations (4.6) and
(4.8) comprise a bivariate vector autoregressive system. It is assumed that the error terms have zero
mean and are jointly and serially uncorrelated:
E
E
,
E
,
E
,
,
,
E
0,
,
,
0, for
,
.
(4.9)
The expected cumulative quote revisions through step m in response to the trade innovation
,
may be written as
Page | 14
α
,
∑
Er
AEF Thesis
,
.
(4.10)
15. 4. Background Part I: Market microstructure theory
By (3.5) as m increases,
α
E
,
2
,
,
2
0
(4.11)
That is, the expected cumulative quote revision converges to the revision in the efficient price. For
this reason α
,
can be interpreted as the information revealed by the trade innovation, and
constitutes the underlying construct of Hasbrouck’s framework.
A way of seeing why it is important to include lagged trades and quote revisions in the model is to
consider an alternative to the vector autoregressive setup. This could be a simpler model that
assumes the complete absence of any transient effects in the price discovery process, including
̂
liquidity effects. This can be written as
,
where the "
" symbol denotes that the
,
model is incorrectly specified. The regression coefficient ̂
/
is likely to
overestimate the immediate effect of a trade on the quote revision due to inventory and liquidity
considerations. Instead of capturing the lagged adjustment of the efficient price to the trade
innovation, this oversimplified model will embed all short‐term effects in the regression coefficient ̂ .
Hasbrouck (1991) shows that another alternative specification of the model, which does not include
lagged versions of the dependent variable, will also be inferior to the full specification.
An important feature of the VAR model of equations (4.6) and (4.8) is the implication that all public
information is captured by the innovation
,
and all private information (plus an uncorrelated
liquidity component) with the trade innovation
,
. The rationale for the first implication is that all
public information is immediately reflected in the quotes posted by market makers (otherwise the
market makers would be exposed to arbitrage). The second implication is due to the fact that trade
innovations reflect information that was not already contained in the history of trades and quote
revisions, and must therefore be based on external (or private) information or liquidity trading. In
other words, public information is not useful in predicting the trade information. Letting
be the
public information immediately subsequent to the time t quote revision,
Ev
,
|
0, for
AEF Thesis
0.
(4.12)
Page | 15
16. 4. Background Part I: Market microstructure theory
4.3.4 A simple microstructure model
The VAR setup as it has been presented so far is an econometric representation of a simple
microstructure model. The following description is also adapted from (HASBROUCK, J., 1991). The
model exhibits both asymmetric information and inventory control behavior. Let
be the efficient
stock price, the expected value of the stock conditional on all public information. The dynamics of
are given by
m
where v
,
and v
,
zv
,
v
,
(4.13)
are mutually and serially uncorrelated disturbance terms, and interpreted in the
same way as above. The coefficient reflects the private information conveyed by the trade
innovation v
,
. The quote‐midpoint price has dynamics
q
m
a q
bx
m
(4.14)
1
where x is again the signed trade at time and and are adjustment coefficients with 0
0. Equation (5.14) has an inventory control interpretation. Say that at time
and
x
0, i.e. an agent purchases from the market maker at the existing quote
will react by raising his bid
q rises. The case of
to elicit sales. If the spread (
0, q
m . If
, the market maker
) remains constant, this implies that
1 is associated with imperfect inventory control: competition from public
limit order traders, for example, forces q to move closer to m with the passage of time.
The final equation in the model describes the evolution of trades:
x
where
c q
m
v
,
(4.15)
0 defines a downward sloping demand schedule, i.e. when the quote midpoint rises above
the perceived efficient price (by a magnitude greater than half the spread), market participants react
by selling. From an econometric viewpoint the efficient price m is unobservable, so an empirical
model must involve only x and q . This forms the basis for the VAR framework. Section 7.3 presents
an empirical analysis of historical transaction data from London Stock Exchange.
Page | 16
AEF Thesis
17. 5. Background Part II: Trading algorithms
5
5.1
BACKGROUND PART II: TRADING ALGORITHMS
Overview
Algorithmic trading volume has increased dramatically in the past several years. The NYSE reports
that in 2000, 22% of all trading was executed via trading algorithms, up from 11.6% in 1995. In 2004,
that number had increased to 50.6% (KIM, K., 2007). There are several reasons for the emergence and
relative success of trading algorithms. One reason is that much trading in the financial markets is
done based on discretionary human decision‐making without consistent adherence to specific rules or
systems. Broadly speaking a trading rule is a set of instructions a trader follows that depend on the
market price of one or more financial instruments. A trading rule takes market prices as input and
gives orders to buy or sell at a given point in time as output. Most traders do use rules and systems
that they believe have worked in the past, but they are hard to repeat consistently, and traders will
be tempted to deviate from their rules once it appears that they may not be working anymore. Such
small deviations in trading patterns may do a critical amount of damage to an otherwise successful
trading strategy. Trades executed by trading algorithms, on the other hand, are based on rules that
may be formulated mathematically or in computer code, and are therefore possible to repeat with
perfect consistency.
We may distinguish between two main types of trading algorithms: optimal execution algorithms and
speculative algorithms. Optimal execution algorithms seek to execute orders in the market at the
lowest possible cost, whereas speculative algorithms take market risks in the hope of earning a profit.
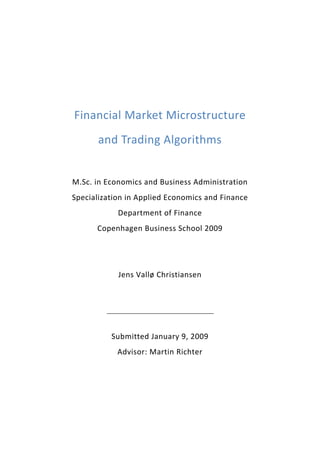
As depicted in Figure 5‐1, the process of developing and then implementing trading algorithms starts
with financial modeling in a suitable statistical software environment such as Excel or MATLAB. Based
on historical data the algorithm is designed and back‐tested using historical price data to the point at
which it has attractive out‐of‐sample characteristics. In the case of speculative algorithms this could
be a high risk‐adjusted return or low correlation with the return from investing in the broader market.
Developers of optimal execution algorithms will instead focus on achieving fast and cost‐efficient
execution. The implementation then proceeds by bridging the development environment with trading
infrastructure that may execute orders generated by the algorithm. The algorithm now takes as input
real‐time data from the financial markets.
AEF Thesis
Page | 17
18. 5. Background Part II: Trading algorithms
Financial
modelling
Statistical
software
Trading system
Analysis & design
Order execution
Back‐testing
Risk management
Refinement
Historical data
Live
implementation
P&L
Real‐time data
Figure 5‐1: Trading algorithm development and implementation.
The implementation of both optimal execution and speculative algorithms requires that the algorithm
can be programmed in a computer language, so the trading process can be fully automated. If the
process of getting orders to the market at any stage requires human intervention, the reaction speed
and accuracy of the algorithm will fall, and thus many of the appealing characteristics of trading
algorithms will be impaired. On the other hand, the flexibility of the algorithm and its ability to adapt
to a changing market environment will only be as good as the computer code it is based on – an
obvious disadvantage compared to human traders. The speed with which a trading algorithm reacts
to incoming real‐time market data, processes the data and reacts by issuing new market orders or by
waiting, will depend upon the computer infrastructure and programming language used. High‐level
programming languages such as MATLAB are suitable for the financial modeling of trading algorithms,
but ‘faster’ languages are typically used to build trading systems. C++, C# and Erlang are examples of
low‐level programming languages. The latter is a concurrent language that facilitates simultaneous
execution of several interacting computational tasks, and is particularly fast (WIKIPEDIA, 2008c). Such
characteristics may improve the performance of the trading algorithm and decrease the time to
market – which is a critical factor for both optimal execution and speculative algorithms. The faster
Page | 18
AEF Thesis
19. 5. Background Part II: Trading algorithms
the algorithm can react to incoming real‐time market data, the more likely it is to obtain the liquidity
it seeks, i.e. successfully execute scheduled trades before other market participants.4
5.2
Optimal execution algorithms
The aim of optimal execution algorithms is to minimize the transaction costs involved in executing
large orders, which is also known as execution costs. The literature on optimal execution usually
focuses on the equity markets, as they are the most transparent and most thoroughly researched
markets (many of the results found can be directly applied in other markets). The benchmark of
execution costs is typically the arrival price, which is the average of the bid and ask price in the
market when execution of an order begins (either a buy or sell order). The difference between the
arrival price and the average price obtained for the order is known as the implementation shortfall. If
the aim is to liquidate a given position, the implementation shortfall is the difference between the
market value of the position at the beginning of liquidation, and the amount of cash obtained at the
end of liquidation. The reason that implementation shortfall is different from zero, is the limitations
imposed by market liquidity (or depth) and bid‐ask spreads. At any given point in time there are
buyers and sellers available in the market for a specific number of shares which may be much less
than the size of the order to be executed. Once execution begins, the process of trading the order is
likely to move the market price against the execution trader. When the aim is to buy a number of
shares, the ask price will go up, and when the aim is to sell the bid will fall. This is known as market
impact, and can be either temporary or permanent. An example of temporary market impact is when
the bid‐ask spread widens is response to a large trade. Typically the bid‐ask will revert to its previous
more narrow level once market participants have reacted to the change in price. Permanent impact is
a change in the efficient price that will not immediately readjust to its previous level. As described in
section 4.3.2, the efficient price can be changed by the act of trading alone if such an act is assumed
to convey private information to the market, or if it is a lagged response to information already made
public.
4
Time to market is a significant issue for hedge funds using algorithmic trading strategies. Some of those hedge funds are
known to have placed their servers close to the New York Stock Exchange and other strategic venues to decrease the
latency of data transfer (TEITELBAUM, R., 2007).
AEF Thesis
Page | 19
20. 5. Background Part II: Trading algorithms
5.2.1 Optimal execution with a quadratic utility function
The implementation shortfall problem may be solved by creating an objective function for the
execution trader that takes into account risk‐aversion. Almgren & Chriss (2001) define such an
objective function, and show that it may be minimized with respect to a quadratic utility function or a
value‐at‐risk (VaR) meaure. They show that there are two extremes in the approach to executing a
buy or sell order. One is to execute the entire order immediately, and the other is to execute it at
evenly spaced intervals throughout the trading horizon. The trading horizon places an upper limit on
the amount of time the order execution may take. In between the two extremes there exists an
efficient frontier in the space of time‐dependent liquidation strategies. That is, for a given level of
positive risk‐aversion, there is a single trading strategy that dominates all other possible strategies.
The derivation of the results that follow may seem daunting, but rests on a simple quadratic
minimization problem.5 Using linear trade impact functions facilitates the derivation of explicit
solutions to the minimization problem.
Following Almgren & Chriss (2001), suppose that we hold a block of securities that we wish to
/ , and define the discrete times
liquidate before time . We divide into time intervals
0, … , given by
, for
0, … , . We define a trading trajectory to be a list , … ,
where is the number of units that we plan to hold at time . Our initial holding is
, where
, and
0. We may equivalently define a strategy by the “trade list”
liquidation at time requires
,…
,
is the number of units that we sell between times
1 and .
Clearly, and are related by
∑
∑
, t
0, … , .
A trading strategy can then be defined as a rule for determining in terms of information available
at time
1. An important point is that the optimal strategy is the same at all times for
0, … ,
if prices are serially uncorrelated (see Almgren & Chriss (2001) for proof).
Now suppose that the initial value of our security is , so the initial market value of our position is
. The security’s price evolves according to two exogenous factors: volatility and drift, and one
5
The approach is similar to the derivation of the Capital Asset Pricing Model, although the CAPM is a maximization
problem (CAMPBELL, J. Y. et al., 1997).
Page | 20
AEF Thesis
21. 5. Background Part II: Trading algorithms
endogenous factor: market impact. These characteristics of price movement may be summarized as a
discrete arithmetic random walk
S
S
σ√τξ
τg n /τ , for t
1, … , .
(5.1)
Here is the volatility of the asset, measured in standard deviations per year, ξ are iid normal
random variates, and the permanent impact g v is a function of the average rate of trading
v
n /τ. In equation (5.1) there is no drift term which we interpret as the assumption that we have
no information about the direction of future price movements. Note that typically a continuous
geometric random walk of the kind
(5.2)
is used to model stock prices, where dz denotes a Wiener process (HULL, J. C., 2006). (5.2) may be
approximated in discrete time by
∆
Δz
Δ
√Δ ~
Δz
0,1 ∆
(5.3)
Equation (5.2) models changes in the stock price whereas (5.1) models the level of the stock price.
For the purpose of modeling stock prices intra‐day, (5.1) is a useful approximation of (5.3) and leads
to tractable results.
Returning to the model in equation (5.1), we define temporary market impact as a change in
caused by trading at the average rate , but we do not include this directly in the process of the
efficient price. Rather it is added separately to the objective function. It can be expressed as
n /τ . We now define the capture of a trajectory to be the full trading revenue upon
completion of all trades,
N
n
N
σ√τξ
τg n /τ
x
N
n h n /τ
(5.4)
The first term on the right‐hand side is the initial market value of our position. The second term is the
effect of price volatility minus the change in price as a consequence of the permanent impact of
trading, and the third term is the fall in value caused by the temporary impact of trading. The total
cost of trading can be expressed as
∑N n
and is the implementation shortfall.
AEF Thesis
Page | 21
22. 5. Background Part II: Trading algorithms
Prior to trading the implementation shortfall is a random variable with expectation
and variance
. We readily obtain
N
N
τg n /τ x
n h n /τ
(5.5)
τx
(5.6)
λV x
(5.7)
N
σ
The objective function may then be expressed as
U x
E x
where is a Lagrange multiplier that may be interpreted as a risk‐aversion parameter. The objective
of the analysis is to minimize the objective function in (5.7) for a given risk‐aversion parameter , thus
minimizing the expected shortfall while taking into account the uncertainty of execution. Using a
linear impact function g v
γv the permanent impact term becomes
N
1
γX
2
τg n /τ x
1
γ
2
N
n
and the temporary impact term becomes
h n /τ
η
n
τ
sgn n
Where ‘sgn’ is the sign function. With linear impact equation (5.5) becomes
in which
1
γX
2
N
|n |
η
τ
N
nt
(5.8)
. Almgren & Chriss (2001) show that we may construct efficient strategies by
solving the constrained optimization problem minx:V x
V
E x for a given maximum level of variance
V . This corresponds to solving the unconstrained optimization problem
min E x
λV x
(5.9)
where, as already mentioned, the risk‐aversion parameter is a Lagrange multiplier. The global
minimum of (5.9), can be found by differentiating (5.7) with respect to each yielding
Page | 22
AEF Thesis
24. 5. Background Part II: Trading algorithms
Figure 5‐2: The efficient frontier of time‐dependent
liquidation strategies.
(ALMGREN, R. and Chriss, N., 2001)
Figure 5‐3: Three different trade trajectories for
different values of . (A)
0, (B)
, (C)
0.
(ALMGREN, R. and Chriss, N., 2001)
The point ‘B’ is the naïve minimum variance strategy that corresponds to a risk‐aversion parameter
value of
0. The strategy disregards the role of the variance of and trades at a constant rate
throughout the trading period. The point ‘A’ is an example of an optimal strategy for a trader with a
positive risk aversion coefficient. For a relatively small (first‐order) increase in expected loss
relatively large (second‐order) reduction in loss variance
, a
is obtained. Point ‘C’ illustrates the
optimal strategy of a trader who likes risk, and therefore has a negative risk‐aversion coefficient. It is
clear that all risk‐averse traders will have convex trading trajectories.
Almgren & Chriss (2001) proceeds to show that equivalent results can be obtained by minimizing the
liquidity adjusted value‐at‐risk (L‐VaR). This is the maximum amount an execution trader is willing to
lose, with a given statistical confidence over the trading period. The L‐VaR objective function may be
written as
Var x
E x
λ
V x
(5.14)
where the confidence interval is determined by the number of standard deviations λv from the mean
by the inverse cumulative normal distribution function (we call λ from (5.7) λ to distinguish between
the two). is the probability with which the strategy will not use more than Varp x of its market
value in trading. In other words, the implementation shortfall will not exceed Varp x a fraction of
Page | 24
AEF Thesis
25. 5. Background Part II: Trading algorithms
the time. Because Var x is a complicated nonlinear function of the , we cannot obtain an explicit
minimizing solution such as (5.12)‐(5.13). But once the efficient frontier has been calculated using
(5.12)‐(5.13) it is easy to find the value of λ corresponding to a given value of λ
Extensions to the model in (5.8) can be made by expanding the information set of the trader. This can
be done by including a drift term in price process (5.1) or by assuming that the error term in (5.1) is
serially correlated.
5.2.2 Extensions to the optimal execution model: Drift
A drift term may be added to (5.1) to give
S
S
σ√τξ
ατ
τg n /τ , for t
1, … , .
(5.15)
(5.16)
The optimality condition (5.11) becomes
1
τ
/ 2
in which the new parameter
κ
2
is the optimal level of security holding for a time‐
dependent optimization problem. The optimal trading trajectory and corresponding trade list become
sinh
1
1
2
2
2
1
2
cosh κ T
cosh κt
j
1
2
t
j
1
2
(5.17)
(5.18)
sinh
X
cosh κ T
t
j
1
2
0, … , . (5.17) is the sum of two distinct trajectories: the zero‐drift solution in (5.12) plus a
“correction” which profits by capturing a piece of the predictable drift component by holding a static
position, , in the stock (ALMGREN, R. and Chriss, N., 2001). The difference between the solution in
(5.12) and the one in (5.17) can be seen in a highly liquid market when
1. For a risk‐averse
trader, the optimal trajectory in such market conditions approaches strategy ‘B’ in Figure 5‐3, as the
importance of the risk‐aversion parameter diminishes. In the case of (5.17), however, the optimal
AEF Thesis
Page | 25
26. 5. Background Part II: Trading algorithms
trajectory approaches the optimal static portfolio holding . Near the end of the trading period this
final holding is also sold to satisfy
0 at
.
Define as the optimal solution using (5.12) and
when using (5.17). The gain from the drift‐
enhanced strategy can then be expressed as
1
1
2
1
2
(5.19)
Since tanh x / is a positive decreasing function, this quantity is positive and bounded above by
. Almgren & Chriss (2001) show that for any realistic values of the parameters, this quantity is
negligible compared to the impact costs incurred in liquidating an institutional‐size portfolio over a
short period of time.
5.2.3 Extensions to the optimal execution model: Serial correlation
When , t
0, … , , are serially correlated the optimal strategy becomes dynamic, that is, the best
possible strategy at time
0, is no longer the same as the optimal strategy at time
0. If we
denote the period‐to‐period correlation of by , we may express the maximum per‐period gain as
/4 . As in the case of the drift‐enhanced trajectory, the gains are negligible when using
realistic values for the parameters. Only in the case of an extremely liquid stock with extremely high
serial correlation will the gains be significant for institutional trading (ALMGREN, R. and Chriss, N.,
2001). But in reality those two characteristics are mutually exclusive.
5.2.4 Sub‐conclusion
The optimal execution model of Almgren and Chriss (2001) gives a clear understanding of the tradeoff
between execution uncertainty and market impact. It shows that a utility maximizing risk‐averse
trader who has one day to execute an order, will divide the order over the entire day to minimize
market impact and make optimal use of ‘liquidity pockets’ during the day. Given the assumption of no
serial correlation in prices, the optimal strategy is static and therefore unchanged throughout the
trading period.
Page | 26
AEF Thesis
27. 5. Background Part II: Trading algorithms
The central feature of the model is the creation of an efficient frontier of time‐dependent execution
strategies. The frontier is depicted in a two‐dimensional plane whose axes are the expectation of total
cost and its variance. Each point on the frontier corresponds to the optimal strategy of a trader with a
given level of risk‐aversion.
It is interesting to note that taking into account possible serial correlation or drift in prices, does not
improve the performance of the strategy to a significant extent.
5.2.5 Optimal VWAP Trading
Another approach to the optimal execution problem is to use the volume‐weighted average price as
an execution benchmark. The volume‐weighted average price is defined as
∑
⁄∑
where is the traded price of trade , and is the traded volume of trade for
1,2, … , being
the trades in the VWAP period. An execution trader who has to execute a large buy order during the
period of one trading day can split up the order into smaller bits and seek to obtain a final VWAP
which is close to the market VWAP. This way he will know that the combined order was executed at
reasonable prices given the volatility and liquidity conditions in the market. This is a more useful
benchmark than the simple average price.
Define
as the strategy intra‐day cumulative volume and
cumulative and total volume are denoted by
and
relative volume can then be written as
/
/
as total final volume. Market
, respectively. The strategy’s intra‐day
, and market intra‐day relative volume as
. Here the analysis is limited to buy orders, and unlike in section 5.2 above, the
variable is now normalized between 0 and 1, where 0 means that nothing has been traded, and 1
means that the entire order has been traded and the operation is done. An optimal VWAP strategy is
a strategy that minimizes the expected difference between market VWAP and traded VWAP. This can
where is the controlled trading strategy and
be expressed as
is the market.
Konishi (2002) derives a static optimal execution strategy that minimizes the norm of
min E VWAP M
VWAP x
AEF Thesis
(5.20)
Page | 27
28. 5. Background Part II: Trading algorithms
In this framework, prices follow standard Brownian motion without drift of the form
,
(5.21)
Under this assumption, for a single‐stock trade, if price volatility is independent of market trading
volume, the optimal execution strategy is determined only by the expected market trading volume
distribution and is independent of expectations regarding the magnitude and time dependency of
price volatility (KONISHI, H., 2002). The details of the analysis will not be pursued here. Instead a
generalization of the approach that models intra‐day volume as a Cox process will be presented.
Intra‐day volume as a Cox process
McCulloch (2007) shows that if intra‐day volume is modeled as a Cox (doubly stochastic) point
process then intra‐day relative volume may be modeled as a doubly stochastic binomial point process.
Based on this idea, as well as the results of Konishi (2002), McCulloch and Kazakov (2007) derive an
optimal VWAP trading strategy that takes price drift into account. Prices are assumed to evolve as a
semi‐martingale of the form
, where
is price drift,
is a martingale and is
the initial price. The minimum VWAP risk trading problem is generalized into the optimal VWAP
trading problem using a mean‐variance framework as in section 5.2.1. The resulting optimal strategy
is given by
x
max E
(5.22)
where is a Lagrange multiplier, and is interpreted as the VWAP traders risk‐aversion coefficient.
McCulloch and Kazakov (2007) show that for all feasible VWAP trading strategies , there is always
residual VWAP risk. The residual risk can be written as
variance
and is proportional to the price
of the stock and the variance of the relative volume process
. Empirical testing
shows that relative volume variance is proportional to the inverse of stock final trade count raised
to the power of 0.44.
T
min
σ
dt
σ
K .
The relative volume is the ratio of a random sum specified by the doubly stochastic binomial point
process as the ‘ground process’ over the non‐random sum of all trade volumes. It is assumed that
Page | 28
AEF Thesis
30. 5. Background Part II: Trading algorithms
5.3
Speculative algorithms
5.3.1 Overview
The aim of speculative algorithms is to profit from changes in prices of traded assets by trading
according to specific rules. These rules are typically based on market inputs, such as a live feed of
market prices. The algorithm processes this live input and creates buy and sell signals accordingly. In
order for the algorithm to be successful, the trade signals must be timely and reliable. The frequency
of trading is arbitrary and depends on the nature of the algorithm. It may be a high frequency equity
strategy that trades several times per minute, or a managed futures strategy that take a strategic
position once per month. Speculative algorithms may be based on many different strategies. Three
categories of typical strategies are momentum, relative‐value and microstructure strategies.
Momentum strategies attempt to identify and follow trends in market prices by using statistical
measures such as a moving average cross‐over. They perform well in a market environment that is
characterized by strong trends that are persistent over time. If market prices are moving ‘side‐ways’
or show wildly oscillating behavior, momentum strategies will not perform well.
Relative‐value strategies compare the price of one or more securities to the price of one or more
other securities and trade them against each other when the price difference (or ratio or other
relative measure) diverges from historical norms. The cheap or under‐valued securities are bought
(long position), and the dear or over‐valued securities are sold (short position). The strategy is based
on the idea that if the relative pricing of the securities has diverged from the historical norm, they will
converge again in the future. The obvious risk is that the circumstances or factors that dictated the
pricing of the securities in the past will no longer do so in the future. Therefore, it is possible that the
relative pricing of the securities will never return to the historical level on which the trading strategy
is based, and may continue to diverge. This is known as a regime change, and is the primary risk of
relative‐value trading.
Microstructure strategies attempt to exploit the mechanics of electronic markets. The architecture of
some markets allows information to be extracted and acted upon in a way that is difficult to achieve
without the help of an algorithm. A good example of this is the electronic limit order book. The
‘depth’ of the limit order book varies over time and between stocks and exchanges, but it is typically
Page | 30
AEF Thesis
31. 5. Background Part II: Trading algorithms
reported as the five or ten best bids and offers at a given point in time, along with the quantities of
shares to be bought or sold. This information gives an idea about the supply and demand in the
market at different prices and how the balance changes over time.
In a fast and efficient market, such as the market for shares of large companies, the limit order book is
updated very frequently, and it is a challenge for most traders to process this information, let alone
observe it with accuracy. A computer algorithm may in this case be useful as it can rapidly process the
information in the limit order book and execute trades based on it. A popular order type in electronic
markets is the ‘iceberg’. Iceberg orders reveal only a fraction of total volume at a time, replenishing as
trades are executed. They are used to minimize trade impact by hiding the intentions of the trader
from other market participants. Anecdotal evidence6 suggests that iceberg orders have become
increasingly common in the market for futures contracts on interest rates. As a consequence, the limit
order book of for example Bund7 or Euribor8 contracts reveals less volume at the bid and offer than
what is actually readily available from market participants. In 20006‐2007, Bund and Euribor contracts
with maturity 1‐3 months into the future typically had a total of 500‐2000 contracts on the bid and
ask. By December 2008 the volume had fallen to a few hundred contracts, largely because of iceberg
orders. Open interest and traded volume in the contracts has fallen as well, but not nearly at the
same rate, see Figure 11‐1 in Appendix 11.2 for an illustration. This makes the analysis of historical
limit order books more difficult (TRAGSTRUP, L., 2008).
An example of a microstructure trading strategy is to make use of limit order books that include stop‐
loss orders (TEITELBAUM, R., 2007). A stop‐loss order is an order that traders submit to sell below the
current best bid or buy above the current best offer to close a losing long or short position,
respectively. An algorithm searches for a particularly large stop‐loss sell order close to a
psychologically significant price level such as $15.00, when the stock is trading at, for instance,
$15.05. The algorithm then submits a substantial sell order at, say, $15.01 hoping that the stop‐loss
order at $15.00 will be hit. If the order at $15.00 is executed, it will place significant downward
6
Author’s interview with Senior Execution Trader Lars Tragstrup, Danske Markets (a division of Danske Bank) on
December 30, 2008.
7
Futures contract for the delivery of EUR 100,000 notional principal of German government bonds with a maturity of 7‐10
years at a future date.
8
Futures contract for a 3 month deposit with a notional value of EUR 1,000,000.
AEF Thesis
Page | 31
32. 5. Background Part II: Trading algorithms
pressure on the stock. The algorithm then submits a take‐profit order at a pre‐determined level, for
example at $14.90. If $15.01 is reached, but $15.00 is never reached, the algorithm may submit a
stop‐loss order of its own, at for example $15.05. The same algorithm may be used to trade many
different stocks as it only requires that stop‐loss orders are made publicly available, which may be the
case for all stocks traded on a given exchange.
5.3.2 Pairs trading
Pairs trading will be used as an example of a speculative relative‐value trading algorithm. The basic
idea behind pairs trading is to trade two stocks that move together over time in a systematic way. If
they drift apart to a specific pre‐determined extent, the cheaper stock is purchased and the more
expensive stock is shorted (sold). Proceeds from shorting the second stock should finance most of the
initial purchase. Then the trader waits for the two prices to converge towards their historical price
difference. If and when that happens the position is closed at a profit. The risk is that the two stocks
continue to diverge further, and never return to their historical price difference. In that case the
trader loses money.
The reason that the two stocks should move together is that they may share common factors in the
sense of equilibrium asset pricing such as arbitrage pricing theory (CAMPBELL, J. Y. et al., 1997), or
they are cointegrated in the sense of Engle and Granger (1987). Asset pricing can be viewed in
absolute and relative terms. The pricing of a stock in absolute terms is done by discounting future
cash flows at a discount rate that reflects the company’s risk. It is notoriously difficult to find an
accurate price and there is a wide margin of error due to the uncertainty involved in forecasting the
cash flows and determining an appropriate discount factor. Relative pricing is based on the Law of
One Price, which Ingersoll (1987) defines as the “proposition … that two investments with the same
payoff in every state of nature must have the same current value.” (GATEV, E. et al., 2006). Two
investments with similar future payoffs should therefore trade for a similar value. This may be true for
two similar stocks. The similarity of value will vary over time, but the relationship will be mean‐
reverting to the extent that the fundamentals driving the two stocks don’t change. This is a critical
point in the evaluation of the risk of pairs trading, as the greatest vulnerability of the strategy is
structural breaks. Structural breaks are points in time at which a significant change in the
Page | 32
AEF Thesis
33. 5. Background Part II: Trading algorithms
fundamental valuation of a given security takes place. This is typically due to a company specific event
such as a lawsuit, a new product invention, or a surprising earnings announcement. If the basis for the
historical relationship between two stocks changes significantly, there is no reason why their relative
value in the future should resemble the past.
5.3.3 Cointegration
A theoretical basis for pairs trading is found in cointegration. When a linear combination of two time
series of stocks prices is stationary, while the two individual time series are non‐stationary (which is
usually the case), the two stocks are said to be cointegrated. Suppose that combinations of time
series of stock prices obey the equation:
∑
Where
is the price of stock at time ,
, for
(5.23)
is the regression coefficient of stock on stock
, and
is a covariance stationary error term in the sense of Shumway and Stoffer (2006). Assuming that
are covariance stationary after differencing once, the price vector is integrated of order 1 with
cointegrating rank
independent vectors
(ENGLE, R. F. and Granger, C., 1987). Thus, there exist r linearly
,…,
such that
are weakly dependent. In other words, r linear
combinations of prices will not be driven by the k common non‐stationary components . The non‐
stationary components are in this case k stocks in the population of stocks that are redundant in the
process of creating cointegrating vectors
. The cointegrating rank of the individual price vectors is
not used explicitly in the creation of pairs trading strategies in this paper. Yet the concept serves to
show that in a given population of stocks, there may be several possible linear combinations of stocks
with a cointegrating relationship.
Note that this interpretation does not imply that the market is inefficient, rather it says that certain
assets are weakly redundant, so that any deviation of their price from a linear combination of the
prices of other assets is expected to be temporary and reverting (GATEV, E. et al., 2006).
The idea that a linear combination of two stocks may be covariance stationary, may be interpreted as
saying that a cointegrating vector may be partitioned in two parts, such that the two corresponding
portfolios are priced within a covariance stationary error of each other. Given a large enough
AEF Thesis
Page | 33
34. 5. Background Part II: Trading algorithms
population of stocks, this statement is empirically valid and provides the basis for identifying pairs of
stocks suitable for pairs trading (GATEV, E. et al., 2006).
A research note on pairs trading from Kaupthing Bank recommends the use of cointegration tests for
pair selection (BOSTRÖM, D., 2007). The argument is that the more significant the cointegration test
is, the more likely it is that the pairs trade will work. Two tests for cointegration are mentioned, the
Engle‐Granger test and the Durbin‐Watson test9. The Engle‐Granger test is based on the Dickey‐Fuller
unit‐root test for stationarity. It starts by regressing one time series, , on another, :
α
β
(5.24)
(5.25)
The residuals from this regression are then used to perform the regression:
∆
β
ε
where ∆ denotes the difference operator and ε is a white noise error term. The t‐statistic of the β
parameter in (5.25) is called the tau‐statistic10, the critical values of which can be found in Gujarati
(2003) and in most statistical software packages. If the absolute value of the t‐statistic obtained is
larger than its critical tau value, the residuals are integrated of order 0, 0 , that is, they are
stationary, and the two series and are cointegrated.
Engle and Granger (1987) compare various measures of stationarity as a means of testing for
cointegration and conclude that the Dickey‐Fuller test is the most powerful in a statistical sense. They
note that if the data is autocorrelated the augmented Dickey‐Fuller (aDF) test should be used. The
aDF test assumes that the observed time series is driven by a unit‐root zero drift process, i.e. an
ARIMA(P,1,0) model with P autoregressive terms. It is based on the regression
ζ Δ
for some AR(1) coefficient
ζ Δ
ζ Δ
ε
(5.26)
1, and a number of lags . If the observed time series is a random
walk with drift, a constant term can be included in the above regression. The stock price data used in
section 8.2 is normalized, however, so the constant term is not different from zero in a statistical
sense. Therefore the model in equation (5.26) is correctly specified.
9
See Appendix 11.3 for a definition of the Durbin‐Watson test.
Note that there is no connection to Kendall’s tau distribution.
10
Page | 34
AEF Thesis
35. 5. Background Part II: Trading algorithms
Boström (2007) uses cointegration tests as one amongst a number of statistical tests to evaluate the
quality of a pairs trade. I.e. the back‐testing procedure described in the paper requires each pair to
have Engle‐Granger and Durbin‐Watson test statistics above certain pre‐specified levels. A similar
method will be used in section 8.2, specifically the MATLAB function ‘dfARTest’, which performs an
augmented Dickey‐Fuller test assuming zero drift in the underlying process.
5.3.4 Pair selection and trading signals
There are several possible approaches to choosing pairs. One way is the method of testing for
cointegration described above. Another is the use of a minimum distance criterion between the
normalized prices of the stocks in a given population. This method is used by both Gatev et al 1997
and Perlin (2007). The first step of the method is to normalize the price series of each stock in the
population of stocks (the population can be chosen arbitrarily as the members of a stock index or all
stocks traded on a given exchange, for example). In this way, stocks with different price levels may be
⁄ where
compared in a consistent way. This may be written as
stock at time ,
respectively, and
is the price of
and are the mean and standard deviation of the price series of stock ,
is the normalized price. We denote the normalized price of the pair of
and the difference between the two as
by
,
. To find a suitable pair for a stock in a
population of n other stocks, we find the stock that minimizes the sum of the squared differences (
norm) for
1,2, … , : min ∑
. In a given population of stocks, there may be several stocks
that have a similarly low minimum distance value, but for the purpose of this paper, only the stock
with the lowest value is chosen.
Although this method of finding pairs is strictly defined, it is possible to guess towards the
characteristics of possible pairs. Depending on the chosen population of stocks, two candidates for a
pairs trade are probably in the same industry, trade on the same stock exchange, and share other
features such as scale of operation, geography, and market value.
Once pairs have been identified, the distance
between each target stock and its pair is evaluated
on a daily basis. For some pre‐specified constant , when |
Depending on whether
|
a pairs trade is opened.
is positive or negative, the target stock is sold or bought, respectively, and
the opposite position is taken in its pair. The unit of the difference in normalized prices can be vaguely
AEF Thesis
Page | 35
36. 5. Background Part II: Trading algorithms
interpreted as the number of standard deviations between the two (because both prices have been
normalized). Therefore a logical level for would be 2, as this would imply a two standard deviation
difference to the historical normalized spread, which can be considered a low‐probability event (at
approximately the 5% level if the normalized spread has a normal distribution). Another possibility is
to define as
. denotes standard deviation. In this
for some constant , where
way, the barrier level will be unique for each pair, and will reflect the specific volatility of
. Again,
a logical value for is 2.
The size of the two positions may be determined in various ways. One option is to use linear
regression to determine the weight of the pair stock, , as if it were a hedge:
α
(5.27)
Another option is for both to have the same initial market value. The size of the two positions will
change over time as the market prices of the two stocks change. They may either be rebalanced or
left alone, the risk is that one position will become much larger or smaller than the other, so the
overall market exposure becomes either positive or negative. This is particularly clear when a large
portfolio of pairs is traded simultaneously.
The regression method of weighing positions suggests an alternative approach to determining the
price ‘distance’
. The residual
from equation (3.30) is the deviation of
from
given the
estimated parameters αi and . It may be used as a trading signal by defining a barrier level
in the same way as described above. The method can be used on regular prices as
well, that is
and
, as the constant term αi takes into account the difference in levels.
Section 8.2 will present empirical results based on the method of normalized prices and pair positions
with equal market value.
5.3.5 Multivariate pairs trading
The idea of pairs trading can be extended to trading a portfolio of one more stocks against another
portfolio of stocks (PERLIN, M. S., 2007b). Using the notation from above for normalized prices this
can be expressed as
explains
where
is some function of a matrix with information that
. This information could be any economic variable, but if it isn’t the price of a security, it
cannot be traded. If this is the case it is still possible to create a strategy that trades
Page | 36
AEF Thesis
‘outright’
37. 5. Background Part II: Trading algorithms
against the ‘signal’ in
, but the strategy will not be market neutral. Since this paper focuses on
market neutral relative‐value strategies, only tradable securities will enter the matrix. The
normalized price of target stock
may be compared to the normalized prices of a portfolio of
other stocks, yielding the expression
1
1
where is a constant, is an error term, and
(5.28)
1, . . , are the weights given to each stock. To
,
simplify,
∑
The stocks in the
.
1
(5.29)
portfolio, which we shall call the M‐pair portfolio, may be found in various ways.
One approach is to compare
with each candidate for
individually, by means of a minimum
distance criterion or a cointegration test. Alternatively OLS may be used on various combinations of
stocks in
(highest R2).
, to find which combination best explains
But since both
and
are non‐stationary (the process of normalization doesn’t affect unit root
non‐stationarity), the problem of spurious regression arises, i.e. the might be non‐stationary. One
way to get around the problem is to use discrete or log returns of
series
and
(i.e. not the normalized
),
∑
∆
and
1
∆
.
(5.30)
where is a white noise error term.
But if there is a cointegrating relationship between
stationary. In that case, it is possible to use the
and its M‐pair portfolio
, in (5.29) may be
coefficients for statistical inference.
The M‐pair portfolio may be created in several ways. One obvious approach is to use the stocks
with least ( norm) distance to
individually, as was done for a single stock in section 5.3.4.
Another approach is to use an iterative procedure that maximizes the degree of cointegration
between
and
. The first stock in
will be chosen using the minimum distance criterion. Each
subsequent stock will be chosen to minimize the augmented Dickey‐Fuller test statistic of the error
AEF Thesis
Page | 37
38. 5. Background Part II: Trading algorithms
term in (5.29). The benefit of the method is that it ensures that
are cointegrated11. The
and
downside is that it is difficult to say a priori whether this will actually improve the algorithm. It is not
certain that the additional stocks added to
contain useful information.
In order to trade the M‐pair portfolio, we must scale the
in (5.29) so that they sum to one. This is
/ ∑
done by dividing each weight by the sum of the weights to obtain
. The
sum to
one, so scaling the positions by these parameters ensures that the market exposure of the M‐pair
portfolio will be equivalent to the target stock
.12
Perlin (2006b) also suggests using a correlation weighting scheme that calculates the weights as
/ ∑
for
1, . . , . It is difficult to see what the advantage of this method should be,
except that the weights will reflect the relationship between each
the other
and
without the effect of
.
An alternative approach to multivariate pairs trading is to use state space methods to extract a signal
from one or more stocks against which to trade
. State space models allow the estimation of
unobserved processes based on observations. This unobserved process, which is called a signal, can
be based on one or more stocks including the reference stock. Section 6 will present the concept of
state space models, and section 8.3 will use such a model for multivariate pairs trading.
11
To the extent that the augmented Dickey‐Fuller test works.
The strategy will only be market neutral initially. Price fluctuations from day to day will change the magnitudes of the
various positions, bringing the strategy out of ‘balance’. Unless the positions are rebalanced on a daily basis, net market
exposure will be different from zero.
12
Page | 38
AEF Thesis
39. 6. Background Part III: State space models
6
6.1
BACKGROUND PART III: STATE SPACE MODELS
Introduction
This section will provide general background on state space models, and illustrate the properties that
are used in section 8.3 on multivariate pairs trading. State space models were originally invented as a
tool to track the position and trajectory of space craft. Given a set of inputs from various sensors and
tracking devices, such as velocity and azimuth, it was necessary to estimate the unobserved quantities
of position and trajectory in a computationally efficient way. Furthermore, these estimates had to be
continuously updated as new observations came in from the sensors and tracking devices. This led to
the Kalman filter, a method of recursive updates of a system of equations which is the underlying
construct of state space models. The benefits of state space models are their inherent flexibility and
scope of application, and their computational efficiency is a major benefit in terms of numerical
estimation of parameters. Examples of applications include structural models of trend and
seasonality, exponential and spline smoothing, as well as stochastic volatility. State space models can
be considered an alternative to the ARIMA system of analysis of Box and Jenkins (see fx Box et al
1994). ARIMA models require that the time series used as input are covariance stationary, so it is
typically necessary to detrend data by taking one or more differences. This is not required in the state
space approach where data characteristics such as trend and seasonality may be modeled explicitly.
This is a fundamental difference between the two methods. Furthermore it is interesting to note that
ARIMA analysis may be expressed and estimated in state space form.
6.2
The linear Gaussian state space model
This section will describe the linear Gaussian state space model. The description is adapted from
Durbin & Koopman (2001), but will also include elements from Shumway & Stoffer (2006) and Welch
& Bishop (2006). The general linear Gaussian state space model can be written in the form
yt Z t t t
t ~ N 0, H t
t 1 Tt t Rtt
t ~ N (0, Qt )
AEF Thesis
t 1,..., n
(6.1)
Page | 39
40. 6. Background Part III: State space models
where yt is a p x 1 vector of observations and t is an unobserved m x 1 vector called the state
vector. The idea underlying the model is that the development of the system over time is determined
by t according to the second equation of (6.1), but because t cannot be observed directly, an
estimate is made of t based on the observations yt . The first equation of (6.1) is called the
observation equation, and the second is called the state equation. Z t is a p x m matrix called the
observation matrix, and Tt is the state evolution matrix with dimensions m x m. In most applications
including the ones in this paper, Rt is the identity matrix. The matrices Z t , Tt , Rt , H t and Qt are
either assumed known or estimated, depending on how the model is constructed. Typically, some or
all of the elements of these matrices will depend on elements of an unknown parameter vector ,
which can be estimated with an optimization algorithm. The error terms t and t are assumed to be
serially independent, and independent of each other over time. The initial state vector 1 is assumed
to be N a1 , P independently of 1 ,..., n and 1 ,...,n , where a1 and p1 may be assumed known or
1
estimated. Note that the first equation of (6.1) has the structure of a linear regression model where
the coefficient vector t changes over time. The second equation represents a first order vector
autoregressive model, “the Markovian nature of which account for many of the elegant properties of
the state space model.”
This general specification is a powerful and flexible tool that makes the analysis of a wide range of
problems possible. The main point is that a vector of one or more underlying signals t can be
estimated using a vector of observations yt . It is possible to include additional known inputs in both
the observation and state equation, but this is not used in the subsequent analysis and will therefore
not be described here. The multivariate case is a straight‐forward extension where the disturbances
are written as
t ~ N 0, t ~ N 0,
where and are p x p and m x m covariance matrices. The disturbances may be independent
(diagonal covariance matrices) or correlated instantaneously across series.
Page | 40
AEF Thesis