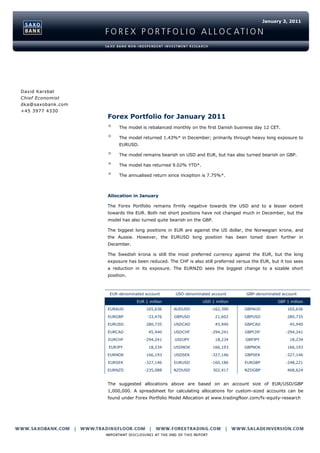
Forex Portfolio for January 2011
•
0 j'aime•317 vues

The Forex Portfolio remains firmly negative towards the USD and to a lesser extent towards the EUR. Both net short positions have not changed much in December, but the model has also turned quite bearish on the GBP

Recommandé
Recommandé
Contenu connexe
Similaire à Forex Portfolio for January 2011
Plus de Trading Floor
Plus de Trading Floor (20)
Dernier
Dernier (20)
Forex Portfolio for January 2011
- 1. January 3, 2011 David Karsbøl Chief Economist dka@saxobank.com +45 3977 4330 Forex Portfolio for January 2011 The model is rebalanced monthly on the first Danish business day 12 CET. The model returned 1.43%* in December; primarily through heavy long exposure to EURUSD. The model remains bearish on USD and EUR, but has also turned bearish on GBP. The model has returned 9.02% YTD*. The annualised return since inception is 7.75%*. Allocation in January The Forex Portfolio remains firmly negative towards the USD and to a lesser extent towards the EUR. Both net short positions have not changed much in December, but the model has also turned quite bearish on the GBP. The biggest long positions in EUR are against the US dollar, the Norwegian krone, and the Aussie. However, the EURUSD long position has been toned down further in December. The Swedish krona is still the most preferred currency against the EUR, but the long exposure has been reduced. The CHF is also still preferred versus the EUR, but it too sees a reduction in its exposure. The EURNZD sees the biggest change to a sizable short position. EUR-denominated account USD-denominated account GBP-denominated account EUR 1 million USD 1 million GBP 1 million EURAUD 165,636 AUDUSD -162,390 GBPAUD 165,636 EURGBP -33,476 GBPUSD 21,602 GBPUSD 280,735 EURUSD 280,735 USDCAD 45,940 GBPCAD 45,940 EURCAD 45,940 USDCHF -294,241 GBPCHF -294,241 EURCHF -294,241 USDJPY 18,234 GBPJPY 18,234 EURJPY 18,234 USDNOK 166,193 GBPNOK 166,193 EURNOK 166,193 USDSEK -327,146 GBPSEK -327,146 EURSEK -327,146 EURUSD -160,186 EURGBP -248,221 EURNZD -235,088 NZDUSD 302,417 NZDGBP 468,624 The suggested allocations above are based on an account size of EUR/USD/GBP 1,000,000. A spreadsheet for calculating allocations for custom-sized accounts can be found under Forex Portfolio Model Allocation at www.tradingfloor.com/fx-equity-research
- 2. January 31, 2011 The Saxo Bank Forex Portfolio Model Forex Portfolio: The model was backtested from October 1991 to September 2008 during which period it yielded 106.9% or 0.36% per month before costs in the EUR-denominated account*. Realized Returns From October 2008 to September 2009 the model was further backtested on „out-of- Month Return (%) sample‟ data to further validate its performance. The model was launched in October 1, 2009. 2009 October 0.32 2009 November 0.68 Saxo Bank Forex Portfolio Model: Realised Results* (Oct. 2009 - ) Accumulated capital 2009 December -0.31 from investing EUR 1 ultimo September 2009 2010 January -0.41 1.4 2010 February 2.10 1.3 2010 March 0.17 1.2 2010 April 0.59 1.1 2010 May 0.96 1.0 2010 June 3.60 0.9 2010 July -1.62 0.8 12/09 06/10 09/09 03/10 09/10 12/10 2010 August 3.38 2010 September -0.80 Single Leverage (7.75% p.a.) Double Leverage (15.76% p.a.) Triple Leverage (24.03% p.a.) 2010 October 0.49 2010 November -1.06 Saxo Bank Forex Portfolio Model: Backtesting Results* (Oct. 1991 - Sep. 2008) 2010 December 1.43 Accumulated capital from investing EUR 1 YTD 9.02 15.0 Since inception 9.77 12.5 Since inception 7.75 (annualized) 10.0 7.5 5.0 2.5 0.0 1991 1996 1997 1998 2003 2004 2005 1992 1993 1994 1995 1999 2000 2001 2002 2006 2007 2008 2009 Single Leverage (4.67%) p.a. Double Leverage (9.21%) p.a. Triple Leverage (13.59%) p.a. Saxo Bank Forex Portfolio Model - Monthly returns in backtesting* (%, Oct. 1991 - Sep. Obs. 2008) 35 30 25 20 15 10 5 0 0.0 6.5 7.0 7.5 8.0 8.5 9.0 9.5 0.5 1.0 1.5 2.0 2.5 3.0 3.5 4.0 4.5 5.0 5.5 6.0 10.0 -10.0 -3.5 -3.0 -2.5 -2.0 -1.5 -1.0 -0.5 -9.5 -9.0 -8.5 -8.0 -7.5 -7.0 -6.5 -6.0 -5.5 -5.0 -4.5 -4.0 *Past performance disclaimer This publication refers to past performance. Past performance is not a reliable indicator of future performance. Indications of past performance displayed on this publication will not necessarily be repeated in the future. No representation is being made that any investment will or is likely to achieve profits or losses similar to those achieved in the past or that significant losses will be avoided. Statements contained on this publication that are not historical facts and which may be simulated past performance or future performance data are based on current expectations, estimates, projections, opinions and beliefs of the Saxo Bank Group. Such statements involve known and unknown risks, uncertainties and other factors, and undue reliance should not be placed thereon. Additionally, this publication may contain 'forward-looking statements'. Actual events or results or actual performance may differ materially from those reflected or contemplated in such forward-looking statements. The model input The model‟s inputs are individual country indicators, which measure the underlying economic strength (contraction or expansion) of the following 10 currencies: NZD, AUD, 2
- 3. January 31, 2011 CAD, JPY, EUR, GBP, USD, CHF, SEK, and NOK. The country indicators, which are designed to reflect the macroeconomic strength of each economy, are based on 22 individual economic time series for each country. The allocation signals are generated by changes in spreads between the fundamental country indicators. More capital is allocated to currencies with relatively strong economic activity (and positive rate outlook), funded by short positions on currencies with weak economic activity (weak rate outlook). For example, if the Eurozone fundamental country index suddenly drops (increases) relative to the US fundamental index, the model, all else being equal, would reduce (increase) exposure to EURUSD. Additionally, positions are scaled up or down according to the volatility of the currency crosses in question so the expected risk-adjusted return for positions in EURCHF is the same as for positions in the normally more volatile EURCAD. Allocations are presented as net exposures against EUR, USD, or GBP to reduce both the number of possible combinations and most illiquid crosses. Returns are based on Bloomberg monthly carry-adjusted currency data. The model therefore does not include costs related to minimum trading size, slippage, rollover, spreads, and taxes. Allocation update The model will be published on www.tradingfloor.com by Saxo Bank on the first banking day of the calendar month. While Saxo Bank publishes the model‟s suggested allocation, the bank is not responsible for the monthly reweighting of the portfolio. For a EUR-denominated account, the sum of all EUR positions following the model will deviate from the amount allocated to follow the model. For example, the holder of a EUR 1 million account might choose to allocate EUR 1 million to follow the model, but the sum of EUR exposure will not equal EUR 1 million. The reason is that one needs to look at the net exposures. If the model is long 100,000 EURUSD and short 100,000 EURJPY, the net exposure in EUR on these two positions is actually zero. The sum of total position sizes in EUR might therefore deviate from EUR 1 million, since the model is only looking at net exposures of the currencies in question. The reason is that the model follows 10 currencies, but the net exposures are established via only nine crosses. The sum of all these exposures is then either net long or short, depending on the model‟s prediction on EUR itself. Attractive features The model is always well diversified and is always in the market. It is therefore not exposed to “timing issues”. It does not use stops, since the overall volatility of returns tends to be low (especially on single leverage). One particularly interesting feature is that returns tend to be almost completely uncorrelated to returns in stock markets (correlation = 0.10) and other risky asset classes (correlation to the CRB Index is 0.11). Therefore, if the backtesting since 1991 is indicative of future returns*, it would make a lot of sense to use part of one‟s portfolio to allocate to the FX Model and thereby decreasing overall portfolio volatility without lowering returns too much (depends on the leverage used) or at all. *Past performance disclaimer This publication refers to past performance. Past performance is not a reliable indicator of future performance. Indications of past performance displayed on this publication will not necessarily be repeated in the future. No representation is being made that any investment will or is likely to achieve profits or losses similar to those achieved in the past or that significant losses will be avoided. Statements contained on this publication that are not historical facts and which may be simulated past performance or future performance data are based on current expectations, estimates, projections, opinions and beliefs of the Saxo Bank Group. Such statements involve known and unknown risks, uncertainties and other factors, and undue reliance should not be placed thereon. Additionally, this publication may contain 'forward-looking statements'. Actual events or results or actual performance may differ materially from those reflected or contemplated in such forward-looking statements. 3
- 4. January 31, 2011 For more trading commentary on forex, equities, and commodities go to www.tradingfloor.com or www.saxobank.com NON-INDEPENDENT INVESTMENT RESEARCH This investment research has not been prepared in accordance with legal requirements designed to promote the independence of investment research. Further it is not subject to any prohibition on dealing ahead of the dissemination of investment research. Saxo Bank, its affiliates or staff, may perform services for, solicit business from, hold long or short positions in, or otherwise be interested in the investments (including derivatives), of any issuer mentioned herein. None of the information contained herein constitutes an offer (or solicitation of an offer) to buy or sell any currency, product or financial instrument, to make any investment, or to participate in any particular trading strategy. This material is produced for marketing and/or informational purposes only and Saxo Bank A/S and its owners, subsidiaries and affiliates whether acting directly or through branch offices (“Saxo Bank”) make no representation or warranty, and assume no liability, for the accuracy or completeness of the information provided herein. In providing this material Saxo Bank has not taken into account any particular recipient‟s investment objectives, special investment goals, financial situation, and specific needs and demands and nothing herein is intended as a recommendation for any recipient to invest or divest in a particular manner and Saxo Bank assumes no liability for any recipient sustaining a loss from trading in accordance with a perceived recommendation. All investments entail a risk and may result in both profits and losses. In particular investments in leveraged products, such as but not limited to foreign exchange, derivates and commodities can be very speculative and profits and losses may fluctuate both violently and rapidly. Speculative trading is not suitable for all investors and all recipients should carefully consider their financial situation and consult financial advisor(s) in order to understand the risks involved and ensure the suitability of their situation prior to making any investment, divestment or entering into any transaction. Any mentioning herein, if any, of any risk may not be, and should not be considered to be, neither a comprehensive disclosure or risks nor a comprehensive description such risks. Any expression of opinion may be personal to the author and may not reflect the opinion of Saxo Bank and all expressions of opinion are subject to change without notice (neither prior nor subsequent). This publication refers to past performance. Past performance is not a reliable indicator of future performance. Indications of past performance displayed on this publication will not necessarily be repeated in the future. No representation is being made that any invest ment will or is likely to achieve profits or losses similar to those achieved in the past, or that significant losses will be avoided. Statements contained on this publication that are not historical facts and which may be simulated past performance or future performance data are based on current expectations, estimates, projections, opinions and beliefs of the Saxo Bank Group. Such statements involve known and unknown risks, uncertainties and other factors, and undue reliance should not be placed thereon. Additionally, this publication may contain 'forward-looking statements'. Actual events or results or actual performance may differ materially from those reflected or contemplated in such forward-looking statements. This material is confidential and should not be copied, distributed, published or reproduced in whole or in part or disclosed by recipients to any other person. Any information or opinions in this material are not intended for distribution to, or use by, any person in any jurisdiction or country where such distribution or use would be unlawful. The information in this document is not directed at or intended for “US Persons” within the meaning of the United States Securities Act of 1993, as amended and the United States Securities Exchange Act of 1934, as amended. This disclaimer is subject to Saxo Bank's Full Disclaimer available at www.saxobank.com/disclaimer. Risk Warnings FX Trade Currency and Price Currency When an investor trades in the Forex market, they always trade a combination of two currencies (a cross or currency pair) in which one currency is bought (long) and the other is sold (short). This means the investor is speculating on the prospect of one of the currencies appreciating in value in relation to the other. Forex Margin Trading Margin trading allows investors to buy and sell assets that have a greater value than the capital in their account. Forex trading is typically executed on margin accounts, and the industry practice is to trade on relatively small margin amounts since currency exchange rate fluctuations tend to be less than one or two percent on any given day. Margin trading does involve a certain amount of risk. Since a position is being held that exceeds the actual value of the account, a trader could incur substantial losses if the market moves against his position. Thus, margin trading requires close monitoring of margin utilization, i.e. the amount of collateral being used to hold margined positions. If margin utilization exceeds collateral available for margin trading, positions must be closed, reduced, or additional funds must be posted to cover the position. Supervision The Saxo Bank Group is under the supervision of the Danish Financial Supervisory Authority (In Danish: "Finanstilsynet") and is subject to the Danish Executive Order on Good Business Practice for Financial Undertakings. Saxo Bank A/S Philip Heymans Allé 15 2900 Hellerup Denmark Phone: +45 39 77 40 00 Reg. No. 1149 CVR. No. 15731249 4