SlideShare une entreprise Scribd logo
1  sur  98
Télécharger pour lire hors ligne
Topic Time (Hrs)
Introduction - Financial Statements 1
General Ledgers - Purchase, Sales, Inventory, Fixed Assets 2
General Ledgers - Sundry Creditors, Debtors, Capital, Cash 2
Trial Balance 1
Trading A/c and Profit and Loss A/c 1
Balance Sheet 1
Future Looking Statements and Cash Flow Statement 1
Future Looking Statements and Depreciation and Working Capital 1
A full blown Q on FM with FS (without future) and Notes to Accounts 1
Sector Specific Models - Manufacturing vs IT vs Restaurants 3
Ratios from Financial Models 1
Conclusion - Common errors, Excel errors, and revision! 1
16
Topic Time (Hrs)
Introduction to Valuation 1
Valuing Assets and Liabilities 1
Equity - Discounted Cash Flow 2
Equity - Dividend Discount Model 1
Equity - Relative Valuation Models 1
IPO Valuation - tips and tricks 1
M&A valuation 1
CAPM and Fama French Models 1
Net Asset Value 1
Debt Valuation - techniques 1
Preference Share - overview 1
Options - Introduction 1
Conclusion 1
14
1. Introduction to Financial Statements Underline - CTRL + U
- What are financial statements? What forms a part of financial statements?
- Who prepares financial statements? Are these all Chartered Accountants?
- Why do we need financial statements?
- Who is responsible for the accuracy of these financial statements?
- What is financial modelling?
- Do we really prepare financial statements or models in excel? Is that what happens in a corporate?
What are financial statements? What forms a part of financial statements?
There are three items that are a aprt of every financial statement - Profit and Loss Account, Balance She
Profit and Loss Account - will tell you how much profit/ loss a company has enjoyed/ suffered! Periodic!
If Reliance - P/L says Profit is $4cr for Q-1.
April - June = Profit is 4 cr.
June 30th P/L = 4 cr.
July 1st P/L - profit of 1 L.
Option A Will you 4 Cr + 1 L in the July 1st P/L?
Option B Will you see 1 L in the July 1st P/L?
Wildcard Will you see only 4 cr in the July 1st P/L?
Answer Option B
P/L will be reset to 0 at the end of a period! That is why we say P/L is periodic!
Balance Sheet - Balance Sheets are not periodic!
If Reliance Balance - Debtors - people who owe money to Mr Ambani/ Reliance - 5 Cr as of March 31, 202
on April 1 is 10L.
Option A Will it be 5 Cr + 10L?
Option B Will it be just 10L?
Wildcard Will it be 5 Cr?
Answer Option A - it will be 5 Cr + 10 L.
just because a period is over, if you owe Reliance money, don’t think that they will forgive the
You still owe Reliance money!
Cash Flow Statements - a mix of the two.
Great cashflow is always good!
Bad cashflow can be good/ bad!
We will always prefer good cashflow!
Who prepares financial statements? Are these all Chartered Accountants?
Lets imagine Reliance - who prepares their financial statements?
Knowledge Regulation
Option A Is it Mr Ambani/ Mrs Ambani/ Ambani Jr? Yes Yes
Option B Is it their accountants? Yes Yes
Option C Is it their chartered accountants alone? Yes Yes
Option D Is it their auditors? Yes NO!!!!! Conflict of Interest!
Option E Mr Tendulkar? No Yes
Wildcard Any of the above? NO! NO!
The knowledge is important, regulation is important! Nothing else is important!
Knowledge?
Promoters, owners, accountants, chartered accountants - anybody with knowledge and not explicitly barre
Why do we need financial statements?
Analysis!
Who does these analysis?
Equity analysts - to decide whether we want to buy or sell?
Shareholders - who decide whether their shareholding is worth it
Government - to decide if your profit is accurate? Why? Because profit determines how much tax you pay
Equity analysts - from a profitability and long term aspect!
Shareholder - only till they actually own the shares!
Government - only for that particular year.
Some other people - employees, clients, etc.
Financial statement cycle - the period for which FS are prepared!
Quarterly, with consolidation at year end!
Q-o-Q analysis (Is Q4 better than Q3?)
Y-o-Y analysis (is 2020 better than 2019?)
Purpose of analysis -> the actual FS prepared/ reviewed!
Who is responsible for the accuracy of these financial statements?
We know who prepares these FS!
Q - who goes to jail if these FS are wrong?
Option A The accountant who prepares!
Option B The chartered accountant who is the accountant's boss in the company!
Option C Mr Ambani?
Option D Yeh Modi Ji!
Option E Mr Tendulkar
Wildcard Option! The Directors of the Company!
Option F?
Option G?
Answer ! It is the responsibility of both the directors of the company, as well as the auditors!
Sathyam Infotech?
FS were prepared wrong! The auditors audited it, and said "Brilliant FS"!
So people invested in the company, gave loans, etc!
What happened after that? Issues with the company!
Who went to jail?
Both the auditors as well as the directors of the company whi signed on the financial statements went to ja
Directors - will sign on the FS!
Auditors - will sign on a report that they give saying that FS is accurate! (Auditors Report!)
If anything is wrong with the FS -> both auditors as well as the directors will be held responsible?
Mandating - made compuslory -> by a lot of laws and regulations - > is called Sarbanes Oxley Act!
Responsibility -> is only with the people who sign the FS!
What is financial modelling?
Lets think about why people join a class in financial modelling?
Option A! $$$$$$$$$$$$$$$$$$$$$$$$$$$$$$$$$$$$$$$$$$$$
Lot of money!
Option B! Get a job!
Option C! Big Bang Theory? Sheldon Cooper?
people who just want to know!
Option D! Dalal Street guys!
Viability of a company!
Is this company good? ROCE? ROI? EBITDA? GP NP ratio?
Option E! CFA Level 1 - FRA help?
CA guys?
ICWA/ CS guys?
The task of building an abstract representation of a real world financial structure!
Building - you create the model!
abstract - random - no rules/ regulations followed! Purpose is to understand, review something! Not to be
representation of a real world financial structure! It will have the same result/ outcome of a full blown FS, b
immateriality! - it matters, but it wont change the way you look at something.
Lets take that example of the scene from DDLJ - SRK in the train, and Kajol running to catch it!
In the real world, do you think this is possible?
Immaterial items - will not impact you as a whole! Material items will!
Do we really prepare financial statements or models in excel? Is that what happens in a corporate?
There are a lot of other tools, with better protection! Data = gold?
Tally! - that helps with FS!
Quantrix! - that helps with financial models!
SAP - this is an ERP! Enterprice resource planning!
Tableau! - very interesting, please google!
So it is not always made in excel!
But excel is the most convenient! Would definitely encourage taking a look at the other softwares too pos
End product might be on a different database - but excel is always used!
THE END!
General Ledgers - Purchase, Sales, Inventory, Fixed Assets
Purchase Ledgers!
There are two varities of modelling a ledger - but before we get into it -
what is a ledger?
it's simple!
There are different pathways to arrive at the P/L of a company! That is - when a transaction is executed, it passes through different books of record!
For eg - Reliance buys a huge factory outlet for making clothes! Reliance Apparels! (Imaginary!)
All of our discussion in financial modelling will be with respect to Reliance Apparel!
This is a brick and mortar cloth store (imaginary!) that makes clothes, sells it and makes money!
What are we going to do?
I'm going to walk you through how Reliance Apparel purchases, records transactions and all we will be modelling some sample transaction for Reliance!
We are only going to look at purchase related items for Reliance Apparel!
Main books for record!
Purchase Ledger / Sales Ledger - > Cash/ Debtors/ Creditors Book -> Trial Balance -> Trading P/L -> Balance Sheet and Cash Flow Statements
Purchase Ledger - is to record all purchases! However you want! Accounting rules do not matter in modelling! As long as logical sense prevails!
What is covered under a purchase book?
Option A Reliance Apparel purchases 100 kgs of wool for stitching purposes! This is one year! So purchase!
Option B Reliance Apparel purchases the factory - and when we say factory here - we mean the entire land, building, construction etc.! The factory will l
Option C Reliance Apparel purchases some stitching machines for stitching the clothes! Not one year, > 1 year! So fixed assets!
Anything that is related to trading! Related to expensing in one year - all of this is going to be called puchases!
Anything that can be used for > 1 year - don’t model it as a purchase - model it as a fixed asset! DON’T BREAK YOUR HEAD ON WHAT A FIXED ASSET IS
Date Purchased Item Tax Gate Pass No. Amount (CTRL + B = BOLD)
ALT + O + C + A Jan 1, 2021Wool 10% MH-4-01012021-102 20,000
TO fit content!
Imagine if this item was returned?
Date Purchased Item Tax Gate Pass No. Amount
Jan 1, 2021Wool 10% MH-4-01012021-102 20,000
Jan 5, 2021Wool - Returns 10% MH-4-01012021-102 -20,000 CTRL + D = The same text as the above cell - don’t forget to drag the ce
Modelling purchases - means I am trying to predict purchases in a company!
Model Parameter! [1] Imagine Reliance Apparel in the beginning (2021 January!) decides to make only winter clothing!
Its main input is wool purchased from local wholesale delaers, and main output is the sweaters it makes under the fancy brand called RA!
It makes sweaters only in one color - black!
For similar sweater manufacturers, the proportion of wool required per sweater is between 3 kg -5 kg depending on the sweater size!
Sweater is made in three sizes - Small, Medium and Large!
Mrs Ambani who owns RA - expects to sell 1000 sweaters in 2021, increasing it by 10% every year till 2025.
Proportion of sizes for sweaters sold in 2021 - 4:3:3 :: S:M:L
What do you have to model? Model the purchase of wool required and show an extract in the purchase ledger assuming in 2024, purchase returns was 10
Answer! Input depends on the output!
what is the output? Sweaters!
Input? Wool!
How many sweaters will depend on how much wool is required
ALT + H + A + C 2,021 2,022 2,023 2,024
Center alignment Small Medium Large Small Medium Large Small Medium Large Small Medium Large
Sales (No. of Sweaters!) 400 300 300 440 330 330 484 363 363 532 399 399
How much raw material is required?
Assume: 3kg for small 3 4 5 3 4 5 3 4 5 3 4 5
4 kgs for medium
5 kgs for large 1,200 1,200 1,500 1,320 1,320 1,650 1,452 1,452 1,815 1,597 1,597 1,997
Purchases 1,200 1,200 1,500 1,320 1,320 1,650 1,452 1,452 1,815 1,597 1,597 1,997
Amount post Purchase Return 1,200 1,200 1,500 1,320 1,320 1,650 1,452 1,452 1,815 1,775 1,775 2,218
Blue Box Explanation - further explanation!
Amount of wool needed for making the sweaters in 2024 5,191
Purchase Returns are 10%
Which means the amount you need is AFTER purchase returns!
90% of X = 5191
So the amount you need is 90% X 5,768
Total Purchases of Wool made by RA for 2024
90% 10%
Amount left after PR PR PR 577
Purchases 5,768
Date Purchased Item Tax Gate Pass No. Qty
Jan 1, 2021Wool 0% MH-4-01012021-102 3,900
Jan 1, 2022Wool 0% MH-4-01012021-102 4,290
Jan 1, 2023Wool 0% MH-4-01012021-102 4,719
Jan 1, 2024Wool 0% MH-4-01012021-102 ?????
THE END! ???? 5,768
Sales Ledgers! F2 - Edit a Cell!
Why is it important to project sales or model sales?
Revenue is a key part of any business!
Cash sales or credit sales - important that we know how much is being sold!
No successful business without successful sales!
There are two types of revenue growth!
1 Growth in Units Sold
2 Growth in Revenue/ unit!
Reliance Apparel (RA) is now going to project their sales for the year 2021!
1000 units of sweaters sold!
Only one color of sweaters in - in three sizes! S, M and L!
4:3:3 :: S:M:L
How do you know how much to sell/ how much to sell for in order to break even/ make a profit?
Breakeven/ profits are a function of costs! And Revenue!
Revenue is a function of Units and Revenue/ Unit (Sale price)
Revenue = Units * SP
If revenue has to increase, either Units have to increase, or SP must increase!
Scenario A RA could sell 1000 units at 100/ unit! 100,000
Scenario B RA could sell 1500 units at 70/ unit! 105,000
Scenario C RA could sell 2000 units at 35/ unit! 70,000
Why has the revenue dropped in Scenario C?
Curve of Maximum Revenue -
As Units Increase, this Curve will go up! You price / revenue goes up!
But after a point, this curve drops!
This inflection point - > the point where the graph changes direction, you should selling!
In L
Scenario A Maruti produces and sells 1000 Wagon Rs at 7 L/ car! 7,000
Scenario B Jaguar produces and sells 200 Jags at 30 L/ car! 6,000
Scenario C TATA produces and sells 10000 Nanos at 2 L/ car! 20,000
TESLA is the best example! They havent hit their inflection point yet! It means the more they se
Till they hit the inflection point!
Once they hit the inflection point, they need to reassess their production capabilities!
RA!
Model Parameter! Reliance Apparel needs our help to understand how much sales actually is required to
A Break Even!
B Make a 10% profit!
Estimated Sales per factory capacity (100%) 10,000 / month
Factory has to work at a minimum 60% capacity!
Labor rules! Per hour laborers make it clear they need 60% employment per month!
Fixed Costs! Factory Rent! 100,000 per month!
Variable costs! Labour! 500 per hour
Electricity 100 per hour
Maintenance includes raw materials 50 per unit
Labour utility rate 100 units per hour! (If labour works for an hour, they can make 100 units!)
Solution! What capacity means!
100% capacity for RA 30 days per month * 8 hours per month * No of laborers (2 laborer)
100% capacity 48,000 units if we worked 100 % capacity
Minimum we need to work 60% capacity
At 60% capacity 28,800
Minimum Scenario!
60% capacity 28,800 units
Costs
Factory Rent 100,000 per month
Labour (No. of L * per hour * Hours worked*Rate) 144,000 Labor (60% capacity)
Electricity (No. of Hours * Rate) 14,400 Electricity(60% capacity)
Maintenance includes raw material (No. of Units * Rate) 1,440,000 Maintenance and raw material
Total Cost 1,698,400 (Formula to Sum - '=' + sum or ALR + '+')
Cost per Unit 58.97 per unit!
Break Even! Zero Proft and Zero Loss! 58.97 per unit!
Profit at 10% 64.87 per unit!
Maximum Scenario!
100% capacity 48,000 units
Costs
Factory Rent 100,000 per month
Labour (No. of L * per hour * Hours worked*Rate) 240,000 Labor (100% capacity)
Electricity (No. of Hours * Rate) 24,000 Electricity(100% capacity)
Maintenance includes raw material (No. of Units * Rate) 2,400,000 Maintenance and raw material
Total Cost 2,764,000
Cost per Unit 57.58 per unit!
Break Even! Zero Proft and Zero Loss! 57.58 per unit!
Profit at 10% 63.34 per unit!
Fixed Costs will reduce as you produce more! Why? Because it is spread across more units!
100% Cap - Fixed Cost per Unit 2.08
60% Cap - Fixed Cost per Unit 3.47
Diff - due to increase in capacity! -1.39
Diff - in cost per unit! -1.39
Minimum Break Even! 58.97
Maximum Break Even 57.58
Units are not being determined here - only the selling price!
Why? We can only model the Selling Price! Units are arrived at based on -
1. Factory Capacity
2. Market conditions
3. Competition
4. Market Size!
So safe to assume, we will only model SP!
But there are some scenarios when we model Units too!
THE END!
Inventory!
It can be of different types - both perishable and non - perishable inventory!
Imagine a restaurant- Pizza Hut! Different types of cheese and breads stored!
What happens if you story 45 days worth of vegetables at any point in time?
It gets spoilt!
Storing too much inventory is actually bad, because of costs and spoilage!
Your bread and cheese could spoil + you will also be keeping your regrigerator on for a longer time for 45 days! More electricity! More contamination, more rats? Mo
More costs!
What happens if you story only 3 days worth of inventory?
Just In Time process etc
Imagine it takes 4 days for your bread delivert to come through once you order!
1 2 3 4 5 6 7
yes yes yes yes yes yes
Order
No pizza on the 4th day, therefore this is a cost!
Too high or too low is not good!
We need to maintain just the right amount of inventory!
RA!
Model Parameter Imagine RA needs 100kg of wool everyday for manufacturing!
Most wool is available from Punjab and HP, and taken 10 days to come to Mumbai! RA's factory is in Mumbai!
Once wool is purchased, the cost of storing 1kg of wool is 5 Rs/ day! Warehousing cost, security, etc.
100 kg of wool - can make 100 sweaters, each sweater is sold at 1000 Rs.
1 kg of wool - 1 sweater - 1000 Rs.
What do I need to find out?
Scenario A You keep inventory for 7 days! And you order every 7 days! So basically you order 7 days worth of inventory!
Scenario B You keep inventory for 15 days! And order after 5 days!
Scenario CYou keep inventory for 10 days! And order is placed on the first day!
Answer Scenario A Daily Consumption 100 Daily cost if no inventory 100,000
Daily Cost 500
Days Inventory Level Cost of Maintaining this Inventory Cost if no inventory Total Cost
1 700 350,000 -   350,000
F4 - will keep the cell constant 2 600 300,000 -   300,000
3 500 250,000 -   250,000
4 400 200,000 -   200,000
5 300 150,000 -   150,000
6 200 100,000 -   100,000
7 100 50,000 -   50,000
8 -   -   100,000 100,000
9 -   -   100,000 100,000
10 -   -   100,000 100,000
11 700 350,000 -   350,000
12 600 300,000 -   300,000
13 500 250,000 -   250,000
14 400 200,000 -   200,000
15 300 150,000 -   150,000
2,950,000
Scenario B Daily Consumption 100 Daily cost if no inventory
Daily Cost 500
Days Inventory Level Cost of Maintaining this Inventory Cost if no inventory Total Cost
1 1,500 750,000 -   750,000
2 1,400 700,000 -   700,000
3 1,300 650,000 -   650,000
4 1,200 600,000 -   600,000
5 1,100 550,000 -   550,000
6 1,000 500,000 -   500,000
7 900 450,000 -   450,000
8 800 400,000 400,000
9 700 350,000 350,000
10 600 300,000 300,000
11 500 250,000 -   250,000
12 400 200,000 -   200,000
13 300 150,000 -   150,000
14 200 100,000 -   100,000
15 100 50,000 -   50,000
6,000,000
Scenario CDaily Consumption 100 Daily cost if no inventory
Daily Cost 500
Days Inventory Level Cost of Maintaining this Inventory Cost if no inventory Total Cost
1 1,000 500,000 -   500,000
2 900 450,000 -   450,000
3 800 400,000 -   400,000
4 700 350,000 -   350,000
5 600 300,000 -   300,000
6 500 250,000 -   250,000
7 400 200,000 -   200,000
8 300 150,000 150,000
9 200 100,000 100,000
10 100 50,000 50,000
11 1,000 500,000 -   500,000
12 900 450,000 -   450,000
13 800 400,000 -   400,000
14 700 350,000 -   350,000
15 600 300,000 -   300,000
4,750,000
Remember - > Lower inventory cost because you don’t sell anything does not mean its good! 7 Day cycle is the cheapest! But just because it is 7 days and we don’t sell for 3 days -
there is a chance that you will lose market share!
Will you then be able to sell for the remaining days?
Because market share is gone!
Summary!
2 costs for inventory!
1 Costs of maintaining invenotry - warehousing, storage costs etc.
2 Costs of not maintaining inventory - opportunity costs, loss of market share etc.
You need to model both costs when you look at inventories! Do not forget!
THE END!
Fixed Assets!
What are fixed assets?
Two types of assets - inventory, and fixed assets!
Inventory is something you buy to sell! Purchase and sale of inventory happens in the same period!
Fixed Assets - are purchased not for sale but for use in order to get a better output!
For eg -
IT companies - computers, desks, tables, chairs, etc.
Manufacturing - machinery, plant, etc.
Software companies - software used for coding etc.
What is the issue with modelling for fixed assets? A fixed asset -eg. Air Conditioner - can be used for max 10 years!
what will you write off in order to bring the asset value to zero ?
Air Conditioner is purchased for 1L.
2021 - 1L 2031 - 0
Option A You will bring it to 0 in 2031 PL - meaning you will reduce the entire 1L in 2031.
Option B You will bring it to 0 in 2021 PL - meaning you will reduce the entire 1L in 2021.
Wildcard You will bring this to 0 evenly over a particular range of years - this range is determine by the life of the asset!
Wildcard option - is the right answer!
You cannot write off the fixed asset in a single year because its not fair!
Regulations have clearly said that fixed assets have to be written off across the life!
Fixed Assets
Date Asset Name Amount
2021 Computer 1L
2021 Depreciation for 2021 -10K 1L / 10 = 10K!
2021 Closing Balance 90K
Profit and Loss A/C
Date Particulars Amount
2021 Depreciation Cost on Assets 10K
If a fixed asset is depreciated to 0, does it mean you have to throw it off? NO!
You can continue using it! No problem! Just that the extra years you use it, there will not be any depreciation charged. Why?
Because the FA is already at 0!
Is depreciation causing any cash flow movement?
Meaning - will you pay 10K to someone every month/ year?
NO! Depreciation is a notional cost!
Summary
Initial Cost > Inventory!
Never written off in the same year, written off over a lot of years!
The write off is called depreciation, and is notional!
Profit and Loss A/C
Wool Purchased 390,000 Sweaters Sold! 2,764,000
Profit 2,374,000
2,764,000 2,764,000
Balance Sheet
Fixed Asset xxx
Reserves and Surplus 2,374,000 Inventory xxx
THE END
Capital
Balance Sheet Amount Bold - CTRL + B
Capital and Liabilities
Capital - Authorized Share Capital xxx
Capital - Issued Share Capital xxx
Capital - Allotted Share Capital xxx
Capital - Called up/ Paid up Share Capita xxx
Preference Share Capital xxx
Authorized Share Capital!
This has no impact on your financial analysis!
Why? It is only for disclosure purposes!
Maximum amount of capital the company is allowed to issue!
If auth share capital is 1L, company is issuing 1.5L, something is wrong!
Issued capital - how much the company actually issues <= Authorized share capital!
it can never ever be more!
Allotted share capital! It is the actual amount allotted as capital to investors!
Allotted <= issued share capital!
Called up and paid up - amount called up and paid up
called up and paid up <= allotted share capital
Auth Cap >= Issued Cap >= Alloted Cap >= Called up and paid up Cap
Control Check! Formula to make sure there are no fat finger errors!
fat finger error - is when you type random numbers because you are not on a diet = fat
Balance Sheet Amount Control Check - only for chec
Capital and Liabilities
Capital - Authorized Share Capital 100 TRUE
Capital - Issued Share Capital 100 TRUE
Capital - Allotted Share Capital 100 TRUE
Capital - Called up/ Paid up Share Capita 100
Model Parameter RA has total authorized share capital of 10 L.
RA wants to issue 8.5L of capital, but gets applications for 1.5x times the capital issued!
RA allots 100% of the issued capital, and calls up the entire amount immediately.
All of this happens in 2021.
In 2022, RA wants to issue a further 1.5L of capital, and get 2.5x the applications for this amount.
RA allots the entire 100% of issued capital.
In 2023, RA wants to call back 10% of its total issued capital at 100% the FV. Do not worry about how/ w
What do you need to do?
Prepare the 2021, 2022 and 2023 capital parts of the BS with adequate control checks!
Make sure - these checks are tested out!
Answers
2021 ALT + H + A + C - Center aligned
Balance Sheet Amount Notes
Capital and Liabilities
Capital - Authorized Share Capital 1,000,000
Capital - Issued Share Capital 850,000
Capital - Allotted Share Capital 850,000 1.5x the application received - 8.5L*1.5 9.35 -0.85 has to be refunded to the ap
Capital - Called up/ Paid up Share Capita 850,000
Checks
TRUE
TRUE
TRUE
2022
Balance Sheet Amount Notes
Capital and Liabilities
Capital - Authorized Share Capital 1,000,000
Capital - Issued Share Capital 1,000,000 2021 - 8.5 + 2022 - 1.5 = 10L
Capital - Allotted Share Capital 1,000,000 2021 - 8.5 + 2022 - 1.5 = 10L
Capital - Called up/ Paid up Share Capita 1,000,000 2021 - 8.5 + 2022 - 1.5 = 10L
Checks
TRUE
TRUE
TRUE
2023
Balance Sheet Amount Notes
Capital and Liabilities
Capital - Authorized Share Capital 1,000,000
Capital - Issued Share Capital 900,000 10L issued - 10% of 10L called back = 9L
Capital - Allotted Share Capital 900,000 10L issued - 10% of 10L called back = 9L
Capital - Called up/ Paid up Share Capita 900,000 10L issued - 10% of 10L called back = 9L
Checks
TRUE
TRUE
TRUE
THE END
Cash
Cash is an asset for any company! How much cash is held depends on the kind of company!
Let us look at some examples - if you are modelling restaurants - cash will generally be high/ low dependant on the type of restaurant!
Chaat shop - cash is high!
Marriott ka restaurant - cash is low!
Just because cash is low, does not mean the restaurant is bad!
Just because cash is high, does not mean the restaurant is super profitable!
Profits and cash are two sides of the same coin!
When I say cash - I am talking about notes, coins etc.
Cash equivalents - cheques, debit cards, credit cards etc.
Can we think of an industry that is low on cash? That is, no cash more credit?
automobile industry!
manufacturers!
A lot of manufacturers, produce cars/ manufacture cars - give it to the retailers and are paid only after the retailers sell the cars!
Maruti -> Maruti Udyog !
Maruti also has suppliers - seats, seat covers, brake shoes, steel etc. who will be supplying on credit.
Balance Sheet Amounts
Capital and Liabilities xx
Assets
Fixed Assets xx
Current Assets xx
Cash and Cash Equivalents xx
Cash - Notes, Coins etc.
Cash Equivalents - Sodexho, Cards etc.
Tree Based Reg requirements
T Based 12th grade CBSE balance sheet
Model Parameters
Model A - TESLA!
Order: $1M This is for all TESLA cars put together in $$$ value!
Production 10% $100K!
Revenue 100$ of Production $100K!
Credit/ Cash Mix! 50:50 $50K Realized!
Balance Sheet
Assets
Cash and Cash Equivalents 50,000
Model B - Pizza Hut!
Order: $100k
Production $100K Evertyhign that is ordered for in the restaurant is produced and sold! Nobody
3 months!
Revenue: $100K You get paid for everything you sell - no credit payments at pizza hut! Is a cre
NO!
When you use a credit card - you get paid immediately by the bank!
Which means, the moment you use a card it is a credit for the customer and c
Credit: Cash Mix: 0:100 You realize the entire amount that you sold the pizzas for!
Balance Sheet
Assets
Cash and Cash Equivalents 100,000
Question! If you are an investor!
Which company will you invest in?
Will the answer be TESLA or Pizza Hut?
Pros and Cons! Pros Cons
TESLA - Order Book Higher Order Book Not a con
TESLA - Production No pro They are not able to produce
PH - great cash flow! Great cash flow Not a con
Potential? Not great!
Summary!
What is the linkage to cash?
Modelling cash is important - no doubts about it!
Cash flow is super important!
Any gov company in India - cash flow is the prob - great profits sometimes but not great cashflow!
BUT! Look at more than just the cashflow! Look at the bigger picture! Do not think cash flow is everything!
THE END!
Sundry Creditors
If you make a purchase, and you don’t give cash - you have to record the fact that you didn’t pay for the purchase!
That 'owing of money' is called having a sundry creditor!
This is usually a term used to define trade creditors!
So who are sundry creditors for most companies?
Restaurant bread purchase supplier, wheat supplier, rice supplier etc!
IT Companies Computer sales supplier, software supplier etc.
Manufacturing Companies Cloth supplier, wool supplier, thread supplier etc.
Service Sector - Uber? Driver - Uber, Uber - banks, car suppliers etc.
Real Estate/ Construction! Consturction material supplier like cement, sand etc, labour supplier etc.
In your balance sheet, where will the sundry creditor sit?
Balance Sheet!
Liabilities and Capital
Capital
Equity Capital
Prefererence Capital
Liabilities
Long Term Liabilities
Short Term Liabilites
Sundry Creditors
Greater than 6 months
Less than 6 months
Assets
Indenting!
When you draw up a BS in a financial model, make sure you left/ right indent accurately.
Why is that important?
If you don’t indent, what happens is that your liabilities, assets and in our example, >< 6 months will al
Is that correct?
NO!
Your greater than/ less than 6 months, is technically not a part of the BS, but a part of the Sundry Cre
is a part of liabilities, which is a part of Capital and Liabilitie, which is a part of the BS !
Your model for sundry creditors depend a lot on your expenses!
If expenses are high, sundry creditors COULD also be high!
If expenses are low, sundry creditors COULD also be low!
If no expenses, NO SUNDRY CREDITORS!
Why am I saying COULD? why is it not SHOULD?
Scenario 1 - you own a chaat shop in the main road! Expenses - electricity, pani puri, sev, papdi, curd, etc Road side! YOU WIL
Scenario 2 - you own Haldirams. Bikanerwala! Expenses - electricity, pani puri, sev, papdi, curd. Shop in a mall! BIG BRAN
To model creditors, you need to know two thing!
Thing 1 You need to know how much expense was incurred for the creditor that you are modelling!
Thing 2 You need to know the proportion of expense that is actually payable after paying in cash!
Model!
Sundry Creditors for 2021 = Linked to Expenses Multipled by Proportion!
Model Parameter Reliance Apparel purchases 100 kgs of wool on a yearly bases for making their sweaters. This wool is purchased at 100/ kg and you get a discount
Model RA's creditors assuming they purchase bare minimum amount to avail the discount! Assume 2022 and 2023 purchases will increase by 10%
Out of total Sundry Creditors - 50% payable in 6 months, and the rest before a year.
Multi-period model - keep periods in columns, and everythign else in rows!
2021 2022 2023
Expenses 10,000 11,000 12,100
Proportion Amount payable after discount and advances
Advance 1,000 1,100 1,210
Amount Payable after Advance 9,000 9,900 10,890
Discount 900 990 1,089
Amount Payable after Advance and Disco 8,100 8,910 9,801
Sundry Creditors 8,100 8,910 9,801
2021 2022 2023
Liabilities
Long Term Liabilities
Short Term Liabilites
Sundry Creditors 8,100
ALT + H + H + N Greater than 6 months 4050 4455 4900.5
Gets rid of colors Less than 6 months 4050 4455 4900.5
THE END!
Sundry Debtors
Who are sundry debtors? And why are they recognized on our B/S?
High SD - good or bad?
People who owe money to you! Why? Because you provided them some sales or service!
Why ar ethey recognized?
Because anybody who is analysing a company - would have only taken a look at the P/L.
When you make a sale/ service - you recognize it in the P/L - but how much was it actually received?
Reliance Apparel sold 1 Cr worth of sweaters to Kingfisher Airlines!
RA - recognized a P/L of 1 cr for this sale!
But…. Whom did they sell to?
To Kingfisher! What does that mean? Did they receive cash or not? NO!
Why?
Because Mr Mallya! He doesn’t pay!
Your P/L looks as good as gold! But is worht nothing - because you wont receive any money for it!
Very important - debtors are being analysed!
Creditors - purchase/ expenses!
Debtors - revenues/ sales!
Industries!
L/T Power Transmission! Governemnt - power bodies!
IOCL! petrol bunks!
Restaurant - have no S/D Why? Because there is no credit transaction!
Reliance Apparel retailers - who will buy from RA, and sell to the ultimate consumer!
How are credit terms usually arrived at for sundry debtors?
2/24 2% discount, if you repay within 24 days/ months
5/12 5% discount if you repay within 12 months!
Balance Sheets!
Capital and Liabilities
Capital
Liabilities
Assets
Fixed and Long Term Assets
Current and Short Term Assets
Cash
Sundry Debtors
Less than 3 months NEVER forget to Indent!
Greater than 3 months
Sundry Debtors -> Revenues and Sales!
Model Parameters Reliance Apparel - they have sales targets of 1,500 units sold per day! They expect this target to go up by 10% in the second half of the
Expected value of sales is 500/ sale!
They also expect to realize 10% as advance, 10% in three months and the rest in 6 months. In case this is not paid within 6 months, a pe
is due!
Calculate using financial modelling - how you can forecast the year end Sale Value, Cash Realized and Sundry Debtors!
Answers Particulars 2021 - First Half2021 - Second Half
Sales per day 1,500 1,650
Days in 6 months 180 180
Sales for 6 months (in units) 270,000 297,000
Sales Value per Unit 500 500
Total Sale Value 135,000,000 148,500,000
End of Year Sale Value 283,500,000 Volume Driven Business - better sales because of more units sold, not because of high
Cash Realized Calculation
Advance Realized 10%
Amount Realized as Advance 28,350,000
Three months Installment! For all periods except sales made from Oct 1
We are preparing FS for Jan - Dec - so any sale made 3 months before Dec will be realized (10%), but if made after Oct 1, high chance t
3 Months Installment 20,925,000 (First 6M Sales Value x 10%Rec'd) + (Second 6M Sales Value x 10%x 50%
)
Six Months Installment! For all periods except sales made after July 1
We are preparing FS for Jan - Dec - so any sale made 6 months before Dec will be realized (80%), but if made after July 1, high chance
6 Months Installment 108,000,000 (First 6 M x 80%
) + (Second 6M * 0%
)
Cash 157,275,000
Debtors First 6 months - no debtors! Why? Completely rec'd as cash!
Second 6 month - debtors
First 3 months - debtors - 80% - 10% adv + 10 FI paid
Second 6 months - debtors - 90% - 10% adv paid
Sundry Debtors 126,225,000
Sales Value 283,500,000
Cash 157,275,000
Debtors 126,225,000
Diff - bad debts -0 Control Check
THE END
Trial Balance
Any financial model - Mix of Accounting + Excel!
1 What is a trial balance?
2 What constitutes a trail balance? Basically, what forms a part of it?
3 What are debit balances and credit balances?
4 How do you link items in a trial balance?
5 Models on Reliance Apparel's Trial Balance
What is a trial balance?
Basically, it is a list of all ledgers in a single place!
Ledgers - ledger balances!
Why do we need to put all ledger balances in a single place?
It will tell you if all your debits and credits - two sides of any entry! Are accurate!
If you miss any one side, or if the entry is posted to a wrong account, it will throw an error!
Closing balance of all ledgers - will be in the TB!
Where will the opening balance be?
In the ledger!
What constitutes a trial balance?
There will be a particulars column! This column will have all the ledger names!
There will be a Debit Amount column - all debit balances will be on this column against the ledger name
There will be a Credit amount column - all credit balances will be on this column against the ledger nam
There will be totals for both the debit and credit column!
Your debit total must be equal to your credit total!
My favourite? Checks! This is only if you are doing it on an excel!
Checks Formula
Check 1 - Debit total should be equal to credit total! IF Formula
Check 2 - a single ledger can have only a debit balance or a credit balanc IF formula
Check 3 - ensure ledger balance is carried forward accurately to TB IF formula
Trial Balance Amount
Ledgers Amount Purchase/ Sales Ledger
Purchase/ Sales Ledgerxxx Creditors/ Debtors Ledger
Creditors/ Debtors Ledgxxx Fixed Assets
Fixed Assets xxx Cash
Cash xxx Liabilities
Liabilities xxx
To record all initial transactions! To ensure transactions are r
Explosion Databse or Explosion Workflow!
Option 1 I will updated all ledgers on a daily basis, as and when transactions happen, and then update to TB at e
Option 2 I will update all ledgers on a daily basis, as and when transaction happen, and simultaneously the TB w
ledger is updated
Option 2 is the answer, it is called an explosion workflow!
All of your databases are updated simultaneously!
THE END
Trial Balance
What are debit and credit balances?
Every ledger has soemthing called a debit or a credit balance!
RULE OF LAW!
Whenever a ledger has more debit items than credit items, it is called a debit balance. Assets - Debit Revenues - Credit
Whenever a ledger has more credit items than debit items, it is called a credit balance! Liab - Credit Expenses - Debit
Ledger D/C
Purchase Ledger D
Sales Ledger C
Capital ledger C
Cash Books D
Inventory D
Fixed Asset D
Sundry Debtors D
Sundry Creditors C
Loans C
Security Premium C
Salary A/C D
Expense A/c D
Purchase Return C
Sales Returns D
Depreciation D In B/S, it is a reduction from Assets, therefore has the same sign as Assets have - D
In P/L they are expenses, therefore D.
Trial Balance
Ledger Debits Credits Transactions - Model Parameters
Purchase Ledger 50,000 1 Mukesh Ambani has started a new company called Relian
Sales Ledger 50,000 2 Assume Mr Ambani wants to invest another 1L next month
Capital ledger -   200,000 3 With the money in cash, Reliance Apparel wants to purcha
Cash Books 200,000 -   4 They sold the wool for the same 50,000 to someone else.
Inventory -  
Fixed Asset
Sundry Debtors
Sundry Creditors
Loans
Security Premium
Salary A/C
Expense A/c
Purchase Return
Sales Returns Control Check
Total 250,000 250,000 -   GOOD BOY
Ledger
Capital Ledger
Debit Credit
Particulars Amount Particular Amount
Capital Invested 100,000
Second Investment 100,000
Control Check
Total -   Total 200,000 200,000 GOOD BOY
Cash Ledger
Debit Credit
Particulars Amount Particular Amount
Capital Invested 100,000
Purchase of Wool - Cash
Paid 50,000
Second Investment 100,000
Sale of Wool 50,000 Control Check
Total 250,000 Total 50,000 200,000 GOOD BOY
Purchase Ledger
Debit Credit
Particulars Amount Particular Amount
Wool Purchased 50,000
Control Check
Total 50,000 Total -   50,000 GOOD BOY
Inventory Ledger
Debit Credit
Particulars Amount Particular Amount
Wool Purchased 50,000 Sale of Wool 50,000
Control Check
Total 50,000 Total 50,000 -   GOOD BOY
HOLD ON TO THE TRADING P/L CALC I AM DOING HERE, JUST IMAGINE YOU UNDERSTAND, YOU WILL GET IT WHEN I DO TRADING P/L IN THE NEXT CH
Sales Ledger
Debit Credit
Particulars Amount Particular Amount
Sale of Wool 50,000
Control Check
Total -   Total 50,000 50,000 GOOD BOY
THE END
Trading A/c
1 What is a trading A/c?
2 What forms a part of your trading account?
3 What is gross margin?
4 Sample of a trading account.
5 Trading account under the explosion infrastructure!
What is a trading A/c?
A trading to is to quantify our profits at a trade level.
Which means it will only look at revenues from trade, and expenses incurred with respect to a trade!
The net amount from a trading account is either called a gross profit or a gross loss!
If your revenues > expenses -> gross profit
If your revenues < expenses -> gross loss.
What happens to this gross profit or gross loss?
It gets carried forward to the P/L A/c
Trading A/C is not mandatory! This information, if required can be incorporated in a Profit and Loss A/c.
What forms a part of your trading P/L!
Only expenses related to a trade can form a part of your trading A/C
Trading A/c or P/L A/c
Sales of goods Trading A/C Direct linkages
Cost of goods sold Trading A/C Direct linkages
salaries to admin staff Profit and LosNo direct linkage to sales made.
salaries to plumber Trading A/c o If the plumber is directly involved in the production process - Trading A/c, if he is like a head office plumber - P
salaries to factory workers Trading A/C Direct linkages
electricity to factory office Trading A/C Direct linkages
electricity to head office Profit and LosNo direct linkage to sales made.
rent for factory Trading A/C Direct linkages
rent for head office Profit and LosNo direct linkage to sales made.
Petrol/ Diesel for factory Trading A/C Direct linkages
Machinery rental Trading A/C Direct linkages
Furniture rental Profit and LosNo direct linkage to sales made.
What is a gross margin?
GM/ GP - is nothing but the profit you make on sales, without considering your extra overheads.
If a company has great GP - it means their core business is viable!
It means you are doing really well - your business is profitable, and you should continue doing this business!
If GP is bad - it means there is something wrong with yoru business model!
Amazon! Can never have a negative GP! Why? They buy from wholesalers and sell to retailers, but don’t owe anything to the wholesalers until they make
Cloudtail!
Whenever you analyse - always look at GP to ensure business is good/ viable!
Therefore - your trading A/c is an improtant area for you to analsye!
Sample of a trading account.
Debit Credit M&C ALT + H + M + C
Particulars Amount Particulars Amount
All Cost of Goods Sold xxx
All Revenue Items - Sales/
Service xxx
Electricty xxx
Rent xxx
Total -   Total -  
if Debit side is heavier - more expenses than revenue - Gross Loss!
If Credit side is heavier - more incomes than expenses - Gross Profit!
Trading A/c under the explosiion infrastructure!
Whenever there is a trade doen, either purchase or sell - you need to update the Ledger, TB as well as the Trading Accoutn immediately!
Put necessary checks in place! Also make sure this is formula driven!
You should only touch the ledger!
All other accounts should pick up numbers from there and flow it through with formulas!
THE END
Profit and Loss A/c
1 What is a P/L?
2 What gets captured within the P/L A/C
3 What is Net Proft/ Net Loss.
4 What does High NP, but Low GP or Low NP and High GP mean? Analysis!
5 Modelling P/L - how to incorporate the entire explosion infrastructure within the P/L workflows!
What is P/L?
P/L is nothing but a total of all revenues earned by the firm, minus all expenses incurred by the firm.
This is an expansion of the Trading A/C - under Trading we only saw trade related revenues and expenses - under P/L we will see all revenues and
The first starting point in a P/L is the ending point of a Trading A/C
All trade related revenues and expenses - trading account
You will get the gross profit or gross loss
Start making your profit and loss account with the starting point as gross profit or gross loss!
Add all your non trading expenses and revenues
Net profit or Net Loss
Rule! All revenues items/ expense items will only be added once - either in the trading account or in the P/L account
Never add it in both
Rule! Not necessary that you need to prepare a separate trading account and a profit and loss account
You can combine both …..but! You will not show GP in that case - you will only see NP!
What gets captured within the P/L A/C
Anything that is not factory related - P/L
Anythign that is not production related - P/L
Depreciation - P/L
Anything that is financing related - P/L
What is Net Proft/ Net Loss.
Net profit = All revenues minus all expenses.
If revenues > expenses - net profit!
If revenues < expenses - net loss!
Revenues will include brought forward Gross Profit!
Expenses will include brought forward Gross Loss!
What does High NP, but Low GP or Low NP and High GP mean? Analysis!
NP GP What does it mean?
1 High High It means the company is doing really well! Trade/ business model is good, and related expesnes are low
2 High Low Low GP means business model is questionable, but high NP means you are making revenues from othe
3 Low High High GP means business model is great. But low NP, means your ancillary expenses are eating into your
4 Low Low it means your business model is bad, needs improvement - and your net profits are also suffering becau
Modelling P/L - how to incorporate the entire explosion infrastructure within the P/L workflows!
Debit Credit
Particulars Amount Particulars Amount
Gross Loss B/D xxx Gross Profit B/D
All Non-Revenue related
expenses xxx
All Non-Revenue Items - Sale
of Furniture, Sale of
Machinery, etc. xxx
Dep on Furniture xxx Rent Received xxx
Rent on offices xxx
Salary Paid xxx
Total -   Total -  
Example!
Trading A/C
Debit Credit
Particulars Amount Particulars Amount
Sales 15.00
Gross Profit 5.00
Expense 1 10.00 Gross Loss -5.00
Gross Profit 5.00 Gross Loss -   Control Check
Total 15.00 Total 15.00 GOOD BOY
Profit and Loss A/C
Debit Credit
Particulars Amount Particulars Amount
Gross Loss -   Gross Profit 5.00
Gross Profit 5.00
Gross Loss -5.00
Net Profit 5.00 Net Loss -   Control Check
Total 5.00 Total 5.00 GOOD BOY
THE END
Balance Sheet
1 What are Balance Sheets? What are the two different aspects?
2 What accounts come under which aspect of the Balance Sheet?
3 Indentation, Alignment and Formatting!
4 Explosion Infrastructure for Balance Sheets!
5 Modelling Balance Sheets for the future - forward looking Balance Sheets!
What are Balance Sheets? What are the two different aspects?
Balance Sheets are period to date information, where the period starting is when the company went live!
Company was launched in 1998 - B/S date is 2021….. Your sundry debtor balance is the balance as of 2021, but considered from 1998!
In the P/L. when your year ended, all the numbers were reset to 0. You CANNOT DO THAT with a BS.
Balance Sheet numbers are carried forward to the next period, and the period after, so on and so forth.
If your Sundry Debtors as of Dec 31, 2020 10L which means as of Dec 31, you have to receive 10 L from
If your Sundry Debtors as of Dec 31, 2021 0 What does it mean?
It means
1 All 10L was paid up, tand no further de
2 Or no paid up, all debtors became bad
Balance Sheets -
T type Balance Sheet
Liabilites Assets
Particulars Amount Particulars Amount
Total -   Total -  
Horizontal Balance Sheet
Assets
xxx
xxx
xxx
xxx
xxx
xxx
xxx
Liabilities
x
x
x
But what are the aspects?
Capital and Liabilities are bunched together. Why? These are amounts owed by the company to external people - creditors, p
Assets are bunched together - these are amounts owned by the company or owed to the company by external ppl - Fixed Ass
What accounts come under which aspect of the Balance Sheet?
0 I Liabilities and Capital
1I Capital
2I Equity Capital
3I Authorized Capital
3I Subscribed Capital
2I Preference Capital
1I Liabilities
2I Long Term Liabilities
3I Loans and Borrowings
3I Sundry Creditors
2I Short Term Liabilities
3I Sundry Creditors
3I Handloans
Total xxx
0I Assets
1I Fixed and Long Term Assets
2I Fixed Assets
2I Investments
1I Current and Short Term Assets
2I Cash
2I Sundry Debtors
Control Check
Total xxx GOOD BOY
Indentation, Alignment and Formatting!
Indentation It is how you put values inside a cell! if I say indent it, it means you need to make sure all cell wise data is
Alignment It is how difference cells put together are set up! If I say align it, you need to make sure all cells are accurate!
Formatting Is putting bold, underline, etc.
Shortcut keys
Indenting ALT + H + 6 For a single indent - repeat if you want multiple indenting to the right. For left, use 5 instead of 6
Alignment Copy + paste is your best option - CTRL + C, or CTRL + V. But if you want to try something fancy, go ahead. But recheck form
Center, left, Right Align ALT + H + AC/AR/AL For Center, AC, For Left, AL and for Right, AR.
Formatting
Color Fill ALT + H + H + Color Color - whichever color you want, no color, type N
Underline CTRL + U
Bold CTRL + B
Font ALT + H + FF Type font name that you want!
THE END
Explosion Infrastructure for Balance Sheets!
Trying to make sure one entry to a ledger - updates the Trial balance, Profit and Loss Account and the Balance Sheet simultaneously.
Model Parameters Welcome back to modelling Reliance Apparel!
We are now going to look at different transactions in Reliance Apparel and see how this is carried forward and recorded in different financial statements - or in your books
of accounts!
Let us assume from the beginning that Reliance Apparel is actually just going to be launched by Mr Ambani!
1 Capital Introduction - Mr Ambani invested 1L in Capital in Reliance Apparel.
2 Loan Taken - 5L from Bank
3 Raw Materials Purchased from Suppliers for Cash - 1L
Capital Account
Debit Credit
Particulars Amount Particulars Amount
Invested Capital 100,000
Total Control Check
Total -   Total 100,000 100,000 Awesome!
Cash Account
Debit Credit
Particulars Amount Particulars Amount
Capital Invested 100,000 Raw Material Paid 100,000
Loan Received 500,000
Control Check
Total Awesome!
Total 600,000 Total 100,000 500,000
Trial Balance
Ledger Account Debit Credit
Capital 100,000
Cash 500,000
Loan 500,000
Purchases 100,000
Total Control Check
Total 600,000 600,000 -   Awesome!
Trading and P/L Account
Debit Credit
Particulars Amount Particulars Amount
Purchase of RM 100,000 Gross Profit -100,000.00
Gross Loss 100,000.00
Gross Profit -   Gross Loss 100,000 Total Control Check
Total 100,000 Total 100,000 -   Awesome!
Balance Sheet
Liabilities and Capital Assets
Particulars Amount Particulars Amount
Capital Fixed Assets
Equity Capital 100,000
Reserves and Surplus -100,000
Liabilities
Long Term Liabilities Current Assets
Loan from Banks 500,000 Cash 500,000
-   Total Control Check
Total 500,000 Total 500,000 -   Awesome!
Loan Account
Debit Credit
Particulars Amount Particulars Amount
Loan Taken from Bank 500,000
Total Control Check
Total -   Total 500,000 500,000 Awesome!
Purchases Account
Debit Credit
Particulars Amount Particulars Amount
Raw Materials Purchased 100,000
Control Check
Total Awesome!
Total 100,000 Total -   100,000
THE END
Future Looking Statements - Sales, Purchase, Inventory and Fixed Assets!
What we have done till now - is show how a present recording of financial transactions can be modelled on an excel!
If we make 1 transaction, we have seen the effects of that transaction in our ledgers, P/L, Cash flows and in the Balance Sheet!
Our explosion infrastructure will be able to capture all of these transactions - as long as they are in the present and as long as the model is set up ac
But….
what about future transactions, what if you are asked to make predictive models?
What are predictive models?
A predictive model will tell you what the present is, and you will have to make assumptions about the future and incorporate the same in your model!
It majorly uses data and statistics!
Reasonable assumptions will have to be backed up by industry standards, as well as data analytics.
Let us take 4 basic items first and see how to make forward looking models for these items!
1 Sales
2 Purchase
3 Inventory
4 Fixed Assets
Sales - we know what sales is dependent on! Units sold x Value per unit!
Units X Sale Value/ Unit
sales numbers will go up - if units sold increase, and SVPU (Sales VALUE PER UNIT) remains constant.
sales numbers will go down - if units sold decrease, and SVPU is constant
sales value will go up - if units sold are constant, but SVPU increases
sales value will go down - if units sold are constant, but SVPU decreases
Why will units sold increase?
1 increase in demand from customers - eg. JIO
2 better product - eg. Iphones
3 cyclical reasons - eg. More mangoes in the summer, more Acs in the summer, etc.
Why will units sold decrease?
1 decrease in demand from customers - eg. IDEA/ Vodafone
2 bad product - eg. Motorola
3 cyclical reasons - eg. less mangoes in the winter, less Acs in the winter, etc.
SVPU - increase/ decrease
1 more competition - when a new restaurant opens up in the market, your prices are usually cheaper.
2 cost of RM - economies of scale.
Model Parameter We are RA! We have just started the business in 2021 - the plan is to expand to more regions in 2022, but we are not sure if we can increa
In 2024, we will bounce back but not entirely, and 2025 levels will be back to 2021 levels. You are free to make assumption to make sure yo
Formulas for Units 1 1.1 0.9 0.95 1
Formulas for SVPU 1 1 1 1 1
Year 2021 2022 2023 2024 2025
Assumption None - Given
Units will
change - 10%
Units will
change - 10%
Units will
change - 5% Back to 2021 levels
Sales Units 1,000 1,100 900 950 1,000
SVPU 150 150 150 150 150
Total Sales 150,000 165,000 135,000 142,500 150,000
750
1,000
1,250 Sales
Units
SVPU
Purchases - will be driven the same things that drive sale!
Competition
Market conditions
Cycles
Raw Material costs for the suppliers, etc.
DIY! Try to model purchases for RA using the same assumptions we used and having a 10% profit margin for the supplier!
THE END
-
250
500
Cash Flow Statements
1 What is a cash flow statement?
2 what are included within a cash flow statement?
3 Two types of preparing cash flow statements.
4 Explosion Infrastructure will function with respect to a cash flow statement.
5 Predictive Modelling on Cash Flows - how forward looking cash flow statements can and should be prepared.
What is a cash flow statement?
A cash flow statement is a key part of your financial statements, along with PNL and Balance Sheet!
This will only track cash moves in and out of the company!
Which means - if there are non-cash moves in a company, this will not be tracked by a cash flow statement.
We need to make sure we model cash flow statements for only cash moves, this will help readers of the financial statement to decipher how much of the activity has been cash-impacting
and how much is non-cash.
Anyone analysizing financial statements will want to know how much of the sales/ business you made were in cash/ realized cash?
Therefore, everyone will take a look at cash flow statements.
What all is included within a cash flow statement?
We include all cash related items. Non cash related items are excluded!
All items that realized cash, irrespective of whether this was financing, investing or operating will be included.
Operating - general business!
Financing - to get money for running the business - loans, issung debentures etc.
Investing - to make more money with the money we make.
Two types of preparing cash flow statements.
Direct Method -
Indirect Method -
The net result of both methods is to say that Opening Cash balance + Activities during the year - Closing Cash balance = 0.
Direct
Operating Activity +/- Only cash related operating activites are included. So any cash purchase, cash sale, cash paid, cash recd,
Investing Activity +/- Only cash invested, and cash de-invested.
Financing Activity +/- Only cash rec'd as loan, or cash debt raised or cash repayments will be included.
Opening Cash +
Closing Cash -  
1 Purchase made for 100 Rs, out of which 70Rs paid in Cash - Only 70 Rs paid in cash will be included in the direct cash flow statement.
2 Sales made for 150 Rs, out of which 120 Rs paid in cash - only the 120 rs that you paid in cash will be incldued within your direct cash flow statem
3 Rec'b for good sold, paid us 100 Rs - you will include the entire 100 Rs.
4 Payable for purcases - we paid 50 Rs - you will include the entire 50 Rs.
Beginning Debtors 100
Ending Debtors 20
How much wil you include in cash? 80 assumed to have been realized in cash
Investing activity -
1 We rec'd a stock dividend of 500 shares - wll you include or not? NO! This is not cash related, so should not be included!
2 We rec'd a cash dividend of 10K rs. - YES, since this is cash related!
3 We invested 15K in cash. - Yes, to be included since this was investment in cash!
4 We invested in an options contract for 1 L, by paying a premium of 1000 Rs. - Your actual cash outflow/ inflow is only 1K. Not 1L, therefore include
5 We redeemed out of an ETF investment for 1 L. - just a simple 1L included, since you will receive cash when you redeem out!
Financing -
1 All interest payments.
2 All loans taken (as long as this is in cash)
3 All loans repaid.
4 Further issue of equity - include or not? YES! Because you are receiving cash against this issue of equity.
Indirect Method
Operating Activity
Net proft
Minus all non cash activities in net profit
Total Operating activity
Investing Activity +/-
Financing Activity +/-
Opening Cash +
Closing Cash -  
What will you minus as non-cash?
Depreciation, any moves in debtors/ creditors, etc.
Model for Indirect Method! Because this is the most frequently used, and is also easier because all your items are included already, you only need to back out!
Particulars Amount Amount Commentary
Operating Activity
Net Income xxx
Add: Non Cash Items
Depreciation xxx No cash, added back
Increase in accounts rec'b xxx This signifies an increase in debtors - so no cash was rec'd
Decrease in payables xxx This signifies a decrease in creditors - so no cash was paid
Total Operating Activity xxx Sum of NP + Add backs
Financing Activity
Financing Inflows xxx
Financing Outflows xxx
Total Financing Activity xxx
Investing Activity
Investing Inflows xxx
Investing Outflows xxx
Total Investing Activity xxx
Total Cash from Activities xxx Inv + Fin + Op
Total Cash Beginning xxx From Opening BS
Total Cash Ending xxx From Closing BS
Control Check xxx
THE END
Inventory - different models of inventory!
1 HIFO - Highest in First Out
2 LIFO - Last In First Out
3 FIFO - First In First Out
For a storekeeper model, how will you decide which inventory has to go out if one of the above is followed?
HIFO - Highest In First Out - the costliest inventory should first be used for sales purposes.
If you have 10 different items in your warehouse, and all 10 items are different costs of procurement. HIFO will tell
Why?
Profits are reduced, therefore tax is reduced.
Inventory Ledger
Date Inventory Detail Units (KG)CostAmount Units (KG)
10-Jan-20 Wool 100 150 15,000 100
11-Feb-20 Wool 100 250 25,000 100
17-Mar-20 Wool 100 650 65,000 100
21-Feb-21Wool 100 700 70,000 100
24-Feb-21Wool 100 550 55,000 100
30-Mar-21 Wool 100 480 48,000 100
600 278,000 600
Under HIFO
You are asked to sell 120 KGS for 600 Rs/ KG
Units Cost
100 700 70,000 600 60,000
20 650 13,000 600 12,000
120 83,000 72,000
Net Profit - Loss of 12K.
Under LIFO
You will sell whatever came in last, first! Why? So when petrol is pumped into an underground tank, the petrol you
pumped petrol.
Date Inventory Detail Units (KG)CostAmount Units (KG)
10-Jan-20 Wool 100 150 15,000 100
11-Feb-20 Wool 100 250 25,000 100
17-Mar-20 Wool 100 650 65,000 100
21-Feb-21Wool 100 700 70,000 100
24-Feb-21Wool 100 550 55,000 100
30-Mar-21 Wool 100 480 48,000 100
600 278,000 600
30-Mar-21 100 480 48,000 600 60,000
24-Feb-21 20 550 11,000 600 12,000
59,000 72,000
Profit 13,000
Under FIFO
We sell the first procured products first! Example - bakeries, food products!
Date Inventory Detail Units (KG)CostAmount Units (KG)
10-Jan-20 Wool 100 150 15,000 100
11-Feb-20 Wool 100 250 25,000 100
17-Mar-20 Wool 100 650 65,000 100
21-Feb-21Wool 100 700 70,000 100
24-Feb-21Wool 100 550 55,000 100
30-Mar-21 Wool 100 480 48,000 100
600 278,000 600
10-Jan-20 100 150 15,000 600 60,000
11-Feb-20 20 250 5,000 600 12,000
20,000 72,000
Profit 52,000
Model Parameter You are running a restaurant called McB! You make great burgers - you are asked to model the actual net profits
restaurant has to pay 50% of tax on profits.
Date Inventory Detail Units (KG)CostAmount Units (KG)
10-Jan-20 Burger Buns 5 55 275 5
11-Feb-20 Burger Buns 5 62 310 5
17-Mar-20 Burger Buns 5 57 285 5
21-Feb-21Burger Buns 5 69 345 5
24-Feb-21Burger Buns 5 81 405 5
30-Mar-21 Burger Buns 5 51 255 5
30 1,875 30
Daily consumption - 10 KGS
Find out the profit if 1 kg burger bun is sold for 75 Rs.
HIFO
MAX Formula is used
ALT + E + S + V Max 81 5 405 75 375
For Value Pasting 69 5 345 75 375
10 750 750 We have just broke
Net Prfit 0
Tax 0
FIFO
MAX Formula is used
Max 55 5 275 75 375
62 5 345 75 375
10 620 750
Net Prfit 130
Tax 65
profit after taxes 65
Recommendation - go for FIFO method!
Fixed Asset Predictive Modelling
1 You will be given a current Fixed Asset scenario - you need to predict how the future will look!
2 If you want to predict how the future will look, you need to know how long the fixed asset will be in circul
3 Usint point 2, you will get a fair idea of depreciation - will be handled in the next class!
4 Remember - dep is useful! Why? It is not actually an expense but gets you tax benefit. Higher the dep,
5 Different models for depreciation - you need to know which model works best for you.
THE END
Depreciation and Working Capital
Depreciation
Depreciation is the systematic writing off of fixed assets of the firm over a period of time - determined by the life of the asset.
Fixed Asset is generally recognized first in the Balance Sheet at Cost!
At yearly intervals, this amount is reduced from the BS/ and taken to the P/L - this is called depreciation.
1 Helps you recognize the correct value of FA in the BS
2 Helps you to recognize the correct expense on a FA in the BS
3 It is also a buffer for a future expense on fixed assets…
Methods of calculating depreciation
1 Straight Line Method of depreciation
2 Written Down Value Method
3 Sum of the Years Method
4 Units of Production Method
1 Straight Line Method of depreciation
You will write off the fixed asset evenly across the life of the asset!
If life - 10 years, straight line method says your value of dep = FA cost/ life
Accepted widely, easy to calculate.
Problem - not all assets detoriate evenly, most detoriation happens in the beginning of the life of the asset.
When you purchase a car - life is 10 years. The most detoriation in value, will only be in the first 5 years.
2 Written Down Value
It will depreciate the asset more when the asset is in the beginning stage, and lesser when the asset is in the later stages
Problem - the asset might not evenly depreciate, not easy to calculate.
WDV - Opening FA cost / %
= Closing FA cost
Openign FA cost = Closing FA cost
Parameter Model We have a car worth 10L, brand new bought for Reliance Apparel.
The life of this car is conservatively estimated to be 17 years. WDV - 0.085%
Calculate dep on this car under SLM and WDV - written down value. Rate 0.09%
I want to know what is the dep calculable at the 16th year under both methods.
30 sec
SLM
Cost 1,000,000
Life 17
Dep 58,824 on the first year as well as on the 16th year, this dep amount will remain the same!
WDV 1 2 3 4 5 6 7 8 9 10 11 12 13 14 15 16 17 18 19 20 21 22 23 24 25 26 27 28 29 30 31 32 33 34 35 36 37 38 39 40 41 42 43 44 45 46 47 48 49 50 51 52 53 54 55 56 57 58 59 60 61 62 63 64 65 66 67 68 69 70 71 72 73 74 75 76 77 78 79 80 81 82 83 84 85 86 87 88 89 90 91 92 93 94 95 96 97 98 99 100
Cost 1,000,000 999,150 998,301 997,452 996,604 995,757 994,911 994,065 993,220 992,376 991,532 990,690 989,848 989,006 988,166 987,326 986,486 985,648 984,810 983,973 983,137 982,301 981,466 980,632 979,798 978,965 978,133 977,302 976,471 975,641 974,812 973,983 973,155 972,328 971,502 970,676 969,851 969,026 968,203 967,380 966,558 965,736 964,915 964,095 963,275 962,457 961,639 960,821 960,004 959,188 958,373 957,559 956,745 955,931 955,119 954,307 953,496 952,685 951,876 951,066 950,258 949,450 948,643 947,837 947,031 946,226 945,422 944,618 943,815 943,013 942,212 941,411 940,611 939,811 939,012 938,214 937,417 936,620 935,824 935,028 934,233 933,439 932,646 931,853 931,061 930,270 929,479 928,689 927,900 927,111 926,323 925,535 924,749 923,963 923,177 922,393 921,609 920,825 920,042 919,260
Dep 850 849 849 848 847 846 846 845 844 844 843 842 841 841 840 839 839 838 837 836 836 835 834 834 833 832 831 831 830 829 829 828 827 826 826 825 824 824 823 822 822 821 820 819 819 818 817 817 816 815 815 814 813 813 812 811 810 810 809 808 808 807 806 806 805 804 804 803 802 802 801 800 800 799 798 797 797 796 795 795 794 793 793 792 791 791 790 789 789 788 787 787 786 785 785 784 783 783 782 781
Ending Cost 999,150 998,301 997,452 996,604 995,757 994,911 994,065 993,220 992,376 991,532 990,690 989,848 989,006 988,166 987,326 986,486 985,648 984,810 983,973 983,137 982,301 981,466 980,632 979,798 978,965 978,133 977,302 976,471 975,641 974,812 973,983 973,155 972,328 971,502 970,676 969,851 969,026 968,203 967,380 966,558 965,736 964,915 964,095 963,275 962,457 961,639 960,821 960,004 959,188 958,373 957,559 956,745 955,931 955,119 954,307 953,496 952,685 951,876 951,066 950,258 949,450 948,643 947,837 947,031 946,226 945,422 944,618 943,815 943,013 942,212 941,411 940,611 939,811 939,012 938,214 937,417 936,620 935,824 935,028 934,233 933,439 932,646 931,853 931,061 930,270 929,479 928,689 927,900 927,111 926,323 925,535 924,749 923,963 923,177 922,393 921,609 920,825 920,042 919,260 918,479
Control Checks Ending Cost -   -   -   -   -   -   -   -   -   -   -   -   -   -   -   -   -   -   -   -   -   -   -   -   -   -   -   -   -   -   -   -   -   -   -   -   -   -   -   -   -   -   -   -   -   -   -   -   -   -   -   -   -   -   -   -   -   -   -   -   -   -   -   -   -   -   -   -   -   -   -   -   -   -   -   -   -   -   -   -   -   -   -   -   -   -   -   -   -   -   -   -   -   -   -   -   -   -   -   -  
Dep -   -   -   -   -   -   -   -   -   -   -   -   -   -   -   -   -   -   -   -   -   -   -   -   -   -   -   -   -   -   -   -   -   -   -   -   -   -   -   -   -   -   -   -   -   -   -   -   -   -   -   -   -   -   -   -   -   -   -   -   -   -   -   -   -   -   -   -   -   -   -   -   -   -   -   -   -   -   -   -   -   -   -   -   -   -   -   -   -   -   -   -   -   -   -   -   -   -   -   -  
Beginning C -   -   -   -   -   -   -   -   -   -   -   -   -   -   -   -   -   -   -   -   -   -   -   -   -   -   -   -   -   -   -   -   -   -   -   -   -   -   -   -   -   -   -   -   -   -   -   -   -   -   -   -   -   -   -   -   -   -   -   -   -   -   -   -   -   -   -   -   -   -   -   -   -   -   -   -   -   -   -   -   -   -   -   -   -   -   -   -   -   -   -   -   -   -   -   -   -   -   -   -  
Parameter Model Reliance Apparel is confused between two life term machines it wants to buy!
Machine A costs 10 L, will be available for atleast 50 years, and has a dep rate of 1.5%, at the end of this pariod, whatever remaining value will be sold for 5,000 Rs.
Machine B costs 15 L, will be available for 65 years, and has a dep rate of 0.9%, at the end of this period, whatever remaining will be sold for 3500 Rs.
Calculate which machine will give you more tax benefit, which machine will give you better life, and the 42nd and 49th year of depreciation for both machines.
Assume the tax rate in question is 10%.
THE END … TO BE CONTINUED…..
WDV 1.50% Life 50 Tax 10%
Machine A
Years 1 2 3 4 5 6 7 8 9 10 11 12 13 14 15 16 17 18 19 20 21 22 23 24 25 26 27 28 29 30 31 32 33 34 35 36 37 38 39 40 41 42 43 44 45 46 47 48 49 50 51 52 53 54 55 56 57 58 59 60 61 62 63 64 65
Cost 1,000,000 985,000 970,225 955,672 941,337 927,217 913,308 899,609 886,115 872,823 859,730 846,834 834,132 821,620 809,296 797,156 785,199 773,421 761,820 750,392 739,136 728,049 717,129 706,372 695,776 685,339 675,059 664,934 654,960 645,135 635,458 625,926 616,537 607,289 598,180 589,207 580,369 571,664 563,089 554,642 546,323 538,128 530,056 522,105 514,273 506,559 498,961 491,477 484,104 476,843 469,690 462,645 455,705 448,870 442,137 435,505 428,972 422,537 416,199 409,956 403,807 397,750 391,784 385,907 380,118
Dep 15,000 14,775 14,553 14,335 14,120 13,908 13,700 13,494 13,292 13,092 12,896 12,703 12,512 12,324 12,139 11,957 11,778 11,601 11,427 11,256 11,087 10,921 10,757 10,596 10,437 10,280 10,126 9,974 9,824 9,677 9,532 9,389 9,248 9,109 8,973 8,838 8,706 8,575 8,446 8,320 8,195 8,072 7,951 7,832 7,714 7,598 7,484 7,372 7,262 7,153 7,045 6,940 6,836 6,733 6,632 6,533 6,435 6,338 6,243 6,149 6,057 5,966 5,877 5,789 5,702
Closing Cost 985,000 970,225 955,672 941,337 927,217 913,308 899,609 886,115 872,823 859,730 846,834 834,132 821,620 809,296 797,156 785,199 773,421 761,820 750,392 739,136 728,049 717,129 706,372 695,776 685,339 675,059 664,934 654,960 645,135 635,458 625,926 616,537 607,289 598,180 589,207 580,369 571,664 563,089 554,642 546,323 538,128 530,056 522,105 514,273 506,559 498,961 491,477 484,104 476,843 469,690 462,645 455,705 448,870 442,137 435,505 428,972 422,537 416,199 409,956 403,807 397,750 391,784 385,907 380,118 374,417
Tax Benefit 1,500 1,478 1,455 1,434 1,412 1,391 1,370 1,349 1,329 1,309 1,290 1,270 1,251 1,232 1,214 1,196 1,178 1,160 1,143 1,126 1,109 1,092 1,076 1,060 1,044 1,028 1,013 997 982 968 953 939 925 911 897 884 871 857 845 832 819 807 795 783 771 760 748 737 726 715 705 694 684 673 663 653 643 634 624 615 606 597 588 579 570
Value 374,417
Total Cost 1,000,000
Tax Benefit 62,558
WDV 90.00% Life 65 Tax 10% COST of OP 563,025
Machine B
Years 1 2 3 4 5 6 7 8 9 10 11 12 13 14 15 16 17 18 19 20 21 22 23 24 25 26 27 28 29 30 31 32 33 34 35 36 37 38 39 40 41 42 43 44 45 46 47 48 49 50 51 52 53 54 55 56 57 58 59 60 61 62 63 64 65
Cost 1,500,000 1,477,500 1,455,338 1,433,507 1,412,005 1,390,825 1,369,962 1,349,413 1,329,172 1,309,234 1,289,596 1,270,252 1,251,198 1,232,430 1,213,944 1,195,734 1,177,798 1,160,131 1,142,729 1,125,588 1,108,705 1,092,074 1,075,693 1,059,558 1,043,664 1,028,009 1,012,589 997,400 982,439 967,703 953,187 938,889 924,806 910,934 897,270 883,811 870,554 857,495 844,633 831,963 819,484 807,192 795,084 783,158 771,410 759,839 748,442 737,215 726,157 715,264 704,535 693,967 683,558 673,304 663,205 653,257 643,458 633,806 624,299 614,934 605,710 596,625 587,675 578,860 570,177
Dep 22,500 22,163 21,830 21,503 21,180 20,862 20,549 20,241 19,938 19,639 19,344 19,054 18,768 18,486 18,209 17,936 17,667 17,402 17,141 16,884 16,631 16,381 16,135 15,893 15,655 15,420 15,189 14,961 14,737 14,516 14,298 14,083 13,872 13,664 13,459 13,257 13,058 12,862 12,669 12,479 12,292 12,108 11,926 11,747 11,571 11,398 11,227 11,058 10,892 10,729 10,568 10,410 10,253 10,100 9,948 9,799 9,652 9,507 9,364 9,224 9,086 8,949 8,815 8,683 8,553
Closing Cost 1,477,500 1,455,338 1,433,507 1,412,005 1,390,825 1,369,962 1,349,413 1,329,172 1,309,234 1,289,596 1,270,252 1,251,198 1,232,430 1,213,944 1,195,734 1,177,798 1,160,131 1,142,729 1,125,588 1,108,705 1,092,074 1,075,693 1,059,558 1,043,664 1,028,009 1,012,589 997,400 982,439 967,703 953,187 938,889 924,806 910,934 897,270 883,811 870,554 857,495 844,633 831,963 819,484 807,192 795,084 783,158 771,410 759,839 748,442 737,215 726,157 715,264 704,535 693,967 683,558 673,304 663,205 653,257 643,458 633,806 624,299 614,934 605,710 596,625 587,675 578,860 570,177 561,625
Tax Benefit 2,250 2,216 2,183 2,150 2,118 2,086 2,055 2,024 1,994 1,964 1,934 1,905 1,877 1,849 1,821 1,794 1,767 1,740 1,714 1,688 1,663 1,638 1,614 1,589 1,565 1,542 1,519 1,496 1,474 1,452 1,430 1,408 1,387 1,366 1,346 1,326 1,306 1,286 1,267 1,248 1,229 1,211 1,193 1,175 1,157 1,140 1,123 1,106 1,089 1,073 1,057 1,041 1,025 1,010 995 980 965 951 936 922 909 895 882 868 855
Value 561,625
Total Cost 1,500,000
Let me ask you a question - what cost of machine will bring my value to 0 at the year 65? Tax Benefit 93,838
Assume same WDV rate as Machine A COST of OP 844,538
WDV 20.00% Life 65 Tax 10%
Machine A
Years 1 2 3 4 5 6 7 8 9 10 11 12 13 14 15 16 17 18 19 20 21 22 23 24 25 26 27 28 29 30 31 32 33 34 35 36 37 38 39 40 41 42 43 44 45 46 47 48 49 50 51 52 53 54 55 56 57 58 59 60 61 62 63 64 65
Cost 1,000,000 800,000 640,000 512,000 409,600 327,680 262,144 209,715 167,772 134,218 107,374 85,899 68,719 54,976 43,980 35,184 28,147 22,518 18,014 14,412 11,529 9,223 7,379 5,903 4,722 3,778 3,022 2,418 1,934 1,547 1,238 990 792 634 507 406 325 260 208 166 133 106 85 68 54 44 35 28 22 18 14 11 9 7 6 5 4 3 2 2 2 1 1 1 1
Dep 200,000 160,000 128,000 102,400 81,920 65,536 52,429 41,943 33,554 26,844 21,475 17,180 13,744 10,995 8,796 7,037 5,629 4,504 3,603 2,882 2,306 1,845 1,476 1,181 944 756 604 484 387 309 248 198 158 127 101 81 65 52 42 33 27 21 17 14 11 9 7 6 4 4 3 2 2 1 1 1 1 1 0.47890 0.38312 0.30650 0 0 0 0
Closing Cost 800,000 640,000 512,000 409,600 327,680 262,144 209,715 167,772 134,218 107,374 85,899 68,719 54,976 43,980 35,184 28,147 22,518 18,014 14,412 11,529 9,223 7,379 5,903 4,722 3,778 3,022 2,418 1,934 1,547 1,238 990 792 634 507 406 325 260 208 166 133 106 85 68 54 44 35 28 22 18 14 11 9 7 6 5 4 3 2 2 2 1 1 1 1 1
Tax Benefit 20,000 16,000 12,800 10,240 8,192 6,554 5,243 4,194 3,355 2,684 2,147 1,718 1,374 1,100 880 704 563 450 360 288 231 184 148 118 94 76 60 48 39 31 25 20 16 13 10 8 6 5 4 3 3 2 2 1 1 1 1 1 0 0 0 0 0 0 0 0 0 0 0 0 0 0 0 0 0
Value 1
Total Cost 1,000,000
Tax Benefit 100,000
COST of OP 900,000
Scenario Analysis!
Will tell you what values will bring what results - you can create a model and plug in different numbers, and with these different numbers, we will look at results!
The beauty of a good model is that you will be able to scenario analyze a lot of different items.
Along with scenario anaylsis, financial modelling also makes use of tools like monte carlo simulation! You will be simulating multiple factors - can be done with an excel but generally
more cumbersome.
You can use Monte Carlo analysis with complex SQLs, Pythons etc.
Data analsys and data modelling - comes into play.
you will need to know what data to feed in in order to make a particular model more efficient.
Closing Comments -
Depreciation is non-cash so make sure you never model it into a direct cash flow statement.
Indirect cash flow statement - you can model depreciation but ensure this is done accurately!
THE END
Working Capital
It is the amount of liquidity/ cash required to meet future expenses or liabilities.
Payables - expenses payable, creditors payable, salary payable, rent payable etc.
Asset Liability Mgmt - so once your expenses are finalized, you need to ensure you have sufficient assets to meet those expenses.
Which means - we first need to model our expenses!
and then we would have to manage our assets to meet those expenses.
There are two types of working capital - gross working capital and the next is net working capital.
Gross Working Capital = Current Assets = Cash + Sundry Debtors + Inventory (anything that can be made liquid in a reasonably short point of time)
Net Working Capital = Current Assets - Current Liabilities (Sundry Creditors, Liabilities Payable and rent/ expense payable etc.)
If you know the current liability value, you can model your assts accordingly and arrive at how much assets you need!
Change in Net Working Capital = NWC for current year - NWC for previous year.
If total current assets = 4500 Rs.
Total current liabilities = 3000 Rs.
NWC 1500
Base Scenario 1 Scenario 2 Scenario 3 Scenario 4 Ways to increase NWC
Current Assets
Cash A 5 6 5 7 4 Make more sales, spend less money in cash, sell
Sundry Debtors B 3 4 3 5 2 Make more sales
Inventory C 2 3 2 4 1 Buy more inventory at cheaper costs.
Total Current Assets A+B+C=X 10 X 13 10 16 7
Current Liabilities
Sundry Creditors D 2 2 1 3 0 Buy cheaper, also make sure you use the correc
Other Payables E 4 4 3 5 2 Incur less expenses, so that you wont have spen
Total Current Liab D+E=Y 6 Y 6 4 8 2
Net Working Capital X-Y 4 X-Y 7 6 8 5
NWC will increase if
1 X goes up, but Y remains constant
2 X remains constant, but Y reduces
3 X increases and Y increases, but X increases more than Y
4 X decreases and Y decreases, but Y decreases more than X
Model Parameter
Reliance Apparel is trying to model working capital for the next 6 month. They expect current sales to increase by 50%, out of which 30% will be in cash. Curren
They also expect purchases of raw materials to go down by 10%, currently for every unit sold, cost of purchase is 60%.
All purchases will be in credit.
They will also sell a fixed asset - land for 10,000 and deposit the money in cash.
Other payable for this period are 3000, rent and 4000, salaries. This will both go up by 25% after 6 months.
Make a base model, and a post 6 month model in order to arrive at the correct values.
Particulars Base 6M Model Current Assets Base 6M Model
Sales 1,000 1,500 Cash 150,000 235,000
Value 500 500 Debtors 350,000 525,000
Inventory -   -  
Sales Value 500,000 750,000
Total Current Assets 500,000 760,000
Cash Sales 150,000 225,000
Credit Sales 350,000 525,000 Payables 300,000 450,000
Other - Rent + Salary 42,000 52,500
Purchases 300,000 450,000
Total Current Liabilities 342,000 502,500
Cash Purchase -   -  
Credit Purchase 300,000 450,000 Total Net Working Capital 158,000 257,500
Multi period Working Capital Model!
Sale of items
Cash Sale of fixed assets
Loans
Debtors
Revenue generating items like sales, service provided etc
Advances
Prepayments done - to get a contract
Creditors extra payment done last time - adjusted this time
Prepayments received
Payables
Inventory Expenses
Purchases
getting any product / service etc.
Purchase
Sales
Purchase Return Day to day expenses
Sales Return Rent, Salaries etc.
Something you need to pay but havent paid
Model Parameters
x We are the owners of Reliance apparel - balance sheet currently only has Capital and Cash - each 1 L
x In the current period/ year (2021), you purchase items for 7 L, pay 10% in cash, and the rest in credit
x You also sell all of these items at a 10% margin - earning the entire amount in cash.
x At the end of the year, you purchase a further 10L of items, paying 50% cash, and the rest in credit.
x Next year (2022) you sell your entire inventory at 15% profit, entiry on credit.
x In 2022 total purchases are 25L, and you settle all of 2021's creditors balances. All of 2022's purchases are through credit.
x You sell all of 2022's purchases for 10% profit, and earn 70% in cash and the rest are balance as of the end of the year.
x In 2023, your purchases are 10% more than 2022, and the same cash: credit ratio is maintained.
x 2023 Sales are the same as the sales for 2022, and all in credit. 2022's debtors settle their balance in 2023.
x In 2024, all opening debit and creditors balances are settled.
x Prepare a Working Capital Model showing net working capital for 2021-2024. Do not make any further assumptions than what is alrea
Working Capital 2021 2022 2023 2024
Current Assets
Cash 1,300,000 2,095,000 3,320,000 820,000
Debtors -   1,225,000 2,750,000 -  
Inventory 1,000,000 -   -   -  
Total 2,300,000 3,320,000 6,070,000 820,000
Current Liabilities
Creditors 1,130,000 2,500,000 5,250,000 -  
Total 1,130,000 2,500,000 5,250,000 -  
Net Working Capita 1,170,000 820,000 820,000 820,000
Working Papers
Sales 770,000 -   -   -   Value (Rs.)
Cash 770,000
Credit -  
Purchases 700,000 -   -   -   Value (Rs.)
Cash 70,000
Credit 630,000
Total Cash
Opening 100,000 800,000 800,000 800,000
Cash Rec'd 770,000
Cash Paid 70,000
Closing 800,000 800,000 800,000 800,000
Total Debtors
Opening -   -   -   -  
Credit Sales -  
Debtors Cash Rec'd -  
Closing -   -   -   -  
Total Creditors
Opening -   630,000 630,000 630,000
Credit Purchases 700,000 -   -   -  
Creditors Paid 70,000
Closing 630,000 630,000 630,000 630,000
Total Inventory
Opening -   -70,000 -70,000 -70,000
Purchases Made 700,000 -   -   -  
Sales Made 770,000 -   -   -  
Closing -70,000 -70,000 -70,000 -70,000
THE END
Ratios and Financial Modelling
What are financial ratios?
1 These are basically sourced from financial statements.
Once you finish modelling your financial statements, it is never complete until and unless ratios are also modelled along with it!
2 It gives us meaningful information on financial statements!
3 More long term in nature!
Some of these are short term ratios - some are long term, and you will know which ratios help you how!
4 Helps with quant analysis - what is quant analysis?
Regressing company data - to see patterns.
Types of financial ratios!
1 Liquidity Ratio
2 Leverage Ratio Leverage means debt!
3 Efficiency Ratio
4 Profitability Ratio
5 Market Value Ratio
These ratios can be used for different purposes - they are coming from different numbers!
They all come from our financial statements - but which parts of the financial statement is the question!
Balance Sheet Profit and Loss A/C
Liabilities and Capital Assets Debit Credit
Particulars Amount Particulars Amount Particulars Amount Particulars Amount
Capital Fixed Assets Purchases 18,000 Sales 50,000
Equity Capital
10,000 Plant and Machinery 15,000
Interest
Exp 7,500
Reserves and Surplus 14,500 Intangibles - Goodwill 8,000 Rent Exp 8,000
Liabilities Salary Exp 8,000
Long Term Liabilities Current Assets Profit 8,500
Loan from Banks 5,000 Cash 10,000
Debentures/ Bonds 3,000 Sundry Debtors 5,000
Inventory 7,000 Total 50,000 Total 50,000
Short Term Liabilities -  
Sundry Creditors 8,000
Rent and Salary Payables 4,500
Total 45,000 Total 45,000
Liquidity Ratios
Current Ratio = Current Assets / Current Liabilities Current Assets = 22,000
If Current Assets = Current Liabilities = 1 Current Liabilities = 12,500
More Current Assets than Current Liabilities >1 - which is good
Less Current Assets than Current Liabilities <1 - which is bad Ratio = 1.76 Great!
Acid Test Ratio = Current Assets - Inventory/ Current Liabilites
it means if I don’t have time to sell the inventory, how will my current ratio
look? Current Assets = 15,000 not incl. i
So will acid tst ratio be > current ratio? NO! Put a check to make sure it never is Current Liabilities = 12,500
If Current Assets (minus inventory) = Current Liabilities = 1
More Current Assets (minus inventory) than Current Liabilities >1 - which is good Ratio = 1.20 Great!
Less Current Assets (minus inventory) than Current Liabilities <1 - which is bad
If acid test ratio is less than 1, and current ratio is greater than 1 - it means you are too dependent on inventories. Be careful!
Cash Ratio Current assets (minus everything except cash) ->Cash / Current Liabilities Current Assets = 10,000 not incl. i
Can cash ratio be greater than acid test ratio? NO! It has to be lower. Current Liabilities = 12,500
If Cash = Current Liabilities = 1
More cash than Current Liabilities >1 - which is good Ratio = 0.80 Not good
Less Cash than Current Liabilities <1 - which is bad
Operating Cash Flow Ratio Operating cash flow/ Current Liabilities
What is the difference between Cash ratio and operating cash flow ratio?
Operating Cash Flow = all cash related amounts you earned and paid etc for the current year!
Not considering opening cash balance!
Only looking at current years cash balance from sales minus expenses you paid etc.
It will tell you how many time of expenses you can pay out using operating cash flow.
Assume Operating Cash flow is 1L for the company that we are looking at.
Operating Cash Flow Ratio = 100,000 = 8 8x
12,500
What it means is - you can afford to pay out 8x the current liabilities with just operating cash flows.
Which means if current liabilities is 8x larger - 100,000 I can completely pay this with my operating cash flows.
I don’t have to invest or finance for these cash flows.
Larger the operating cash flow ratio, the better it is for the company!
Leverage Ratios
Debt Ratio = Total Liabilities Total Liab. Will include all liabilities
Total Assets Total Assets will include all assets.
We all want assets to be larger! So, assets are denominators - > and if denominator is larger, smaller the ratio, better it is for the company!
Total Liabilities 20,500
Total Assets 45,000
Total Liabilities = 0.46
Total Assets
which means - for every rupee of assets you have, 46p is a liability you need to pay out!
So can we say what the free assets are?
0.54 p is free assets
Debt to Equity = Total Liabilities Total Liab. Will include all liabilities
Total Shareholders Equity Equity Capital + profits you made till date - losses you suffered till date (Sometimes called reserves and surplus)
it means for every rupee of capital, or equity you have in the business, how much liab is still in the business?
If you invested 100,000
Profits till date 70,000
Losses 30,000
Net Reserves and Surplus 40,000 This is the amount you will see in the Balance Sheet.
This is the amount the shareholders have earned, but have not removed from the business -
they didn’t take any dividends
they didn’t take any salaries
etc.
Its like the total investment amount along with the initial capital
Total Liabilities 20,500 = 0.84
Total Shareholders Equity 24,500
It means, for every 1 Rupee I have left invested in the business, I have 84p of debt to be paid with that
You need to first pay all your debt - and this is paid through the 84p that you have invested in the company!
Interest Coverage Ratio = Total Operating Income = Sales - Expenses (EBIT) 16,000 2.13
Total Debt Service ( Interest Paid ) Interest Paid 7,500
It means I can afford to pay 2x the interest I am currently paying - so if my interest expense goes up another 2.13 times - I
will still be able to pay it without making a loss!
So - if the interest coverage ratio = 1, it means your operating income and interest paid are equal!
If interest coverage ration > 1, more operating income than interest paid - good!
If interest coverage ratio < 1, less operating income than interest paid - bad!
Higher the interest coverage ratio - better it is for the company!
Efficiency Ratio
Asset Turnover Ratio = Net Sales If more numerator than denominator, more sales and less assets, ratio is hiher and therefore this company is really good!
Total avg assets If more denominator than numerator, more assets and less sales, this ratio is low and bad for the company!
Net Sales = All Sales - Sales Return
Avg Assets = avg over a year
50,000 1.11
45,000
For 1 rupee of assets, I'm making 1.11 rupee of sales!
Higher the better!
Inventory Turnover Ratio = COGS How much was the cost of good sold, and how much is my avg inventory - how many times my companys inventory is
Avg Inventory replaced over a given period.
COGS - will tell you the total inventory sold in a year!
Avg inv - will only tell you how much is there in your BS at the end of the year.
Starting inventory 1L
Increased to 1L 1L
Sold 2L -2L
Increased to 1L 1L
Sold 1L -1L
Increased to 1L 1L
Closing Inventory 1L
COGS +3L
Inventory Turnover Ratio 3L = 3 times
1L
We purchased this inventory three times in order to maintain stock!
Receivables Turnover ratio/ Payables Turnover Ratio
Credit Sales/ Credit Purchasesvery simialr to inventory turnover ratio
Avg recb or Avg Payable
THE END
Profitability Ratio
It measure the ability of a company to generate income with respect to the revenue it makes!
This is basically a link between revenue and profits.
Let us take Amazon! And let us take our local kirana shop!
Amazon has revenues of crores and crores! No profit till date!
The kirana shop probably makes 1L revenue - but makes a small 10% profit on it.
Which model of business is better?
Profit and Loss A/C
Debit Credit
Particulars Amount Particulars Amount
Purchases 18,000 Sales 50,000
Interest Exp 7,500
Rent Exp 8,000
Salary Exp 8,000
Profit 8,500
Total 50,000 Total 50,000
Gross Profit Ratio
Gross Profit = 32,000 = 0.64
Sales 50,000
It means for every rupee of sales you make, you make 64p of gross profit!
Higher the gross profit ratio, the better it is!
we have already seen the linkage between gross profit and net profit - the linkage between the gross p
What does High NP, but Low GP or Low NP and High GP mean? Analysis!
Remember -> gross profit is sales minus direct expenses (do not include indirect expenses) for diff between direct and indirect -> refer to t
Sales is net sales - total sales minut sales return!
Net Profit Ratio
Net Profits = 8,500 = 0.17
Sales 50,000
It means for every rupee of revenue you make, you make 17p of net profits
Higher the net profit the better it is!
Sales 1
Direct Expenses 0.36 36 p of direct expenses for every rupee of sales you make
GP 0.64
Indirect Expenses 0.47 47 p of indirect expenses for every rupee of sales you ma
NP 0.17
Indirect Expenses Ratio - All indirect expenses 23,500 0.47
Sales 50,000
Salary Salary 8,000 0.16
Sales 50,000
Rent Rent 8,000 0.16 0.32
Sales 50,000
Interest Interest 7,500 0.15 0.15
Sales 50,000
0.47 0.47
This is called attribution - or ratio attribution!
This is basically breaking up your ratios into different sub categories!
Operating Margin Ratio This is very similar to the gross profit ratio, only difference is that you take operating profit as numerator, and no
Operating Profit = Net profit + Interest + Tax
or called as EBIT
Operating Profit 16,000 32%
50,000
Net Profit 17%
Difference 15% Interest and tax!
Return on Assets Ratio Net Income
Total Assets
This will tell you how much profit you are making per rupee of assets you have!
Net Profits = 8,500 0.19
Total Assets = 45,000
This means that for every 1 Rupee of asset you have, you make 19 p of profit!
This is very similar to the assets turnover ratio!
ROE (Return of Equity) Net Income
Total Shareholders Equity
This will tell you how how much profit you make, for every rupee of shareholders equity that you have!
This is similar to the Debt: Equity, only difference is instead of debt you will be looking at Net Income: Eq
Net Profits = 8,500 0.35
Total Shareholders Eq = 24,500
For every rupee invested in this company - I make 35 p of income!
With every model you make, a lot of these ratios are derived - error in modelling means an error in the ratio itself!
THE END
Market Value Ratios
These ratios will tell you how your company is positioned in the market - as you value the company's shares or stocks!
Book Value per Share Balance Sheet
Liabilities and Capital Assets
Shareholders Equity Particulars Amount Particulars Amount
Total Shares Outstanding Capital Fixed Assets
Equity Capital 10,000 Plant and Machinery 15,000
Reserves and Surplus 14,500 Intangibles - Goodwill 8,000
Shareholders Eq = All equity capital + All eq capital's reserves and surplus! Liabilities
= 24,500 Long Term Liabilities Current Assets
Loan from Banks 5,000 Cash 10,000
or Debentures/ Bonds 3,000 Sundry Debtors 5,000
Inventory 7,000
Assets minus Liabilities Short Term Liabilities -  
= 24,500 Sundry Creditors 8,000
Rent and Salary Payables 4,500
Let us assume total oustanding shares are 10k shares (number! Not value!)
Total 45,000 Total 45,000
Shares Outstanding 10,000
BVPS 2.45
Attribution analysis for this value - find out how we can break this out
Capital 1 Total capital available divided by total shared
R&S 1.45 Total reserves available / total shares
2.45
Higher the book value, better it is! But remember only one thing - BVPS will not determine your market value.
Market value is driven by a lot of 'other things' - suspense!
Dividend Yield ratio
This is telling you per rupee of MV, how much dividend am I getting?
BVPS 2.45
Let us assume this company's shares are trading at the same MV as BV.
They have declared a dividend of 5rs per share.
Your yield is Dividend per share = 5 = 2.04
MV per share 2.45
It means for every 1 rupee of share you own (MV), you get 2.04 rs as dividend!
you are basically doubling this money every year just through dividends!
Higher the yield, more cash, therefore better it is for the company!
EPS (Earnings Per Share)
Net Profits = 8,500 = 0.85
Number of Shares 10,000
This will tell you how much net profit you make for every share you own!
Higher the better, because it means you get more profits from owning shares!
Price to Earnings Ratio
This is one of the most important ratios when it comes to companys analysis!
And when we model - we have to set up a great model for PE ratio before we start!
Why?
This will determine whether the company is good or bad!
Market Value per Share = 2.45 = 2.88
Earning per Share 0.85
It means that for every 1 rupee of EPS, the shareholder will receive 2.88 rupees from the market!
The market will give you a premium of 1.88 rupees for every rupee you earn!
Is this efficient?
Not a question we should be asking!
Higher the PE for a share you own, better it is.
Higher the PE for a share you want to own, do more analysis.
For example - if the industry PE ratio is 1.75, but the share you own is giving you a PE of 2.88, be a little wary!
this means my share is overvalued!
Therefore, sell it.
We will talk about these buy/ sell decisions a little later, but for now remember only one thing!
High PE ratio is not always good, low PE ratio is not always bad!
PE ratio is very important for you to source data from the market!
Conclusion and Common Errors
Conclusion - basically a list of points you need to remember whenever it comes to creating a model!
Important Points You Need To Remember
1 Financial Modelling is done by analysts, as well as people who want to express an opinion on the FS.
2 What is a model - basically drawing up present and future financial statements in order to see the path/ progress of a company!
3 You will get data from ledgers as well as different other sources of information - and you might have to use your own models.
4 All data is dependent on some other data! P/L is dependent on ledger, your B/s is dependent on ledgers - so no data is useless!
5 Some information is a byproduct of other information - for eg. Creditors are a byproduct of purchases and credit ratio!
6 When it comes to data, or modelling - make sure your basics are in place!
7 Data, data, data - either data is given to you, or you need to assume it yourself!
if it’s a predective model - make sure your assumptions are reasonable.
8 Never write off a business model using a one period model!
9 Control Checks - more is better than less.
10 understand how the end product is going to look, structure it accordingly.
" Easy to See, and Easier to Understand"
Important Excel ERRORs you should avoid!
1 Cross Reference/ Circular Reference Error - this happens when two sets data are cross referencing each other, thus there is no final correct answer!
A B
1 1
2 2
3 3
4 4
5 5
#REF! #REF!
#REF! #REF!
How to resolve: You need to check which cells are causing the circular reference error, and make appropriate corrections!
No cell should be dependent on another cell for information!
2 ####### error
This happens when numbers in a particular cell are too big to fit into the cell's width
32,165,465,165,416,500,000,000,000,000,000,000,000,000,000,000,000,000,000,000.00
This means the number is really too big to fit into the cell D40
How to resolve: Expand the cell.
3 Wrong number format error
This happens when a number is in the wrong format! It will be in log, or e^formats, like the below -
3.21655E+58
This number format is basically telling us - there are 58 digits after the number expressed. Which means wee need to change the format in which it is expressed.
How to change the format: go to
ALT + H + N + (ALT + DOWN Arrow)
Remember to hover over the cell that is giving you the problem when you do this!
4 #Name Error
(#NAME?)
This error comes up when the excel sheer is not able to recognize the text in the formula!
For example, one common formula we use is SUM
But if you put it wrong, it will give a NAME error
1
2
3
4
5
#NAME?
How to resolve: Make sure your formula is accurate - text in the formula is accurate!
1
2
3
4
5
15
5 VALUE Error - this comes up when the variables mentioned in the formula is wrong - what do you mean by variables? The cell references we mention in the formula!
1
2
3
4
sid
#VALUE!
How to avoid: In order to avoid this, make sure all the cell references are accurate, as well as relevant
6 #DIV?0! Error!
This error comes up when you ask something to divide by 0. Can we divide by 0? We cannot - so this error will majorly be a test with respect to Division by 0
For example -
500
0
#DIV/0!
How can this be avoided -
1. Do you really want to divide by zero? Try putting 0.00000001 - this might work!
500
0.0000001
5000000000
But the answer is not accurate - the right answer is infinity! Remember 5th grade math?
2. Don’t divide by 0! Change the number to any other rational number.
7 NULL Error
This comes up when your symbols in a formula are wrong
For example
1
2
3
#ERROR!
In order to fix this: Make sure you put in the right arithmetic symbols -
1
2
3
6
+ sum(C55+D55)
NAME ERROR
NULL ERROR or VALUE Error
Null Error: arythmetic symbol issues
VALUE Error: Cell ref issues
8 REF error
If the data you are referencing is no longer presenting, a ref error comes up!
1
2
3
6 This is good
1
2
#REF! This is good
How do you resolve: Go to the original data, and check formulas!
THE END
[1] Author:
Set of assumptions!

Contenu connexe

Similaire à Financial Modelling and Valuation Curriculum(1)-1.pdf

Danspresentationnpmaacademy09 12566688864796 Phpapp02
Danspresentationnpmaacademy09 12566688864796 Phpapp02Danspresentationnpmaacademy09 12566688864796 Phpapp02
Danspresentationnpmaacademy09 12566688864796 Phpapp02TFMason
 
Basics of accounting
Basics of accountingBasics of accounting
Basics of accountingsrajpatnaik
 
Summary accounting seminar
Summary accounting seminarSummary accounting seminar
Summary accounting seminarRoger Claessens
 
Statement of Financial Position.pptx
Statement of Financial Position.pptxStatement of Financial Position.pptx
Statement of Financial Position.pptxmarissacasarenoalmue
 
How to do Fundamental Analysis in Stock market - 1
How to do Fundamental Analysis in Stock market - 1How to do Fundamental Analysis in Stock market - 1
How to do Fundamental Analysis in Stock market - 1Dr Venkatesh Karthikeyan
 
Accounting and Finance Basics.pptx
Accounting and Finance Basics.pptxAccounting and Finance Basics.pptx
Accounting and Finance Basics.pptxEvaneMarkc
 
Your First Step to Financial Intelligence
Your First Step to Financial IntelligenceYour First Step to Financial Intelligence
Your First Step to Financial IntelligenceLearning Infinite
 
How to talk to your cfo with confidence eguide
How to talk to your cfo with confidence eguideHow to talk to your cfo with confidence eguide
How to talk to your cfo with confidence eguidearkslideshareacc
 
1 Intro to Entrepreneurship
1  Intro to Entrepreneurship1  Intro to Entrepreneurship
1 Intro to Entrepreneurshipjohn3092
 
Introduction to working capital
Introduction to working capitalIntroduction to working capital
Introduction to working capitalGeoff Burton
 
Bad To Worse.Ppt
Bad To Worse.PptBad To Worse.Ppt
Bad To Worse.Pptguest147d26
 

Similaire à Financial Modelling and Valuation Curriculum(1)-1.pdf (20)

Danspresentationnpmaacademy09 12566688864796 Phpapp02
Danspresentationnpmaacademy09 12566688864796 Phpapp02Danspresentationnpmaacademy09 12566688864796 Phpapp02
Danspresentationnpmaacademy09 12566688864796 Phpapp02
 
Basics of accounting
Basics of accountingBasics of accounting
Basics of accounting
 
Basics Of Accounting & Book Keeping
Basics Of Accounting & Book KeepingBasics Of Accounting & Book Keeping
Basics Of Accounting & Book Keeping
 
Summary accounting seminar
Summary accounting seminarSummary accounting seminar
Summary accounting seminar
 
Basic Accounting
Basic AccountingBasic Accounting
Basic Accounting
 
Statement of Financial Position.pptx
Statement of Financial Position.pptxStatement of Financial Position.pptx
Statement of Financial Position.pptx
 
ENTREP(edited) 03.pptx
ENTREP(edited) 03.pptxENTREP(edited) 03.pptx
ENTREP(edited) 03.pptx
 
How to do Fundamental Analysis in Stock market - 1
How to do Fundamental Analysis in Stock market - 1How to do Fundamental Analysis in Stock market - 1
How to do Fundamental Analysis in Stock market - 1
 
Management Accounting
Management AccountingManagement Accounting
Management Accounting
 
Accounting and Finance Basics.pptx
Accounting and Finance Basics.pptxAccounting and Finance Basics.pptx
Accounting and Finance Basics.pptx
 
Your First Step to Financial Intelligence
Your First Step to Financial IntelligenceYour First Step to Financial Intelligence
Your First Step to Financial Intelligence
 
How to talk to your cfo with confidence eguide
How to talk to your cfo with confidence eguideHow to talk to your cfo with confidence eguide
How to talk to your cfo with confidence eguide
 
Understanding the Balance Sheet.
Understanding the Balance Sheet.Understanding the Balance Sheet.
Understanding the Balance Sheet.
 
1 Intro to Entrepreneurship
1  Intro to Entrepreneurship1  Intro to Entrepreneurship
1 Intro to Entrepreneurship
 
Accountancy For Business 17 October
Accountancy  For Business 17 OctoberAccountancy  For Business 17 October
Accountancy For Business 17 October
 
Bad To Worse
Bad To WorseBad To Worse
Bad To Worse
 
2 12 acctg
2 12 acctg2 12 acctg
2 12 acctg
 
Introduction to working capital
Introduction to working capitalIntroduction to working capital
Introduction to working capital
 
Bad To Worse.Ppt
Bad To Worse.PptBad To Worse.Ppt
Bad To Worse.Ppt
 
Understanding Your Financial Statements
Understanding Your Financial StatementsUnderstanding Your Financial Statements
Understanding Your Financial Statements
 

Dernier

VIP Call Girl Amritsar 7001035870 Enjoy Call Girls With Our Escorts
VIP Call Girl Amritsar 7001035870 Enjoy Call Girls With Our EscortsVIP Call Girl Amritsar 7001035870 Enjoy Call Girls With Our Escorts
VIP Call Girl Amritsar 7001035870 Enjoy Call Girls With Our Escortssonatiwari757
 
CALL ON ➥8923113531 🔝Call Girls Fazullaganj Lucknow best sexual service
CALL ON ➥8923113531 🔝Call Girls Fazullaganj Lucknow best sexual serviceCALL ON ➥8923113531 🔝Call Girls Fazullaganj Lucknow best sexual service
CALL ON ➥8923113531 🔝Call Girls Fazullaganj Lucknow best sexual serviceanilsa9823
 
Best investment platform in india-Falcon Invoice Discounting
Best investment platform in india-Falcon Invoice DiscountingBest investment platform in india-Falcon Invoice Discounting
Best investment platform in india-Falcon Invoice DiscountingFalcon Invoice Discounting
 
Call Girls In Amritsar 💯Call Us 🔝 76967 34778🔝 💃 Independent Escort In Amritsar
Call Girls In Amritsar 💯Call Us 🔝 76967 34778🔝 💃 Independent Escort In AmritsarCall Girls In Amritsar 💯Call Us 🔝 76967 34778🔝 💃 Independent Escort In Amritsar
Call Girls In Amritsar 💯Call Us 🔝 76967 34778🔝 💃 Independent Escort In Amritsaronly4webmaster01
 
CALL ON ➥8923113531 🔝Call Girls Vineet Khand Lucknow best Night Fun service 🧦
CALL ON ➥8923113531 🔝Call Girls Vineet Khand Lucknow best Night Fun service  🧦CALL ON ➥8923113531 🔝Call Girls Vineet Khand Lucknow best Night Fun service  🧦
CALL ON ➥8923113531 🔝Call Girls Vineet Khand Lucknow best Night Fun service 🧦anilsa9823
 
✂️ 👅 Independent Goregaon Escorts With Room Vashi Call Girls 💃 9004004663
✂️ 👅 Independent Goregaon Escorts With Room Vashi Call Girls 💃 9004004663✂️ 👅 Independent Goregaon Escorts With Room Vashi Call Girls 💃 9004004663
✂️ 👅 Independent Goregaon Escorts With Room Vashi Call Girls 💃 9004004663Call Girls Mumbai
 
Pakistani Call girls in Ajman +971563133746 Ajman Call girls
Pakistani Call girls in Ajman +971563133746 Ajman Call girlsPakistani Call girls in Ajman +971563133746 Ajman Call girls
Pakistani Call girls in Ajman +971563133746 Ajman Call girlsgwenoracqe6
 
VVIP Pune Call Girls Handewadi WhatSapp Number 8005736733 With Elite Staff An...
VVIP Pune Call Girls Handewadi WhatSapp Number 8005736733 With Elite Staff An...VVIP Pune Call Girls Handewadi WhatSapp Number 8005736733 With Elite Staff An...
VVIP Pune Call Girls Handewadi WhatSapp Number 8005736733 With Elite Staff An...SUHANI PANDEY
 
Q3 FY24 Earnings Conference Call Presentation
Q3 FY24 Earnings Conference Call PresentationQ3 FY24 Earnings Conference Call Presentation
Q3 FY24 Earnings Conference Call PresentationSysco_Investors
 
Call Girls in Friends Colony 9711199171 Delhi Enjoy Call Girls With Our Escorts
Call Girls in Friends Colony 9711199171 Delhi Enjoy Call Girls With Our EscortsCall Girls in Friends Colony 9711199171 Delhi Enjoy Call Girls With Our Escorts
Call Girls in Friends Colony 9711199171 Delhi Enjoy Call Girls With Our Escortsindian call girls near you
 
Ambala Escorts Service ☎️ 6378878445 ( Sakshi Sinha ) High Profile Call Girls...
Ambala Escorts Service ☎️ 6378878445 ( Sakshi Sinha ) High Profile Call Girls...Ambala Escorts Service ☎️ 6378878445 ( Sakshi Sinha ) High Profile Call Girls...
Ambala Escorts Service ☎️ 6378878445 ( Sakshi Sinha ) High Profile Call Girls...mriyagarg453
 
Editing progress 20th march.docxxxxxxxxx
Editing progress 20th march.docxxxxxxxxxEditing progress 20th march.docxxxxxxxxx
Editing progress 20th march.docxxxxxxxxxMollyBrown86
 
VIP Amritsar Call Girl 7001035870 Enjoy Call Girls With Our Escorts
VIP Amritsar Call Girl 7001035870 Enjoy Call Girls With Our EscortsVIP Amritsar Call Girl 7001035870 Enjoy Call Girls With Our Escorts
VIP Amritsar Call Girl 7001035870 Enjoy Call Girls With Our Escortssonatiwari757
 
Enjoy Night⚡Call Girls Udyog Vihar Gurgaon >༒8448380779 Escort Service
Enjoy Night⚡Call Girls Udyog Vihar Gurgaon >༒8448380779 Escort ServiceEnjoy Night⚡Call Girls Udyog Vihar Gurgaon >༒8448380779 Escort Service
Enjoy Night⚡Call Girls Udyog Vihar Gurgaon >༒8448380779 Escort ServiceDelhi Call girls
 
Teck Investor Presentation, April 24, 2024
Teck Investor Presentation, April 24, 2024Teck Investor Presentation, April 24, 2024
Teck Investor Presentation, April 24, 2024TeckResourcesLtd
 

Dernier (20)

VIP Call Girl Amritsar 7001035870 Enjoy Call Girls With Our Escorts
VIP Call Girl Amritsar 7001035870 Enjoy Call Girls With Our EscortsVIP Call Girl Amritsar 7001035870 Enjoy Call Girls With Our Escorts
VIP Call Girl Amritsar 7001035870 Enjoy Call Girls With Our Escorts
 
(👉゚9999965857 ゚)👉 Russian Call Girls Aerocity 👉 Delhi 👈 : 9999 Cash Payment F...
(👉゚9999965857 ゚)👉 Russian Call Girls Aerocity 👉 Delhi 👈 : 9999 Cash Payment F...(👉゚9999965857 ゚)👉 Russian Call Girls Aerocity 👉 Delhi 👈 : 9999 Cash Payment F...
(👉゚9999965857 ゚)👉 Russian Call Girls Aerocity 👉 Delhi 👈 : 9999 Cash Payment F...
 
CALL ON ➥8923113531 🔝Call Girls Fazullaganj Lucknow best sexual service
CALL ON ➥8923113531 🔝Call Girls Fazullaganj Lucknow best sexual serviceCALL ON ➥8923113531 🔝Call Girls Fazullaganj Lucknow best sexual service
CALL ON ➥8923113531 🔝Call Girls Fazullaganj Lucknow best sexual service
 
(👉゚9999965857 ゚)👉 VIP Call Girls Friends Colony 👉 Delhi 👈 : 9999 Cash Payment...
(👉゚9999965857 ゚)👉 VIP Call Girls Friends Colony 👉 Delhi 👈 : 9999 Cash Payment...(👉゚9999965857 ゚)👉 VIP Call Girls Friends Colony 👉 Delhi 👈 : 9999 Cash Payment...
(👉゚9999965857 ゚)👉 VIP Call Girls Friends Colony 👉 Delhi 👈 : 9999 Cash Payment...
 
Best investment platform in india-Falcon Invoice Discounting
Best investment platform in india-Falcon Invoice DiscountingBest investment platform in india-Falcon Invoice Discounting
Best investment platform in india-Falcon Invoice Discounting
 
Call Girls In Amritsar 💯Call Us 🔝 76967 34778🔝 💃 Independent Escort In Amritsar
Call Girls In Amritsar 💯Call Us 🔝 76967 34778🔝 💃 Independent Escort In AmritsarCall Girls In Amritsar 💯Call Us 🔝 76967 34778🔝 💃 Independent Escort In Amritsar
Call Girls In Amritsar 💯Call Us 🔝 76967 34778🔝 💃 Independent Escort In Amritsar
 
CALL ON ➥8923113531 🔝Call Girls Vineet Khand Lucknow best Night Fun service 🧦
CALL ON ➥8923113531 🔝Call Girls Vineet Khand Lucknow best Night Fun service  🧦CALL ON ➥8923113531 🔝Call Girls Vineet Khand Lucknow best Night Fun service  🧦
CALL ON ➥8923113531 🔝Call Girls Vineet Khand Lucknow best Night Fun service 🧦
 
✂️ 👅 Independent Goregaon Escorts With Room Vashi Call Girls 💃 9004004663
✂️ 👅 Independent Goregaon Escorts With Room Vashi Call Girls 💃 9004004663✂️ 👅 Independent Goregaon Escorts With Room Vashi Call Girls 💃 9004004663
✂️ 👅 Independent Goregaon Escorts With Room Vashi Call Girls 💃 9004004663
 
Pakistani Call girls in Ajman +971563133746 Ajman Call girls
Pakistani Call girls in Ajman +971563133746 Ajman Call girlsPakistani Call girls in Ajman +971563133746 Ajman Call girls
Pakistani Call girls in Ajman +971563133746 Ajman Call girls
 
VVIP Pune Call Girls Handewadi WhatSapp Number 8005736733 With Elite Staff An...
VVIP Pune Call Girls Handewadi WhatSapp Number 8005736733 With Elite Staff An...VVIP Pune Call Girls Handewadi WhatSapp Number 8005736733 With Elite Staff An...
VVIP Pune Call Girls Handewadi WhatSapp Number 8005736733 With Elite Staff An...
 
Q3 FY24 Earnings Conference Call Presentation
Q3 FY24 Earnings Conference Call PresentationQ3 FY24 Earnings Conference Call Presentation
Q3 FY24 Earnings Conference Call Presentation
 
Call Girls in Friends Colony 9711199171 Delhi Enjoy Call Girls With Our Escorts
Call Girls in Friends Colony 9711199171 Delhi Enjoy Call Girls With Our EscortsCall Girls in Friends Colony 9711199171 Delhi Enjoy Call Girls With Our Escorts
Call Girls in Friends Colony 9711199171 Delhi Enjoy Call Girls With Our Escorts
 
Ambala Escorts Service ☎️ 6378878445 ( Sakshi Sinha ) High Profile Call Girls...
Ambala Escorts Service ☎️ 6378878445 ( Sakshi Sinha ) High Profile Call Girls...Ambala Escorts Service ☎️ 6378878445 ( Sakshi Sinha ) High Profile Call Girls...
Ambala Escorts Service ☎️ 6378878445 ( Sakshi Sinha ) High Profile Call Girls...
 
Rohini Sector 17 Call Girls Delhi 9999965857 @Sabina Saikh No Advance
Rohini Sector 17 Call Girls Delhi 9999965857 @Sabina Saikh No AdvanceRohini Sector 17 Call Girls Delhi 9999965857 @Sabina Saikh No Advance
Rohini Sector 17 Call Girls Delhi 9999965857 @Sabina Saikh No Advance
 
Editing progress 20th march.docxxxxxxxxx
Editing progress 20th march.docxxxxxxxxxEditing progress 20th march.docxxxxxxxxx
Editing progress 20th march.docxxxxxxxxx
 
VIP Amritsar Call Girl 7001035870 Enjoy Call Girls With Our Escorts
VIP Amritsar Call Girl 7001035870 Enjoy Call Girls With Our EscortsVIP Amritsar Call Girl 7001035870 Enjoy Call Girls With Our Escorts
VIP Amritsar Call Girl 7001035870 Enjoy Call Girls With Our Escorts
 
Enjoy Night⚡Call Girls Udyog Vihar Gurgaon >༒8448380779 Escort Service
Enjoy Night⚡Call Girls Udyog Vihar Gurgaon >༒8448380779 Escort ServiceEnjoy Night⚡Call Girls Udyog Vihar Gurgaon >༒8448380779 Escort Service
Enjoy Night⚡Call Girls Udyog Vihar Gurgaon >༒8448380779 Escort Service
 
Teck Investor Presentation, April 24, 2024
Teck Investor Presentation, April 24, 2024Teck Investor Presentation, April 24, 2024
Teck Investor Presentation, April 24, 2024
 
Sensual Moments: +91 9999965857 Independent Call Girls Noida Delhi {{ Monika}...
Sensual Moments: +91 9999965857 Independent Call Girls Noida Delhi {{ Monika}...Sensual Moments: +91 9999965857 Independent Call Girls Noida Delhi {{ Monika}...
Sensual Moments: +91 9999965857 Independent Call Girls Noida Delhi {{ Monika}...
 
@9999965857 🫦 Sexy Desi Call Girls Vaishali 💓 High Profile Escorts Delhi 🫶
@9999965857 🫦 Sexy Desi Call Girls Vaishali 💓 High Profile Escorts Delhi 🫶@9999965857 🫦 Sexy Desi Call Girls Vaishali 💓 High Profile Escorts Delhi 🫶
@9999965857 🫦 Sexy Desi Call Girls Vaishali 💓 High Profile Escorts Delhi 🫶
 

Financial Modelling and Valuation Curriculum(1)-1.pdf

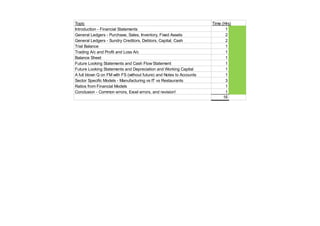
  • 1. Topic Time (Hrs) Introduction - Financial Statements 1 General Ledgers - Purchase, Sales, Inventory, Fixed Assets 2 General Ledgers - Sundry Creditors, Debtors, Capital, Cash 2 Trial Balance 1 Trading A/c and Profit and Loss A/c 1 Balance Sheet 1 Future Looking Statements and Cash Flow Statement 1 Future Looking Statements and Depreciation and Working Capital 1 A full blown Q on FM with FS (without future) and Notes to Accounts 1 Sector Specific Models - Manufacturing vs IT vs Restaurants 3 Ratios from Financial Models 1 Conclusion - Common errors, Excel errors, and revision! 1 16
  • 2. Topic Time (Hrs) Introduction to Valuation 1 Valuing Assets and Liabilities 1 Equity - Discounted Cash Flow 2 Equity - Dividend Discount Model 1 Equity - Relative Valuation Models 1 IPO Valuation - tips and tricks 1 M&A valuation 1 CAPM and Fama French Models 1 Net Asset Value 1 Debt Valuation - techniques 1 Preference Share - overview 1 Options - Introduction 1 Conclusion 1 14
  • 3. 1. Introduction to Financial Statements Underline - CTRL + U - What are financial statements? What forms a part of financial statements? - Who prepares financial statements? Are these all Chartered Accountants? - Why do we need financial statements? - Who is responsible for the accuracy of these financial statements? - What is financial modelling? - Do we really prepare financial statements or models in excel? Is that what happens in a corporate? What are financial statements? What forms a part of financial statements? There are three items that are a aprt of every financial statement - Profit and Loss Account, Balance She Profit and Loss Account - will tell you how much profit/ loss a company has enjoyed/ suffered! Periodic! If Reliance - P/L says Profit is $4cr for Q-1. April - June = Profit is 4 cr. June 30th P/L = 4 cr. July 1st P/L - profit of 1 L. Option A Will you 4 Cr + 1 L in the July 1st P/L? Option B Will you see 1 L in the July 1st P/L? Wildcard Will you see only 4 cr in the July 1st P/L? Answer Option B P/L will be reset to 0 at the end of a period! That is why we say P/L is periodic!
  • 4. Balance Sheet - Balance Sheets are not periodic! If Reliance Balance - Debtors - people who owe money to Mr Ambani/ Reliance - 5 Cr as of March 31, 202 on April 1 is 10L. Option A Will it be 5 Cr + 10L? Option B Will it be just 10L? Wildcard Will it be 5 Cr? Answer Option A - it will be 5 Cr + 10 L. just because a period is over, if you owe Reliance money, don’t think that they will forgive the You still owe Reliance money! Cash Flow Statements - a mix of the two. Great cashflow is always good! Bad cashflow can be good/ bad! We will always prefer good cashflow! Who prepares financial statements? Are these all Chartered Accountants? Lets imagine Reliance - who prepares their financial statements? Knowledge Regulation Option A Is it Mr Ambani/ Mrs Ambani/ Ambani Jr? Yes Yes Option B Is it their accountants? Yes Yes Option C Is it their chartered accountants alone? Yes Yes Option D Is it their auditors? Yes NO!!!!! Conflict of Interest!
  • 5. Option E Mr Tendulkar? No Yes Wildcard Any of the above? NO! NO! The knowledge is important, regulation is important! Nothing else is important! Knowledge? Promoters, owners, accountants, chartered accountants - anybody with knowledge and not explicitly barre
  • 6. Why do we need financial statements? Analysis! Who does these analysis? Equity analysts - to decide whether we want to buy or sell? Shareholders - who decide whether their shareholding is worth it Government - to decide if your profit is accurate? Why? Because profit determines how much tax you pay Equity analysts - from a profitability and long term aspect! Shareholder - only till they actually own the shares! Government - only for that particular year. Some other people - employees, clients, etc. Financial statement cycle - the period for which FS are prepared! Quarterly, with consolidation at year end! Q-o-Q analysis (Is Q4 better than Q3?) Y-o-Y analysis (is 2020 better than 2019?) Purpose of analysis -> the actual FS prepared/ reviewed! Who is responsible for the accuracy of these financial statements? We know who prepares these FS! Q - who goes to jail if these FS are wrong? Option A The accountant who prepares! Option B The chartered accountant who is the accountant's boss in the company!
  • 7. Option C Mr Ambani? Option D Yeh Modi Ji! Option E Mr Tendulkar Wildcard Option! The Directors of the Company! Option F? Option G? Answer ! It is the responsibility of both the directors of the company, as well as the auditors! Sathyam Infotech? FS were prepared wrong! The auditors audited it, and said "Brilliant FS"! So people invested in the company, gave loans, etc! What happened after that? Issues with the company! Who went to jail? Both the auditors as well as the directors of the company whi signed on the financial statements went to ja Directors - will sign on the FS! Auditors - will sign on a report that they give saying that FS is accurate! (Auditors Report!) If anything is wrong with the FS -> both auditors as well as the directors will be held responsible? Mandating - made compuslory -> by a lot of laws and regulations - > is called Sarbanes Oxley Act! Responsibility -> is only with the people who sign the FS! What is financial modelling?
  • 8. Lets think about why people join a class in financial modelling? Option A! $$$$$$$$$$$$$$$$$$$$$$$$$$$$$$$$$$$$$$$$$$$$ Lot of money! Option B! Get a job! Option C! Big Bang Theory? Sheldon Cooper? people who just want to know! Option D! Dalal Street guys! Viability of a company! Is this company good? ROCE? ROI? EBITDA? GP NP ratio? Option E! CFA Level 1 - FRA help? CA guys? ICWA/ CS guys? The task of building an abstract representation of a real world financial structure! Building - you create the model! abstract - random - no rules/ regulations followed! Purpose is to understand, review something! Not to be representation of a real world financial structure! It will have the same result/ outcome of a full blown FS, b immateriality! - it matters, but it wont change the way you look at something. Lets take that example of the scene from DDLJ - SRK in the train, and Kajol running to catch it! In the real world, do you think this is possible? Immaterial items - will not impact you as a whole! Material items will!
  • 9. Do we really prepare financial statements or models in excel? Is that what happens in a corporate? There are a lot of other tools, with better protection! Data = gold? Tally! - that helps with FS! Quantrix! - that helps with financial models! SAP - this is an ERP! Enterprice resource planning! Tableau! - very interesting, please google! So it is not always made in excel! But excel is the most convenient! Would definitely encourage taking a look at the other softwares too pos End product might be on a different database - but excel is always used! THE END!
  • 10. General Ledgers - Purchase, Sales, Inventory, Fixed Assets Purchase Ledgers! There are two varities of modelling a ledger - but before we get into it - what is a ledger? it's simple! There are different pathways to arrive at the P/L of a company! That is - when a transaction is executed, it passes through different books of record! For eg - Reliance buys a huge factory outlet for making clothes! Reliance Apparels! (Imaginary!) All of our discussion in financial modelling will be with respect to Reliance Apparel! This is a brick and mortar cloth store (imaginary!) that makes clothes, sells it and makes money! What are we going to do? I'm going to walk you through how Reliance Apparel purchases, records transactions and all we will be modelling some sample transaction for Reliance! We are only going to look at purchase related items for Reliance Apparel! Main books for record! Purchase Ledger / Sales Ledger - > Cash/ Debtors/ Creditors Book -> Trial Balance -> Trading P/L -> Balance Sheet and Cash Flow Statements Purchase Ledger - is to record all purchases! However you want! Accounting rules do not matter in modelling! As long as logical sense prevails! What is covered under a purchase book? Option A Reliance Apparel purchases 100 kgs of wool for stitching purposes! This is one year! So purchase! Option B Reliance Apparel purchases the factory - and when we say factory here - we mean the entire land, building, construction etc.! The factory will l Option C Reliance Apparel purchases some stitching machines for stitching the clothes! Not one year, > 1 year! So fixed assets! Anything that is related to trading! Related to expensing in one year - all of this is going to be called puchases!
  • 11. Anything that can be used for > 1 year - don’t model it as a purchase - model it as a fixed asset! DON’T BREAK YOUR HEAD ON WHAT A FIXED ASSET IS Date Purchased Item Tax Gate Pass No. Amount (CTRL + B = BOLD) ALT + O + C + A Jan 1, 2021Wool 10% MH-4-01012021-102 20,000 TO fit content! Imagine if this item was returned? Date Purchased Item Tax Gate Pass No. Amount Jan 1, 2021Wool 10% MH-4-01012021-102 20,000 Jan 5, 2021Wool - Returns 10% MH-4-01012021-102 -20,000 CTRL + D = The same text as the above cell - don’t forget to drag the ce Modelling purchases - means I am trying to predict purchases in a company! Model Parameter! [1] Imagine Reliance Apparel in the beginning (2021 January!) decides to make only winter clothing! Its main input is wool purchased from local wholesale delaers, and main output is the sweaters it makes under the fancy brand called RA! It makes sweaters only in one color - black! For similar sweater manufacturers, the proportion of wool required per sweater is between 3 kg -5 kg depending on the sweater size! Sweater is made in three sizes - Small, Medium and Large! Mrs Ambani who owns RA - expects to sell 1000 sweaters in 2021, increasing it by 10% every year till 2025. Proportion of sizes for sweaters sold in 2021 - 4:3:3 :: S:M:L What do you have to model? Model the purchase of wool required and show an extract in the purchase ledger assuming in 2024, purchase returns was 10 Answer! Input depends on the output! what is the output? Sweaters! Input? Wool! How many sweaters will depend on how much wool is required ALT + H + A + C 2,021 2,022 2,023 2,024 Center alignment Small Medium Large Small Medium Large Small Medium Large Small Medium Large Sales (No. of Sweaters!) 400 300 300 440 330 330 484 363 363 532 399 399 How much raw material is required?
  • 12. Assume: 3kg for small 3 4 5 3 4 5 3 4 5 3 4 5 4 kgs for medium 5 kgs for large 1,200 1,200 1,500 1,320 1,320 1,650 1,452 1,452 1,815 1,597 1,597 1,997 Purchases 1,200 1,200 1,500 1,320 1,320 1,650 1,452 1,452 1,815 1,597 1,597 1,997 Amount post Purchase Return 1,200 1,200 1,500 1,320 1,320 1,650 1,452 1,452 1,815 1,775 1,775 2,218 Blue Box Explanation - further explanation! Amount of wool needed for making the sweaters in 2024 5,191 Purchase Returns are 10% Which means the amount you need is AFTER purchase returns! 90% of X = 5191 So the amount you need is 90% X 5,768 Total Purchases of Wool made by RA for 2024 90% 10% Amount left after PR PR PR 577 Purchases 5,768 Date Purchased Item Tax Gate Pass No. Qty Jan 1, 2021Wool 0% MH-4-01012021-102 3,900 Jan 1, 2022Wool 0% MH-4-01012021-102 4,290 Jan 1, 2023Wool 0% MH-4-01012021-102 4,719 Jan 1, 2024Wool 0% MH-4-01012021-102 ????? THE END! ???? 5,768
  • 13. Sales Ledgers! F2 - Edit a Cell! Why is it important to project sales or model sales? Revenue is a key part of any business! Cash sales or credit sales - important that we know how much is being sold! No successful business without successful sales! There are two types of revenue growth! 1 Growth in Units Sold 2 Growth in Revenue/ unit! Reliance Apparel (RA) is now going to project their sales for the year 2021! 1000 units of sweaters sold! Only one color of sweaters in - in three sizes! S, M and L! 4:3:3 :: S:M:L How do you know how much to sell/ how much to sell for in order to break even/ make a profit? Breakeven/ profits are a function of costs! And Revenue! Revenue is a function of Units and Revenue/ Unit (Sale price) Revenue = Units * SP If revenue has to increase, either Units have to increase, or SP must increase! Scenario A RA could sell 1000 units at 100/ unit! 100,000 Scenario B RA could sell 1500 units at 70/ unit! 105,000
  • 14. Scenario C RA could sell 2000 units at 35/ unit! 70,000 Why has the revenue dropped in Scenario C? Curve of Maximum Revenue - As Units Increase, this Curve will go up! You price / revenue goes up! But after a point, this curve drops! This inflection point - > the point where the graph changes direction, you should selling! In L Scenario A Maruti produces and sells 1000 Wagon Rs at 7 L/ car! 7,000 Scenario B Jaguar produces and sells 200 Jags at 30 L/ car! 6,000 Scenario C TATA produces and sells 10000 Nanos at 2 L/ car! 20,000 TESLA is the best example! They havent hit their inflection point yet! It means the more they se Till they hit the inflection point! Once they hit the inflection point, they need to reassess their production capabilities! RA! Model Parameter! Reliance Apparel needs our help to understand how much sales actually is required to A Break Even! B Make a 10% profit! Estimated Sales per factory capacity (100%) 10,000 / month Factory has to work at a minimum 60% capacity! Labor rules! Per hour laborers make it clear they need 60% employment per month! Fixed Costs! Factory Rent! 100,000 per month!
  • 15. Variable costs! Labour! 500 per hour Electricity 100 per hour Maintenance includes raw materials 50 per unit Labour utility rate 100 units per hour! (If labour works for an hour, they can make 100 units!) Solution! What capacity means! 100% capacity for RA 30 days per month * 8 hours per month * No of laborers (2 laborer) 100% capacity 48,000 units if we worked 100 % capacity Minimum we need to work 60% capacity At 60% capacity 28,800 Minimum Scenario! 60% capacity 28,800 units Costs Factory Rent 100,000 per month Labour (No. of L * per hour * Hours worked*Rate) 144,000 Labor (60% capacity) Electricity (No. of Hours * Rate) 14,400 Electricity(60% capacity) Maintenance includes raw material (No. of Units * Rate) 1,440,000 Maintenance and raw material Total Cost 1,698,400 (Formula to Sum - '=' + sum or ALR + '+') Cost per Unit 58.97 per unit! Break Even! Zero Proft and Zero Loss! 58.97 per unit! Profit at 10% 64.87 per unit! Maximum Scenario! 100% capacity 48,000 units Costs Factory Rent 100,000 per month Labour (No. of L * per hour * Hours worked*Rate) 240,000 Labor (100% capacity)
  • 16. Electricity (No. of Hours * Rate) 24,000 Electricity(100% capacity) Maintenance includes raw material (No. of Units * Rate) 2,400,000 Maintenance and raw material Total Cost 2,764,000 Cost per Unit 57.58 per unit! Break Even! Zero Proft and Zero Loss! 57.58 per unit! Profit at 10% 63.34 per unit! Fixed Costs will reduce as you produce more! Why? Because it is spread across more units! 100% Cap - Fixed Cost per Unit 2.08 60% Cap - Fixed Cost per Unit 3.47 Diff - due to increase in capacity! -1.39 Diff - in cost per unit! -1.39 Minimum Break Even! 58.97 Maximum Break Even 57.58 Units are not being determined here - only the selling price! Why? We can only model the Selling Price! Units are arrived at based on - 1. Factory Capacity 2. Market conditions 3. Competition 4. Market Size! So safe to assume, we will only model SP! But there are some scenarios when we model Units too!
  • 18. Inventory! It can be of different types - both perishable and non - perishable inventory! Imagine a restaurant- Pizza Hut! Different types of cheese and breads stored! What happens if you story 45 days worth of vegetables at any point in time? It gets spoilt! Storing too much inventory is actually bad, because of costs and spoilage! Your bread and cheese could spoil + you will also be keeping your regrigerator on for a longer time for 45 days! More electricity! More contamination, more rats? Mo More costs! What happens if you story only 3 days worth of inventory? Just In Time process etc Imagine it takes 4 days for your bread delivert to come through once you order! 1 2 3 4 5 6 7 yes yes yes yes yes yes Order No pizza on the 4th day, therefore this is a cost! Too high or too low is not good! We need to maintain just the right amount of inventory! RA! Model Parameter Imagine RA needs 100kg of wool everyday for manufacturing! Most wool is available from Punjab and HP, and taken 10 days to come to Mumbai! RA's factory is in Mumbai! Once wool is purchased, the cost of storing 1kg of wool is 5 Rs/ day! Warehousing cost, security, etc. 100 kg of wool - can make 100 sweaters, each sweater is sold at 1000 Rs. 1 kg of wool - 1 sweater - 1000 Rs.
  • 19. What do I need to find out? Scenario A You keep inventory for 7 days! And you order every 7 days! So basically you order 7 days worth of inventory! Scenario B You keep inventory for 15 days! And order after 5 days! Scenario CYou keep inventory for 10 days! And order is placed on the first day! Answer Scenario A Daily Consumption 100 Daily cost if no inventory 100,000 Daily Cost 500 Days Inventory Level Cost of Maintaining this Inventory Cost if no inventory Total Cost 1 700 350,000 -   350,000 F4 - will keep the cell constant 2 600 300,000 -   300,000 3 500 250,000 -   250,000 4 400 200,000 -   200,000 5 300 150,000 -   150,000 6 200 100,000 -   100,000 7 100 50,000 -   50,000 8 -   -   100,000 100,000 9 -   -   100,000 100,000 10 -   -   100,000 100,000 11 700 350,000 -   350,000 12 600 300,000 -   300,000 13 500 250,000 -   250,000 14 400 200,000 -   200,000 15 300 150,000 -   150,000 2,950,000 Scenario B Daily Consumption 100 Daily cost if no inventory Daily Cost 500 Days Inventory Level Cost of Maintaining this Inventory Cost if no inventory Total Cost 1 1,500 750,000 -   750,000 2 1,400 700,000 -   700,000 3 1,300 650,000 -   650,000 4 1,200 600,000 -   600,000 5 1,100 550,000 -   550,000 6 1,000 500,000 -   500,000 7 900 450,000 -   450,000 8 800 400,000 400,000
  • 20. 9 700 350,000 350,000 10 600 300,000 300,000 11 500 250,000 -   250,000 12 400 200,000 -   200,000 13 300 150,000 -   150,000 14 200 100,000 -   100,000 15 100 50,000 -   50,000 6,000,000 Scenario CDaily Consumption 100 Daily cost if no inventory Daily Cost 500 Days Inventory Level Cost of Maintaining this Inventory Cost if no inventory Total Cost 1 1,000 500,000 -   500,000 2 900 450,000 -   450,000 3 800 400,000 -   400,000 4 700 350,000 -   350,000 5 600 300,000 -   300,000 6 500 250,000 -   250,000 7 400 200,000 -   200,000 8 300 150,000 150,000 9 200 100,000 100,000 10 100 50,000 50,000 11 1,000 500,000 -   500,000 12 900 450,000 -   450,000 13 800 400,000 -   400,000 14 700 350,000 -   350,000 15 600 300,000 -   300,000 4,750,000 Remember - > Lower inventory cost because you don’t sell anything does not mean its good! 7 Day cycle is the cheapest! But just because it is 7 days and we don’t sell for 3 days - there is a chance that you will lose market share! Will you then be able to sell for the remaining days? Because market share is gone! Summary!
  • 21. 2 costs for inventory! 1 Costs of maintaining invenotry - warehousing, storage costs etc. 2 Costs of not maintaining inventory - opportunity costs, loss of market share etc. You need to model both costs when you look at inventories! Do not forget! THE END!
  • 22. Fixed Assets! What are fixed assets? Two types of assets - inventory, and fixed assets! Inventory is something you buy to sell! Purchase and sale of inventory happens in the same period! Fixed Assets - are purchased not for sale but for use in order to get a better output! For eg - IT companies - computers, desks, tables, chairs, etc. Manufacturing - machinery, plant, etc. Software companies - software used for coding etc. What is the issue with modelling for fixed assets? A fixed asset -eg. Air Conditioner - can be used for max 10 years! what will you write off in order to bring the asset value to zero ? Air Conditioner is purchased for 1L. 2021 - 1L 2031 - 0 Option A You will bring it to 0 in 2031 PL - meaning you will reduce the entire 1L in 2031. Option B You will bring it to 0 in 2021 PL - meaning you will reduce the entire 1L in 2021. Wildcard You will bring this to 0 evenly over a particular range of years - this range is determine by the life of the asset! Wildcard option - is the right answer! You cannot write off the fixed asset in a single year because its not fair! Regulations have clearly said that fixed assets have to be written off across the life!
  • 23. Fixed Assets Date Asset Name Amount 2021 Computer 1L 2021 Depreciation for 2021 -10K 1L / 10 = 10K! 2021 Closing Balance 90K Profit and Loss A/C Date Particulars Amount 2021 Depreciation Cost on Assets 10K If a fixed asset is depreciated to 0, does it mean you have to throw it off? NO! You can continue using it! No problem! Just that the extra years you use it, there will not be any depreciation charged. Why? Because the FA is already at 0! Is depreciation causing any cash flow movement? Meaning - will you pay 10K to someone every month/ year? NO! Depreciation is a notional cost! Summary Initial Cost > Inventory! Never written off in the same year, written off over a lot of years! The write off is called depreciation, and is notional! Profit and Loss A/C Wool Purchased 390,000 Sweaters Sold! 2,764,000 Profit 2,374,000 2,764,000 2,764,000 Balance Sheet Fixed Asset xxx
  • 24. Reserves and Surplus 2,374,000 Inventory xxx THE END
  • 25. Capital Balance Sheet Amount Bold - CTRL + B Capital and Liabilities Capital - Authorized Share Capital xxx Capital - Issued Share Capital xxx Capital - Allotted Share Capital xxx Capital - Called up/ Paid up Share Capita xxx Preference Share Capital xxx Authorized Share Capital! This has no impact on your financial analysis! Why? It is only for disclosure purposes! Maximum amount of capital the company is allowed to issue! If auth share capital is 1L, company is issuing 1.5L, something is wrong! Issued capital - how much the company actually issues <= Authorized share capital! it can never ever be more! Allotted share capital! It is the actual amount allotted as capital to investors! Allotted <= issued share capital! Called up and paid up - amount called up and paid up called up and paid up <= allotted share capital Auth Cap >= Issued Cap >= Alloted Cap >= Called up and paid up Cap Control Check! Formula to make sure there are no fat finger errors! fat finger error - is when you type random numbers because you are not on a diet = fat
  • 26. Balance Sheet Amount Control Check - only for chec Capital and Liabilities Capital - Authorized Share Capital 100 TRUE Capital - Issued Share Capital 100 TRUE Capital - Allotted Share Capital 100 TRUE Capital - Called up/ Paid up Share Capita 100 Model Parameter RA has total authorized share capital of 10 L. RA wants to issue 8.5L of capital, but gets applications for 1.5x times the capital issued! RA allots 100% of the issued capital, and calls up the entire amount immediately. All of this happens in 2021. In 2022, RA wants to issue a further 1.5L of capital, and get 2.5x the applications for this amount. RA allots the entire 100% of issued capital. In 2023, RA wants to call back 10% of its total issued capital at 100% the FV. Do not worry about how/ w What do you need to do? Prepare the 2021, 2022 and 2023 capital parts of the BS with adequate control checks! Make sure - these checks are tested out! Answers 2021 ALT + H + A + C - Center aligned Balance Sheet Amount Notes Capital and Liabilities Capital - Authorized Share Capital 1,000,000 Capital - Issued Share Capital 850,000
  • 27. Capital - Allotted Share Capital 850,000 1.5x the application received - 8.5L*1.5 9.35 -0.85 has to be refunded to the ap Capital - Called up/ Paid up Share Capita 850,000 Checks TRUE TRUE TRUE 2022 Balance Sheet Amount Notes Capital and Liabilities Capital - Authorized Share Capital 1,000,000 Capital - Issued Share Capital 1,000,000 2021 - 8.5 + 2022 - 1.5 = 10L Capital - Allotted Share Capital 1,000,000 2021 - 8.5 + 2022 - 1.5 = 10L Capital - Called up/ Paid up Share Capita 1,000,000 2021 - 8.5 + 2022 - 1.5 = 10L Checks TRUE TRUE TRUE 2023 Balance Sheet Amount Notes Capital and Liabilities Capital - Authorized Share Capital 1,000,000 Capital - Issued Share Capital 900,000 10L issued - 10% of 10L called back = 9L Capital - Allotted Share Capital 900,000 10L issued - 10% of 10L called back = 9L Capital - Called up/ Paid up Share Capita 900,000 10L issued - 10% of 10L called back = 9L
  • 29. Cash Cash is an asset for any company! How much cash is held depends on the kind of company! Let us look at some examples - if you are modelling restaurants - cash will generally be high/ low dependant on the type of restaurant! Chaat shop - cash is high! Marriott ka restaurant - cash is low! Just because cash is low, does not mean the restaurant is bad! Just because cash is high, does not mean the restaurant is super profitable! Profits and cash are two sides of the same coin! When I say cash - I am talking about notes, coins etc. Cash equivalents - cheques, debit cards, credit cards etc. Can we think of an industry that is low on cash? That is, no cash more credit? automobile industry! manufacturers! A lot of manufacturers, produce cars/ manufacture cars - give it to the retailers and are paid only after the retailers sell the cars! Maruti -> Maruti Udyog ! Maruti also has suppliers - seats, seat covers, brake shoes, steel etc. who will be supplying on credit. Balance Sheet Amounts Capital and Liabilities xx Assets
  • 30. Fixed Assets xx Current Assets xx Cash and Cash Equivalents xx Cash - Notes, Coins etc. Cash Equivalents - Sodexho, Cards etc. Tree Based Reg requirements T Based 12th grade CBSE balance sheet Model Parameters Model A - TESLA! Order: $1M This is for all TESLA cars put together in $$$ value! Production 10% $100K! Revenue 100$ of Production $100K! Credit/ Cash Mix! 50:50 $50K Realized! Balance Sheet Assets Cash and Cash Equivalents 50,000 Model B - Pizza Hut! Order: $100k Production $100K Evertyhign that is ordered for in the restaurant is produced and sold! Nobody 3 months! Revenue: $100K You get paid for everything you sell - no credit payments at pizza hut! Is a cre NO! When you use a credit card - you get paid immediately by the bank! Which means, the moment you use a card it is a credit for the customer and c
  • 31. Credit: Cash Mix: 0:100 You realize the entire amount that you sold the pizzas for! Balance Sheet Assets Cash and Cash Equivalents 100,000 Question! If you are an investor! Which company will you invest in? Will the answer be TESLA or Pizza Hut? Pros and Cons! Pros Cons TESLA - Order Book Higher Order Book Not a con TESLA - Production No pro They are not able to produce PH - great cash flow! Great cash flow Not a con Potential? Not great! Summary! What is the linkage to cash? Modelling cash is important - no doubts about it! Cash flow is super important! Any gov company in India - cash flow is the prob - great profits sometimes but not great cashflow! BUT! Look at more than just the cashflow! Look at the bigger picture! Do not think cash flow is everything! THE END!
  • 32. Sundry Creditors If you make a purchase, and you don’t give cash - you have to record the fact that you didn’t pay for the purchase! That 'owing of money' is called having a sundry creditor! This is usually a term used to define trade creditors! So who are sundry creditors for most companies? Restaurant bread purchase supplier, wheat supplier, rice supplier etc! IT Companies Computer sales supplier, software supplier etc. Manufacturing Companies Cloth supplier, wool supplier, thread supplier etc. Service Sector - Uber? Driver - Uber, Uber - banks, car suppliers etc. Real Estate/ Construction! Consturction material supplier like cement, sand etc, labour supplier etc. In your balance sheet, where will the sundry creditor sit? Balance Sheet! Liabilities and Capital Capital Equity Capital Prefererence Capital Liabilities Long Term Liabilities Short Term Liabilites Sundry Creditors Greater than 6 months Less than 6 months Assets
  • 33. Indenting! When you draw up a BS in a financial model, make sure you left/ right indent accurately. Why is that important? If you don’t indent, what happens is that your liabilities, assets and in our example, >< 6 months will al Is that correct? NO! Your greater than/ less than 6 months, is technically not a part of the BS, but a part of the Sundry Cre is a part of liabilities, which is a part of Capital and Liabilitie, which is a part of the BS ! Your model for sundry creditors depend a lot on your expenses! If expenses are high, sundry creditors COULD also be high! If expenses are low, sundry creditors COULD also be low! If no expenses, NO SUNDRY CREDITORS! Why am I saying COULD? why is it not SHOULD? Scenario 1 - you own a chaat shop in the main road! Expenses - electricity, pani puri, sev, papdi, curd, etc Road side! YOU WIL Scenario 2 - you own Haldirams. Bikanerwala! Expenses - electricity, pani puri, sev, papdi, curd. Shop in a mall! BIG BRAN To model creditors, you need to know two thing! Thing 1 You need to know how much expense was incurred for the creditor that you are modelling! Thing 2 You need to know the proportion of expense that is actually payable after paying in cash! Model! Sundry Creditors for 2021 = Linked to Expenses Multipled by Proportion!
  • 34. Model Parameter Reliance Apparel purchases 100 kgs of wool on a yearly bases for making their sweaters. This wool is purchased at 100/ kg and you get a discount Model RA's creditors assuming they purchase bare minimum amount to avail the discount! Assume 2022 and 2023 purchases will increase by 10% Out of total Sundry Creditors - 50% payable in 6 months, and the rest before a year. Multi-period model - keep periods in columns, and everythign else in rows! 2021 2022 2023 Expenses 10,000 11,000 12,100 Proportion Amount payable after discount and advances Advance 1,000 1,100 1,210 Amount Payable after Advance 9,000 9,900 10,890 Discount 900 990 1,089 Amount Payable after Advance and Disco 8,100 8,910 9,801 Sundry Creditors 8,100 8,910 9,801 2021 2022 2023 Liabilities Long Term Liabilities Short Term Liabilites Sundry Creditors 8,100 ALT + H + H + N Greater than 6 months 4050 4455 4900.5 Gets rid of colors Less than 6 months 4050 4455 4900.5 THE END!
  • 35. Sundry Debtors Who are sundry debtors? And why are they recognized on our B/S? High SD - good or bad? People who owe money to you! Why? Because you provided them some sales or service! Why ar ethey recognized? Because anybody who is analysing a company - would have only taken a look at the P/L. When you make a sale/ service - you recognize it in the P/L - but how much was it actually received? Reliance Apparel sold 1 Cr worth of sweaters to Kingfisher Airlines! RA - recognized a P/L of 1 cr for this sale! But…. Whom did they sell to? To Kingfisher! What does that mean? Did they receive cash or not? NO! Why? Because Mr Mallya! He doesn’t pay! Your P/L looks as good as gold! But is worht nothing - because you wont receive any money for it! Very important - debtors are being analysed! Creditors - purchase/ expenses! Debtors - revenues/ sales! Industries! L/T Power Transmission! Governemnt - power bodies! IOCL! petrol bunks! Restaurant - have no S/D Why? Because there is no credit transaction! Reliance Apparel retailers - who will buy from RA, and sell to the ultimate consumer! How are credit terms usually arrived at for sundry debtors?
  • 36. 2/24 2% discount, if you repay within 24 days/ months 5/12 5% discount if you repay within 12 months! Balance Sheets! Capital and Liabilities Capital Liabilities Assets Fixed and Long Term Assets Current and Short Term Assets Cash Sundry Debtors Less than 3 months NEVER forget to Indent! Greater than 3 months Sundry Debtors -> Revenues and Sales! Model Parameters Reliance Apparel - they have sales targets of 1,500 units sold per day! They expect this target to go up by 10% in the second half of the Expected value of sales is 500/ sale! They also expect to realize 10% as advance, 10% in three months and the rest in 6 months. In case this is not paid within 6 months, a pe is due! Calculate using financial modelling - how you can forecast the year end Sale Value, Cash Realized and Sundry Debtors! Answers Particulars 2021 - First Half2021 - Second Half Sales per day 1,500 1,650 Days in 6 months 180 180 Sales for 6 months (in units) 270,000 297,000 Sales Value per Unit 500 500
  • 37. Total Sale Value 135,000,000 148,500,000 End of Year Sale Value 283,500,000 Volume Driven Business - better sales because of more units sold, not because of high Cash Realized Calculation Advance Realized 10% Amount Realized as Advance 28,350,000 Three months Installment! For all periods except sales made from Oct 1 We are preparing FS for Jan - Dec - so any sale made 3 months before Dec will be realized (10%), but if made after Oct 1, high chance t 3 Months Installment 20,925,000 (First 6M Sales Value x 10%Rec'd) + (Second 6M Sales Value x 10%x 50% ) Six Months Installment! For all periods except sales made after July 1 We are preparing FS for Jan - Dec - so any sale made 6 months before Dec will be realized (80%), but if made after July 1, high chance 6 Months Installment 108,000,000 (First 6 M x 80% ) + (Second 6M * 0% ) Cash 157,275,000 Debtors First 6 months - no debtors! Why? Completely rec'd as cash! Second 6 month - debtors First 3 months - debtors - 80% - 10% adv + 10 FI paid Second 6 months - debtors - 90% - 10% adv paid Sundry Debtors 126,225,000
  • 38. Sales Value 283,500,000 Cash 157,275,000 Debtors 126,225,000 Diff - bad debts -0 Control Check THE END
  • 39. Trial Balance Any financial model - Mix of Accounting + Excel! 1 What is a trial balance? 2 What constitutes a trail balance? Basically, what forms a part of it? 3 What are debit balances and credit balances? 4 How do you link items in a trial balance? 5 Models on Reliance Apparel's Trial Balance What is a trial balance? Basically, it is a list of all ledgers in a single place! Ledgers - ledger balances! Why do we need to put all ledger balances in a single place? It will tell you if all your debits and credits - two sides of any entry! Are accurate! If you miss any one side, or if the entry is posted to a wrong account, it will throw an error! Closing balance of all ledgers - will be in the TB! Where will the opening balance be? In the ledger! What constitutes a trial balance? There will be a particulars column! This column will have all the ledger names! There will be a Debit Amount column - all debit balances will be on this column against the ledger name There will be a Credit amount column - all credit balances will be on this column against the ledger nam There will be totals for both the debit and credit column! Your debit total must be equal to your credit total!
  • 40. My favourite? Checks! This is only if you are doing it on an excel! Checks Formula Check 1 - Debit total should be equal to credit total! IF Formula Check 2 - a single ledger can have only a debit balance or a credit balanc IF formula Check 3 - ensure ledger balance is carried forward accurately to TB IF formula Trial Balance Amount Ledgers Amount Purchase/ Sales Ledger Purchase/ Sales Ledgerxxx Creditors/ Debtors Ledger Creditors/ Debtors Ledgxxx Fixed Assets Fixed Assets xxx Cash Cash xxx Liabilities Liabilities xxx To record all initial transactions! To ensure transactions are r Explosion Databse or Explosion Workflow! Option 1 I will updated all ledgers on a daily basis, as and when transactions happen, and then update to TB at e Option 2 I will update all ledgers on a daily basis, as and when transaction happen, and simultaneously the TB w ledger is updated Option 2 is the answer, it is called an explosion workflow! All of your databases are updated simultaneously! THE END
  • 41. Trial Balance What are debit and credit balances? Every ledger has soemthing called a debit or a credit balance! RULE OF LAW! Whenever a ledger has more debit items than credit items, it is called a debit balance. Assets - Debit Revenues - Credit Whenever a ledger has more credit items than debit items, it is called a credit balance! Liab - Credit Expenses - Debit Ledger D/C Purchase Ledger D Sales Ledger C Capital ledger C Cash Books D Inventory D Fixed Asset D Sundry Debtors D Sundry Creditors C Loans C Security Premium C Salary A/C D Expense A/c D Purchase Return C Sales Returns D Depreciation D In B/S, it is a reduction from Assets, therefore has the same sign as Assets have - D In P/L they are expenses, therefore D. Trial Balance Ledger Debits Credits Transactions - Model Parameters Purchase Ledger 50,000 1 Mukesh Ambani has started a new company called Relian Sales Ledger 50,000 2 Assume Mr Ambani wants to invest another 1L next month
  • 42. Capital ledger -   200,000 3 With the money in cash, Reliance Apparel wants to purcha Cash Books 200,000 -   4 They sold the wool for the same 50,000 to someone else. Inventory -   Fixed Asset Sundry Debtors Sundry Creditors Loans Security Premium Salary A/C Expense A/c Purchase Return Sales Returns Control Check Total 250,000 250,000 -   GOOD BOY Ledger Capital Ledger Debit Credit Particulars Amount Particular Amount Capital Invested 100,000 Second Investment 100,000 Control Check Total -   Total 200,000 200,000 GOOD BOY Cash Ledger Debit Credit Particulars Amount Particular Amount Capital Invested 100,000 Purchase of Wool - Cash Paid 50,000
  • 43. Second Investment 100,000 Sale of Wool 50,000 Control Check Total 250,000 Total 50,000 200,000 GOOD BOY Purchase Ledger Debit Credit Particulars Amount Particular Amount Wool Purchased 50,000 Control Check Total 50,000 Total -   50,000 GOOD BOY Inventory Ledger Debit Credit Particulars Amount Particular Amount Wool Purchased 50,000 Sale of Wool 50,000 Control Check Total 50,000 Total 50,000 -   GOOD BOY HOLD ON TO THE TRADING P/L CALC I AM DOING HERE, JUST IMAGINE YOU UNDERSTAND, YOU WILL GET IT WHEN I DO TRADING P/L IN THE NEXT CH Sales Ledger Debit Credit Particulars Amount Particular Amount Sale of Wool 50,000 Control Check Total -   Total 50,000 50,000 GOOD BOY
  • 45. Trading A/c 1 What is a trading A/c? 2 What forms a part of your trading account? 3 What is gross margin? 4 Sample of a trading account. 5 Trading account under the explosion infrastructure! What is a trading A/c? A trading to is to quantify our profits at a trade level. Which means it will only look at revenues from trade, and expenses incurred with respect to a trade! The net amount from a trading account is either called a gross profit or a gross loss! If your revenues > expenses -> gross profit If your revenues < expenses -> gross loss. What happens to this gross profit or gross loss? It gets carried forward to the P/L A/c Trading A/C is not mandatory! This information, if required can be incorporated in a Profit and Loss A/c. What forms a part of your trading P/L! Only expenses related to a trade can form a part of your trading A/C Trading A/c or P/L A/c Sales of goods Trading A/C Direct linkages Cost of goods sold Trading A/C Direct linkages salaries to admin staff Profit and LosNo direct linkage to sales made. salaries to plumber Trading A/c o If the plumber is directly involved in the production process - Trading A/c, if he is like a head office plumber - P salaries to factory workers Trading A/C Direct linkages electricity to factory office Trading A/C Direct linkages
  • 46. electricity to head office Profit and LosNo direct linkage to sales made. rent for factory Trading A/C Direct linkages rent for head office Profit and LosNo direct linkage to sales made. Petrol/ Diesel for factory Trading A/C Direct linkages Machinery rental Trading A/C Direct linkages Furniture rental Profit and LosNo direct linkage to sales made. What is a gross margin? GM/ GP - is nothing but the profit you make on sales, without considering your extra overheads. If a company has great GP - it means their core business is viable! It means you are doing really well - your business is profitable, and you should continue doing this business! If GP is bad - it means there is something wrong with yoru business model! Amazon! Can never have a negative GP! Why? They buy from wholesalers and sell to retailers, but don’t owe anything to the wholesalers until they make Cloudtail! Whenever you analyse - always look at GP to ensure business is good/ viable! Therefore - your trading A/c is an improtant area for you to analsye! Sample of a trading account. Debit Credit M&C ALT + H + M + C Particulars Amount Particulars Amount
  • 47. All Cost of Goods Sold xxx All Revenue Items - Sales/ Service xxx Electricty xxx Rent xxx Total -   Total -   if Debit side is heavier - more expenses than revenue - Gross Loss! If Credit side is heavier - more incomes than expenses - Gross Profit! Trading A/c under the explosiion infrastructure! Whenever there is a trade doen, either purchase or sell - you need to update the Ledger, TB as well as the Trading Accoutn immediately! Put necessary checks in place! Also make sure this is formula driven! You should only touch the ledger! All other accounts should pick up numbers from there and flow it through with formulas! THE END
  • 48. Profit and Loss A/c 1 What is a P/L? 2 What gets captured within the P/L A/C 3 What is Net Proft/ Net Loss. 4 What does High NP, but Low GP or Low NP and High GP mean? Analysis! 5 Modelling P/L - how to incorporate the entire explosion infrastructure within the P/L workflows! What is P/L? P/L is nothing but a total of all revenues earned by the firm, minus all expenses incurred by the firm. This is an expansion of the Trading A/C - under Trading we only saw trade related revenues and expenses - under P/L we will see all revenues and The first starting point in a P/L is the ending point of a Trading A/C All trade related revenues and expenses - trading account You will get the gross profit or gross loss
  • 49. Start making your profit and loss account with the starting point as gross profit or gross loss! Add all your non trading expenses and revenues Net profit or Net Loss Rule! All revenues items/ expense items will only be added once - either in the trading account or in the P/L account Never add it in both Rule! Not necessary that you need to prepare a separate trading account and a profit and loss account You can combine both …..but! You will not show GP in that case - you will only see NP! What gets captured within the P/L A/C
  • 50. Anything that is not factory related - P/L Anythign that is not production related - P/L Depreciation - P/L Anything that is financing related - P/L What is Net Proft/ Net Loss. Net profit = All revenues minus all expenses. If revenues > expenses - net profit! If revenues < expenses - net loss! Revenues will include brought forward Gross Profit! Expenses will include brought forward Gross Loss! What does High NP, but Low GP or Low NP and High GP mean? Analysis! NP GP What does it mean? 1 High High It means the company is doing really well! Trade/ business model is good, and related expesnes are low 2 High Low Low GP means business model is questionable, but high NP means you are making revenues from othe 3 Low High High GP means business model is great. But low NP, means your ancillary expenses are eating into your 4 Low Low it means your business model is bad, needs improvement - and your net profits are also suffering becau Modelling P/L - how to incorporate the entire explosion infrastructure within the P/L workflows! Debit Credit
  • 51. Particulars Amount Particulars Amount Gross Loss B/D xxx Gross Profit B/D All Non-Revenue related expenses xxx All Non-Revenue Items - Sale of Furniture, Sale of Machinery, etc. xxx Dep on Furniture xxx Rent Received xxx Rent on offices xxx Salary Paid xxx Total -   Total -   Example! Trading A/C Debit Credit Particulars Amount Particulars Amount Sales 15.00 Gross Profit 5.00 Expense 1 10.00 Gross Loss -5.00 Gross Profit 5.00 Gross Loss -   Control Check Total 15.00 Total 15.00 GOOD BOY Profit and Loss A/C Debit Credit Particulars Amount Particulars Amount
  • 52. Gross Loss -   Gross Profit 5.00 Gross Profit 5.00 Gross Loss -5.00 Net Profit 5.00 Net Loss -   Control Check Total 5.00 Total 5.00 GOOD BOY THE END
  • 53. Balance Sheet 1 What are Balance Sheets? What are the two different aspects? 2 What accounts come under which aspect of the Balance Sheet? 3 Indentation, Alignment and Formatting! 4 Explosion Infrastructure for Balance Sheets! 5 Modelling Balance Sheets for the future - forward looking Balance Sheets! What are Balance Sheets? What are the two different aspects? Balance Sheets are period to date information, where the period starting is when the company went live! Company was launched in 1998 - B/S date is 2021….. Your sundry debtor balance is the balance as of 2021, but considered from 1998! In the P/L. when your year ended, all the numbers were reset to 0. You CANNOT DO THAT with a BS. Balance Sheet numbers are carried forward to the next period, and the period after, so on and so forth. If your Sundry Debtors as of Dec 31, 2020 10L which means as of Dec 31, you have to receive 10 L from If your Sundry Debtors as of Dec 31, 2021 0 What does it mean? It means 1 All 10L was paid up, tand no further de 2 Or no paid up, all debtors became bad Balance Sheets - T type Balance Sheet Liabilites Assets Particulars Amount Particulars Amount
  • 54. Total -   Total -   Horizontal Balance Sheet Assets xxx xxx xxx xxx xxx xxx xxx Liabilities x x x But what are the aspects? Capital and Liabilities are bunched together. Why? These are amounts owed by the company to external people - creditors, p Assets are bunched together - these are amounts owned by the company or owed to the company by external ppl - Fixed Ass What accounts come under which aspect of the Balance Sheet? 0 I Liabilities and Capital
  • 55. 1I Capital 2I Equity Capital 3I Authorized Capital 3I Subscribed Capital 2I Preference Capital 1I Liabilities 2I Long Term Liabilities 3I Loans and Borrowings 3I Sundry Creditors 2I Short Term Liabilities 3I Sundry Creditors 3I Handloans Total xxx 0I Assets 1I Fixed and Long Term Assets 2I Fixed Assets 2I Investments 1I Current and Short Term Assets 2I Cash 2I Sundry Debtors Control Check Total xxx GOOD BOY Indentation, Alignment and Formatting! Indentation It is how you put values inside a cell! if I say indent it, it means you need to make sure all cell wise data is Alignment It is how difference cells put together are set up! If I say align it, you need to make sure all cells are accurate!
  • 56. Formatting Is putting bold, underline, etc. Shortcut keys Indenting ALT + H + 6 For a single indent - repeat if you want multiple indenting to the right. For left, use 5 instead of 6 Alignment Copy + paste is your best option - CTRL + C, or CTRL + V. But if you want to try something fancy, go ahead. But recheck form Center, left, Right Align ALT + H + AC/AR/AL For Center, AC, For Left, AL and for Right, AR. Formatting Color Fill ALT + H + H + Color Color - whichever color you want, no color, type N Underline CTRL + U Bold CTRL + B Font ALT + H + FF Type font name that you want! THE END
  • 57. Explosion Infrastructure for Balance Sheets! Trying to make sure one entry to a ledger - updates the Trial balance, Profit and Loss Account and the Balance Sheet simultaneously. Model Parameters Welcome back to modelling Reliance Apparel! We are now going to look at different transactions in Reliance Apparel and see how this is carried forward and recorded in different financial statements - or in your books of accounts! Let us assume from the beginning that Reliance Apparel is actually just going to be launched by Mr Ambani! 1 Capital Introduction - Mr Ambani invested 1L in Capital in Reliance Apparel. 2 Loan Taken - 5L from Bank 3 Raw Materials Purchased from Suppliers for Cash - 1L Capital Account Debit Credit Particulars Amount Particulars Amount Invested Capital 100,000 Total Control Check Total -   Total 100,000 100,000 Awesome!
  • 58. Cash Account Debit Credit Particulars Amount Particulars Amount Capital Invested 100,000 Raw Material Paid 100,000 Loan Received 500,000 Control Check Total Awesome! Total 600,000 Total 100,000 500,000 Trial Balance Ledger Account Debit Credit Capital 100,000 Cash 500,000 Loan 500,000 Purchases 100,000 Total Control Check Total 600,000 600,000 -   Awesome!
  • 59. Trading and P/L Account Debit Credit Particulars Amount Particulars Amount Purchase of RM 100,000 Gross Profit -100,000.00 Gross Loss 100,000.00 Gross Profit -   Gross Loss 100,000 Total Control Check Total 100,000 Total 100,000 -   Awesome! Balance Sheet Liabilities and Capital Assets Particulars Amount Particulars Amount Capital Fixed Assets Equity Capital 100,000 Reserves and Surplus -100,000 Liabilities Long Term Liabilities Current Assets Loan from Banks 500,000 Cash 500,000
  • 60. -   Total Control Check Total 500,000 Total 500,000 -   Awesome! Loan Account Debit Credit Particulars Amount Particulars Amount Loan Taken from Bank 500,000 Total Control Check Total -   Total 500,000 500,000 Awesome! Purchases Account Debit Credit Particulars Amount Particulars Amount Raw Materials Purchased 100,000 Control Check
  • 61. Total Awesome! Total 100,000 Total -   100,000 THE END
  • 62. Future Looking Statements - Sales, Purchase, Inventory and Fixed Assets! What we have done till now - is show how a present recording of financial transactions can be modelled on an excel! If we make 1 transaction, we have seen the effects of that transaction in our ledgers, P/L, Cash flows and in the Balance Sheet! Our explosion infrastructure will be able to capture all of these transactions - as long as they are in the present and as long as the model is set up ac But…. what about future transactions, what if you are asked to make predictive models? What are predictive models? A predictive model will tell you what the present is, and you will have to make assumptions about the future and incorporate the same in your model! It majorly uses data and statistics! Reasonable assumptions will have to be backed up by industry standards, as well as data analytics. Let us take 4 basic items first and see how to make forward looking models for these items! 1 Sales 2 Purchase 3 Inventory 4 Fixed Assets Sales - we know what sales is dependent on! Units sold x Value per unit! Units X Sale Value/ Unit sales numbers will go up - if units sold increase, and SVPU (Sales VALUE PER UNIT) remains constant. sales numbers will go down - if units sold decrease, and SVPU is constant sales value will go up - if units sold are constant, but SVPU increases sales value will go down - if units sold are constant, but SVPU decreases Why will units sold increase? 1 increase in demand from customers - eg. JIO 2 better product - eg. Iphones
  • 63. 3 cyclical reasons - eg. More mangoes in the summer, more Acs in the summer, etc. Why will units sold decrease? 1 decrease in demand from customers - eg. IDEA/ Vodafone 2 bad product - eg. Motorola 3 cyclical reasons - eg. less mangoes in the winter, less Acs in the winter, etc. SVPU - increase/ decrease 1 more competition - when a new restaurant opens up in the market, your prices are usually cheaper. 2 cost of RM - economies of scale. Model Parameter We are RA! We have just started the business in 2021 - the plan is to expand to more regions in 2022, but we are not sure if we can increa In 2024, we will bounce back but not entirely, and 2025 levels will be back to 2021 levels. You are free to make assumption to make sure yo Formulas for Units 1 1.1 0.9 0.95 1 Formulas for SVPU 1 1 1 1 1 Year 2021 2022 2023 2024 2025 Assumption None - Given Units will change - 10% Units will change - 10% Units will change - 5% Back to 2021 levels Sales Units 1,000 1,100 900 950 1,000 SVPU 150 150 150 150 150 Total Sales 150,000 165,000 135,000 142,500 150,000 750 1,000 1,250 Sales Units SVPU
  • 64. Purchases - will be driven the same things that drive sale! Competition Market conditions Cycles Raw Material costs for the suppliers, etc. DIY! Try to model purchases for RA using the same assumptions we used and having a 10% profit margin for the supplier! THE END - 250 500
  • 65. Cash Flow Statements 1 What is a cash flow statement? 2 what are included within a cash flow statement? 3 Two types of preparing cash flow statements. 4 Explosion Infrastructure will function with respect to a cash flow statement. 5 Predictive Modelling on Cash Flows - how forward looking cash flow statements can and should be prepared. What is a cash flow statement? A cash flow statement is a key part of your financial statements, along with PNL and Balance Sheet! This will only track cash moves in and out of the company! Which means - if there are non-cash moves in a company, this will not be tracked by a cash flow statement. We need to make sure we model cash flow statements for only cash moves, this will help readers of the financial statement to decipher how much of the activity has been cash-impacting and how much is non-cash. Anyone analysizing financial statements will want to know how much of the sales/ business you made were in cash/ realized cash? Therefore, everyone will take a look at cash flow statements. What all is included within a cash flow statement? We include all cash related items. Non cash related items are excluded! All items that realized cash, irrespective of whether this was financing, investing or operating will be included. Operating - general business! Financing - to get money for running the business - loans, issung debentures etc. Investing - to make more money with the money we make. Two types of preparing cash flow statements. Direct Method - Indirect Method - The net result of both methods is to say that Opening Cash balance + Activities during the year - Closing Cash balance = 0. Direct Operating Activity +/- Only cash related operating activites are included. So any cash purchase, cash sale, cash paid, cash recd, Investing Activity +/- Only cash invested, and cash de-invested. Financing Activity +/- Only cash rec'd as loan, or cash debt raised or cash repayments will be included. Opening Cash +
  • 66. Closing Cash -   1 Purchase made for 100 Rs, out of which 70Rs paid in Cash - Only 70 Rs paid in cash will be included in the direct cash flow statement. 2 Sales made for 150 Rs, out of which 120 Rs paid in cash - only the 120 rs that you paid in cash will be incldued within your direct cash flow statem 3 Rec'b for good sold, paid us 100 Rs - you will include the entire 100 Rs. 4 Payable for purcases - we paid 50 Rs - you will include the entire 50 Rs. Beginning Debtors 100 Ending Debtors 20 How much wil you include in cash? 80 assumed to have been realized in cash Investing activity - 1 We rec'd a stock dividend of 500 shares - wll you include or not? NO! This is not cash related, so should not be included! 2 We rec'd a cash dividend of 10K rs. - YES, since this is cash related! 3 We invested 15K in cash. - Yes, to be included since this was investment in cash! 4 We invested in an options contract for 1 L, by paying a premium of 1000 Rs. - Your actual cash outflow/ inflow is only 1K. Not 1L, therefore include 5 We redeemed out of an ETF investment for 1 L. - just a simple 1L included, since you will receive cash when you redeem out! Financing - 1 All interest payments. 2 All loans taken (as long as this is in cash) 3 All loans repaid. 4 Further issue of equity - include or not? YES! Because you are receiving cash against this issue of equity. Indirect Method Operating Activity Net proft Minus all non cash activities in net profit Total Operating activity Investing Activity +/- Financing Activity +/-
  • 67. Opening Cash + Closing Cash -   What will you minus as non-cash? Depreciation, any moves in debtors/ creditors, etc. Model for Indirect Method! Because this is the most frequently used, and is also easier because all your items are included already, you only need to back out! Particulars Amount Amount Commentary Operating Activity Net Income xxx Add: Non Cash Items Depreciation xxx No cash, added back Increase in accounts rec'b xxx This signifies an increase in debtors - so no cash was rec'd Decrease in payables xxx This signifies a decrease in creditors - so no cash was paid Total Operating Activity xxx Sum of NP + Add backs Financing Activity Financing Inflows xxx Financing Outflows xxx Total Financing Activity xxx Investing Activity Investing Inflows xxx Investing Outflows xxx Total Investing Activity xxx Total Cash from Activities xxx Inv + Fin + Op Total Cash Beginning xxx From Opening BS
  • 68. Total Cash Ending xxx From Closing BS Control Check xxx THE END
  • 69. Inventory - different models of inventory! 1 HIFO - Highest in First Out 2 LIFO - Last In First Out 3 FIFO - First In First Out For a storekeeper model, how will you decide which inventory has to go out if one of the above is followed? HIFO - Highest In First Out - the costliest inventory should first be used for sales purposes. If you have 10 different items in your warehouse, and all 10 items are different costs of procurement. HIFO will tell Why? Profits are reduced, therefore tax is reduced. Inventory Ledger Date Inventory Detail Units (KG)CostAmount Units (KG) 10-Jan-20 Wool 100 150 15,000 100 11-Feb-20 Wool 100 250 25,000 100 17-Mar-20 Wool 100 650 65,000 100 21-Feb-21Wool 100 700 70,000 100 24-Feb-21Wool 100 550 55,000 100 30-Mar-21 Wool 100 480 48,000 100 600 278,000 600 Under HIFO You are asked to sell 120 KGS for 600 Rs/ KG Units Cost 100 700 70,000 600 60,000
  • 70. 20 650 13,000 600 12,000 120 83,000 72,000 Net Profit - Loss of 12K. Under LIFO You will sell whatever came in last, first! Why? So when petrol is pumped into an underground tank, the petrol you pumped petrol. Date Inventory Detail Units (KG)CostAmount Units (KG) 10-Jan-20 Wool 100 150 15,000 100 11-Feb-20 Wool 100 250 25,000 100 17-Mar-20 Wool 100 650 65,000 100 21-Feb-21Wool 100 700 70,000 100 24-Feb-21Wool 100 550 55,000 100 30-Mar-21 Wool 100 480 48,000 100 600 278,000 600 30-Mar-21 100 480 48,000 600 60,000 24-Feb-21 20 550 11,000 600 12,000 59,000 72,000 Profit 13,000 Under FIFO
  • 71. We sell the first procured products first! Example - bakeries, food products! Date Inventory Detail Units (KG)CostAmount Units (KG) 10-Jan-20 Wool 100 150 15,000 100 11-Feb-20 Wool 100 250 25,000 100 17-Mar-20 Wool 100 650 65,000 100 21-Feb-21Wool 100 700 70,000 100 24-Feb-21Wool 100 550 55,000 100 30-Mar-21 Wool 100 480 48,000 100 600 278,000 600 10-Jan-20 100 150 15,000 600 60,000 11-Feb-20 20 250 5,000 600 12,000 20,000 72,000 Profit 52,000 Model Parameter You are running a restaurant called McB! You make great burgers - you are asked to model the actual net profits restaurant has to pay 50% of tax on profits. Date Inventory Detail Units (KG)CostAmount Units (KG) 10-Jan-20 Burger Buns 5 55 275 5 11-Feb-20 Burger Buns 5 62 310 5 17-Mar-20 Burger Buns 5 57 285 5 21-Feb-21Burger Buns 5 69 345 5 24-Feb-21Burger Buns 5 81 405 5 30-Mar-21 Burger Buns 5 51 255 5
  • 72. 30 1,875 30 Daily consumption - 10 KGS Find out the profit if 1 kg burger bun is sold for 75 Rs. HIFO MAX Formula is used ALT + E + S + V Max 81 5 405 75 375 For Value Pasting 69 5 345 75 375 10 750 750 We have just broke Net Prfit 0 Tax 0 FIFO MAX Formula is used Max 55 5 275 75 375 62 5 345 75 375 10 620 750 Net Prfit 130 Tax 65 profit after taxes 65 Recommendation - go for FIFO method!
  • 73. Fixed Asset Predictive Modelling 1 You will be given a current Fixed Asset scenario - you need to predict how the future will look! 2 If you want to predict how the future will look, you need to know how long the fixed asset will be in circul 3 Usint point 2, you will get a fair idea of depreciation - will be handled in the next class! 4 Remember - dep is useful! Why? It is not actually an expense but gets you tax benefit. Higher the dep, 5 Different models for depreciation - you need to know which model works best for you. THE END
  • 74. Depreciation and Working Capital Depreciation Depreciation is the systematic writing off of fixed assets of the firm over a period of time - determined by the life of the asset. Fixed Asset is generally recognized first in the Balance Sheet at Cost! At yearly intervals, this amount is reduced from the BS/ and taken to the P/L - this is called depreciation. 1 Helps you recognize the correct value of FA in the BS 2 Helps you to recognize the correct expense on a FA in the BS 3 It is also a buffer for a future expense on fixed assets… Methods of calculating depreciation 1 Straight Line Method of depreciation 2 Written Down Value Method 3 Sum of the Years Method 4 Units of Production Method 1 Straight Line Method of depreciation You will write off the fixed asset evenly across the life of the asset! If life - 10 years, straight line method says your value of dep = FA cost/ life Accepted widely, easy to calculate. Problem - not all assets detoriate evenly, most detoriation happens in the beginning of the life of the asset. When you purchase a car - life is 10 years. The most detoriation in value, will only be in the first 5 years. 2 Written Down Value It will depreciate the asset more when the asset is in the beginning stage, and lesser when the asset is in the later stages Problem - the asset might not evenly depreciate, not easy to calculate. WDV - Opening FA cost / % = Closing FA cost Openign FA cost = Closing FA cost Parameter Model We have a car worth 10L, brand new bought for Reliance Apparel. The life of this car is conservatively estimated to be 17 years. WDV - 0.085% Calculate dep on this car under SLM and WDV - written down value. Rate 0.09% I want to know what is the dep calculable at the 16th year under both methods. 30 sec SLM Cost 1,000,000 Life 17 Dep 58,824 on the first year as well as on the 16th year, this dep amount will remain the same! WDV 1 2 3 4 5 6 7 8 9 10 11 12 13 14 15 16 17 18 19 20 21 22 23 24 25 26 27 28 29 30 31 32 33 34 35 36 37 38 39 40 41 42 43 44 45 46 47 48 49 50 51 52 53 54 55 56 57 58 59 60 61 62 63 64 65 66 67 68 69 70 71 72 73 74 75 76 77 78 79 80 81 82 83 84 85 86 87 88 89 90 91 92 93 94 95 96 97 98 99 100 Cost 1,000,000 999,150 998,301 997,452 996,604 995,757 994,911 994,065 993,220 992,376 991,532 990,690 989,848 989,006 988,166 987,326 986,486 985,648 984,810 983,973 983,137 982,301 981,466 980,632 979,798 978,965 978,133 977,302 976,471 975,641 974,812 973,983 973,155 972,328 971,502 970,676 969,851 969,026 968,203 967,380 966,558 965,736 964,915 964,095 963,275 962,457 961,639 960,821 960,004 959,188 958,373 957,559 956,745 955,931 955,119 954,307 953,496 952,685 951,876 951,066 950,258 949,450 948,643 947,837 947,031 946,226 945,422 944,618 943,815 943,013 942,212 941,411 940,611 939,811 939,012 938,214 937,417 936,620 935,824 935,028 934,233 933,439 932,646 931,853 931,061 930,270 929,479 928,689 927,900 927,111 926,323 925,535 924,749 923,963 923,177 922,393 921,609 920,825 920,042 919,260 Dep 850 849 849 848 847 846 846 845 844 844 843 842 841 841 840 839 839 838 837 836 836 835 834 834 833 832 831 831 830 829 829 828 827 826 826 825 824 824 823 822 822 821 820 819 819 818 817 817 816 815 815 814 813 813 812 811 810 810 809 808 808 807 806 806 805 804 804 803 802 802 801 800 800 799 798 797 797 796 795 795 794 793 793 792 791 791 790 789 789 788 787 787 786 785 785 784 783 783 782 781 Ending Cost 999,150 998,301 997,452 996,604 995,757 994,911 994,065 993,220 992,376 991,532 990,690 989,848 989,006 988,166 987,326 986,486 985,648 984,810 983,973 983,137 982,301 981,466 980,632 979,798 978,965 978,133 977,302 976,471 975,641 974,812 973,983 973,155 972,328 971,502 970,676 969,851 969,026 968,203 967,380 966,558 965,736 964,915 964,095 963,275 962,457 961,639 960,821 960,004 959,188 958,373 957,559 956,745 955,931 955,119 954,307 953,496 952,685 951,876 951,066 950,258 949,450 948,643 947,837 947,031 946,226 945,422 944,618 943,815 943,013 942,212 941,411 940,611 939,811 939,012 938,214 937,417 936,620 935,824 935,028 934,233 933,439 932,646 931,853 931,061 930,270 929,479 928,689 927,900 927,111 926,323 925,535 924,749 923,963 923,177 922,393 921,609 920,825 920,042 919,260 918,479 Control Checks Ending Cost -   -   -   -   -   -   -   -   -   -   -   -   -   -   -   -   -   -   -   -   -   -   -   -   -   -   -   -   -   -   -   -   -   -   -   -   -   -   -   -   -   -   -   -   -   -   -   -   -   -   -   -   -   -   -   -   -   -   -   -   -   -   -   -   -   -   -   -   -   -   -   -   -   -   -   -   -   -   -   -   -   -   -   -   -   -   -   -   -   -   -   -   -   -   -   -   -   -   -   -   Dep -   -   -   -   -   -   -   -   -   -   -   -   -   -   -   -   -   -   -   -   -   -   -   -   -   -   -   -   -   -   -   -   -   -   -   -   -   -   -   -   -   -   -   -   -   -   -   -   -   -   -   -   -   -   -   -   -   -   -   -   -   -   -   -   -   -   -   -   -   -   -   -   -   -   -   -   -   -   -   -   -   -   -   -   -   -   -   -   -   -   -   -   -   -   -   -   -   -   -   -   Beginning C -   -   -   -   -   -   -   -   -   -   -   -   -   -   -   -   -   -   -   -   -   -   -   -   -   -   -   -   -   -   -   -   -   -   -   -   -   -   -   -   -   -   -   -   -   -   -   -   -   -   -   -   -   -   -   -   -   -   -   -   -   -   -   -   -   -   -   -   -   -   -   -   -   -   -   -   -   -   -   -   -   -   -   -   -   -   -   -   -   -   -   -   -   -   -   -   -   -   -   -   Parameter Model Reliance Apparel is confused between two life term machines it wants to buy! Machine A costs 10 L, will be available for atleast 50 years, and has a dep rate of 1.5%, at the end of this pariod, whatever remaining value will be sold for 5,000 Rs. Machine B costs 15 L, will be available for 65 years, and has a dep rate of 0.9%, at the end of this period, whatever remaining will be sold for 3500 Rs. Calculate which machine will give you more tax benefit, which machine will give you better life, and the 42nd and 49th year of depreciation for both machines. Assume the tax rate in question is 10%. THE END … TO BE CONTINUED….. WDV 1.50% Life 50 Tax 10% Machine A Years 1 2 3 4 5 6 7 8 9 10 11 12 13 14 15 16 17 18 19 20 21 22 23 24 25 26 27 28 29 30 31 32 33 34 35 36 37 38 39 40 41 42 43 44 45 46 47 48 49 50 51 52 53 54 55 56 57 58 59 60 61 62 63 64 65 Cost 1,000,000 985,000 970,225 955,672 941,337 927,217 913,308 899,609 886,115 872,823 859,730 846,834 834,132 821,620 809,296 797,156 785,199 773,421 761,820 750,392 739,136 728,049 717,129 706,372 695,776 685,339 675,059 664,934 654,960 645,135 635,458 625,926 616,537 607,289 598,180 589,207 580,369 571,664 563,089 554,642 546,323 538,128 530,056 522,105 514,273 506,559 498,961 491,477 484,104 476,843 469,690 462,645 455,705 448,870 442,137 435,505 428,972 422,537 416,199 409,956 403,807 397,750 391,784 385,907 380,118 Dep 15,000 14,775 14,553 14,335 14,120 13,908 13,700 13,494 13,292 13,092 12,896 12,703 12,512 12,324 12,139 11,957 11,778 11,601 11,427 11,256 11,087 10,921 10,757 10,596 10,437 10,280 10,126 9,974 9,824 9,677 9,532 9,389 9,248 9,109 8,973 8,838 8,706 8,575 8,446 8,320 8,195 8,072 7,951 7,832 7,714 7,598 7,484 7,372 7,262 7,153 7,045 6,940 6,836 6,733 6,632 6,533 6,435 6,338 6,243 6,149 6,057 5,966 5,877 5,789 5,702 Closing Cost 985,000 970,225 955,672 941,337 927,217 913,308 899,609 886,115 872,823 859,730 846,834 834,132 821,620 809,296 797,156 785,199 773,421 761,820 750,392 739,136 728,049 717,129 706,372 695,776 685,339 675,059 664,934 654,960 645,135 635,458 625,926 616,537 607,289 598,180 589,207 580,369 571,664 563,089 554,642 546,323 538,128 530,056 522,105 514,273 506,559 498,961 491,477 484,104 476,843 469,690 462,645 455,705 448,870 442,137 435,505 428,972 422,537 416,199 409,956 403,807 397,750 391,784 385,907 380,118 374,417 Tax Benefit 1,500 1,478 1,455 1,434 1,412 1,391 1,370 1,349 1,329 1,309 1,290 1,270 1,251 1,232 1,214 1,196 1,178 1,160 1,143 1,126 1,109 1,092 1,076 1,060 1,044 1,028 1,013 997 982 968 953 939 925 911 897 884 871 857 845 832 819 807 795 783 771 760 748 737 726 715 705 694 684 673 663 653 643 634 624 615 606 597 588 579 570 Value 374,417 Total Cost 1,000,000 Tax Benefit 62,558 WDV 90.00% Life 65 Tax 10% COST of OP 563,025 Machine B Years 1 2 3 4 5 6 7 8 9 10 11 12 13 14 15 16 17 18 19 20 21 22 23 24 25 26 27 28 29 30 31 32 33 34 35 36 37 38 39 40 41 42 43 44 45 46 47 48 49 50 51 52 53 54 55 56 57 58 59 60 61 62 63 64 65 Cost 1,500,000 1,477,500 1,455,338 1,433,507 1,412,005 1,390,825 1,369,962 1,349,413 1,329,172 1,309,234 1,289,596 1,270,252 1,251,198 1,232,430 1,213,944 1,195,734 1,177,798 1,160,131 1,142,729 1,125,588 1,108,705 1,092,074 1,075,693 1,059,558 1,043,664 1,028,009 1,012,589 997,400 982,439 967,703 953,187 938,889 924,806 910,934 897,270 883,811 870,554 857,495 844,633 831,963 819,484 807,192 795,084 783,158 771,410 759,839 748,442 737,215 726,157 715,264 704,535 693,967 683,558 673,304 663,205 653,257 643,458 633,806 624,299 614,934 605,710 596,625 587,675 578,860 570,177 Dep 22,500 22,163 21,830 21,503 21,180 20,862 20,549 20,241 19,938 19,639 19,344 19,054 18,768 18,486 18,209 17,936 17,667 17,402 17,141 16,884 16,631 16,381 16,135 15,893 15,655 15,420 15,189 14,961 14,737 14,516 14,298 14,083 13,872 13,664 13,459 13,257 13,058 12,862 12,669 12,479 12,292 12,108 11,926 11,747 11,571 11,398 11,227 11,058 10,892 10,729 10,568 10,410 10,253 10,100 9,948 9,799 9,652 9,507 9,364 9,224 9,086 8,949 8,815 8,683 8,553 Closing Cost 1,477,500 1,455,338 1,433,507 1,412,005 1,390,825 1,369,962 1,349,413 1,329,172 1,309,234 1,289,596 1,270,252 1,251,198 1,232,430 1,213,944 1,195,734 1,177,798 1,160,131 1,142,729 1,125,588 1,108,705 1,092,074 1,075,693 1,059,558 1,043,664 1,028,009 1,012,589 997,400 982,439 967,703 953,187 938,889 924,806 910,934 897,270 883,811 870,554 857,495 844,633 831,963 819,484 807,192 795,084 783,158 771,410 759,839 748,442 737,215 726,157 715,264 704,535 693,967 683,558 673,304 663,205 653,257 643,458 633,806 624,299 614,934 605,710 596,625 587,675 578,860 570,177 561,625 Tax Benefit 2,250 2,216 2,183 2,150 2,118 2,086 2,055 2,024 1,994 1,964 1,934 1,905 1,877 1,849 1,821 1,794 1,767 1,740 1,714 1,688 1,663 1,638 1,614 1,589 1,565 1,542 1,519 1,496 1,474 1,452 1,430 1,408 1,387 1,366 1,346 1,326 1,306 1,286 1,267 1,248 1,229 1,211 1,193 1,175 1,157 1,140 1,123 1,106 1,089 1,073 1,057 1,041 1,025 1,010 995 980 965 951 936 922 909 895 882 868 855 Value 561,625 Total Cost 1,500,000 Let me ask you a question - what cost of machine will bring my value to 0 at the year 65? Tax Benefit 93,838 Assume same WDV rate as Machine A COST of OP 844,538 WDV 20.00% Life 65 Tax 10% Machine A Years 1 2 3 4 5 6 7 8 9 10 11 12 13 14 15 16 17 18 19 20 21 22 23 24 25 26 27 28 29 30 31 32 33 34 35 36 37 38 39 40 41 42 43 44 45 46 47 48 49 50 51 52 53 54 55 56 57 58 59 60 61 62 63 64 65 Cost 1,000,000 800,000 640,000 512,000 409,600 327,680 262,144 209,715 167,772 134,218 107,374 85,899 68,719 54,976 43,980 35,184 28,147 22,518 18,014 14,412 11,529 9,223 7,379 5,903 4,722 3,778 3,022 2,418 1,934 1,547 1,238 990 792 634 507 406 325 260 208 166 133 106 85 68 54 44 35 28 22 18 14 11 9 7 6 5 4 3 2 2 2 1 1 1 1 Dep 200,000 160,000 128,000 102,400 81,920 65,536 52,429 41,943 33,554 26,844 21,475 17,180 13,744 10,995 8,796 7,037 5,629 4,504 3,603 2,882 2,306 1,845 1,476 1,181 944 756 604 484 387 309 248 198 158 127 101 81 65 52 42 33 27 21 17 14 11 9 7 6 4 4 3 2 2 1 1 1 1 1 0.47890 0.38312 0.30650 0 0 0 0 Closing Cost 800,000 640,000 512,000 409,600 327,680 262,144 209,715 167,772 134,218 107,374 85,899 68,719 54,976 43,980 35,184 28,147 22,518 18,014 14,412 11,529 9,223 7,379 5,903 4,722 3,778 3,022 2,418 1,934 1,547 1,238 990 792 634 507 406 325 260 208 166 133 106 85 68 54 44 35 28 22 18 14 11 9 7 6 5 4 3 2 2 2 1 1 1 1 1 Tax Benefit 20,000 16,000 12,800 10,240 8,192 6,554 5,243 4,194 3,355 2,684 2,147 1,718 1,374 1,100 880 704 563 450 360 288 231 184 148 118 94 76 60 48 39 31 25 20 16 13 10 8 6 5 4 3 3 2 2 1 1 1 1 1 0 0 0 0 0 0 0 0 0 0 0 0 0 0 0 0 0 Value 1 Total Cost 1,000,000 Tax Benefit 100,000 COST of OP 900,000 Scenario Analysis! Will tell you what values will bring what results - you can create a model and plug in different numbers, and with these different numbers, we will look at results! The beauty of a good model is that you will be able to scenario analyze a lot of different items. Along with scenario anaylsis, financial modelling also makes use of tools like monte carlo simulation! You will be simulating multiple factors - can be done with an excel but generally more cumbersome. You can use Monte Carlo analysis with complex SQLs, Pythons etc. Data analsys and data modelling - comes into play. you will need to know what data to feed in in order to make a particular model more efficient. Closing Comments - Depreciation is non-cash so make sure you never model it into a direct cash flow statement. Indirect cash flow statement - you can model depreciation but ensure this is done accurately! THE END
  • 75. Working Capital It is the amount of liquidity/ cash required to meet future expenses or liabilities. Payables - expenses payable, creditors payable, salary payable, rent payable etc. Asset Liability Mgmt - so once your expenses are finalized, you need to ensure you have sufficient assets to meet those expenses. Which means - we first need to model our expenses! and then we would have to manage our assets to meet those expenses. There are two types of working capital - gross working capital and the next is net working capital. Gross Working Capital = Current Assets = Cash + Sundry Debtors + Inventory (anything that can be made liquid in a reasonably short point of time) Net Working Capital = Current Assets - Current Liabilities (Sundry Creditors, Liabilities Payable and rent/ expense payable etc.) If you know the current liability value, you can model your assts accordingly and arrive at how much assets you need! Change in Net Working Capital = NWC for current year - NWC for previous year. If total current assets = 4500 Rs. Total current liabilities = 3000 Rs. NWC 1500 Base Scenario 1 Scenario 2 Scenario 3 Scenario 4 Ways to increase NWC Current Assets Cash A 5 6 5 7 4 Make more sales, spend less money in cash, sell Sundry Debtors B 3 4 3 5 2 Make more sales Inventory C 2 3 2 4 1 Buy more inventory at cheaper costs. Total Current Assets A+B+C=X 10 X 13 10 16 7 Current Liabilities Sundry Creditors D 2 2 1 3 0 Buy cheaper, also make sure you use the correc
  • 76. Other Payables E 4 4 3 5 2 Incur less expenses, so that you wont have spen Total Current Liab D+E=Y 6 Y 6 4 8 2 Net Working Capital X-Y 4 X-Y 7 6 8 5 NWC will increase if 1 X goes up, but Y remains constant 2 X remains constant, but Y reduces 3 X increases and Y increases, but X increases more than Y 4 X decreases and Y decreases, but Y decreases more than X Model Parameter Reliance Apparel is trying to model working capital for the next 6 month. They expect current sales to increase by 50%, out of which 30% will be in cash. Curren They also expect purchases of raw materials to go down by 10%, currently for every unit sold, cost of purchase is 60%. All purchases will be in credit. They will also sell a fixed asset - land for 10,000 and deposit the money in cash. Other payable for this period are 3000, rent and 4000, salaries. This will both go up by 25% after 6 months. Make a base model, and a post 6 month model in order to arrive at the correct values. Particulars Base 6M Model Current Assets Base 6M Model Sales 1,000 1,500 Cash 150,000 235,000 Value 500 500 Debtors 350,000 525,000 Inventory -   -   Sales Value 500,000 750,000 Total Current Assets 500,000 760,000 Cash Sales 150,000 225,000 Credit Sales 350,000 525,000 Payables 300,000 450,000
  • 77. Other - Rent + Salary 42,000 52,500 Purchases 300,000 450,000 Total Current Liabilities 342,000 502,500 Cash Purchase -   -   Credit Purchase 300,000 450,000 Total Net Working Capital 158,000 257,500
  • 78. Multi period Working Capital Model! Sale of items Cash Sale of fixed assets Loans Debtors Revenue generating items like sales, service provided etc Advances Prepayments done - to get a contract Creditors extra payment done last time - adjusted this time Prepayments received Payables Inventory Expenses Purchases getting any product / service etc. Purchase Sales Purchase Return Day to day expenses Sales Return Rent, Salaries etc. Something you need to pay but havent paid Model Parameters x We are the owners of Reliance apparel - balance sheet currently only has Capital and Cash - each 1 L x In the current period/ year (2021), you purchase items for 7 L, pay 10% in cash, and the rest in credit x You also sell all of these items at a 10% margin - earning the entire amount in cash. x At the end of the year, you purchase a further 10L of items, paying 50% cash, and the rest in credit. x Next year (2022) you sell your entire inventory at 15% profit, entiry on credit. x In 2022 total purchases are 25L, and you settle all of 2021's creditors balances. All of 2022's purchases are through credit. x You sell all of 2022's purchases for 10% profit, and earn 70% in cash and the rest are balance as of the end of the year. x In 2023, your purchases are 10% more than 2022, and the same cash: credit ratio is maintained. x 2023 Sales are the same as the sales for 2022, and all in credit. 2022's debtors settle their balance in 2023.
  • 79. x In 2024, all opening debit and creditors balances are settled. x Prepare a Working Capital Model showing net working capital for 2021-2024. Do not make any further assumptions than what is alrea Working Capital 2021 2022 2023 2024 Current Assets Cash 1,300,000 2,095,000 3,320,000 820,000 Debtors -   1,225,000 2,750,000 -   Inventory 1,000,000 -   -   -   Total 2,300,000 3,320,000 6,070,000 820,000 Current Liabilities Creditors 1,130,000 2,500,000 5,250,000 -   Total 1,130,000 2,500,000 5,250,000 -   Net Working Capita 1,170,000 820,000 820,000 820,000 Working Papers Sales 770,000 -   -   -   Value (Rs.) Cash 770,000 Credit -   Purchases 700,000 -   -   -   Value (Rs.) Cash 70,000 Credit 630,000 Total Cash Opening 100,000 800,000 800,000 800,000 Cash Rec'd 770,000 Cash Paid 70,000 Closing 800,000 800,000 800,000 800,000
  • 80. Total Debtors Opening -   -   -   -   Credit Sales -   Debtors Cash Rec'd -   Closing -   -   -   -   Total Creditors Opening -   630,000 630,000 630,000 Credit Purchases 700,000 -   -   -   Creditors Paid 70,000 Closing 630,000 630,000 630,000 630,000 Total Inventory Opening -   -70,000 -70,000 -70,000 Purchases Made 700,000 -   -   -   Sales Made 770,000 -   -   -   Closing -70,000 -70,000 -70,000 -70,000 THE END
  • 81. Ratios and Financial Modelling What are financial ratios? 1 These are basically sourced from financial statements. Once you finish modelling your financial statements, it is never complete until and unless ratios are also modelled along with it! 2 It gives us meaningful information on financial statements! 3 More long term in nature! Some of these are short term ratios - some are long term, and you will know which ratios help you how! 4 Helps with quant analysis - what is quant analysis? Regressing company data - to see patterns. Types of financial ratios! 1 Liquidity Ratio 2 Leverage Ratio Leverage means debt! 3 Efficiency Ratio 4 Profitability Ratio 5 Market Value Ratio These ratios can be used for different purposes - they are coming from different numbers! They all come from our financial statements - but which parts of the financial statement is the question! Balance Sheet Profit and Loss A/C Liabilities and Capital Assets Debit Credit Particulars Amount Particulars Amount Particulars Amount Particulars Amount Capital Fixed Assets Purchases 18,000 Sales 50,000 Equity Capital 10,000 Plant and Machinery 15,000 Interest Exp 7,500 Reserves and Surplus 14,500 Intangibles - Goodwill 8,000 Rent Exp 8,000 Liabilities Salary Exp 8,000 Long Term Liabilities Current Assets Profit 8,500 Loan from Banks 5,000 Cash 10,000 Debentures/ Bonds 3,000 Sundry Debtors 5,000 Inventory 7,000 Total 50,000 Total 50,000 Short Term Liabilities -   Sundry Creditors 8,000 Rent and Salary Payables 4,500
  • 82. Total 45,000 Total 45,000 Liquidity Ratios Current Ratio = Current Assets / Current Liabilities Current Assets = 22,000 If Current Assets = Current Liabilities = 1 Current Liabilities = 12,500 More Current Assets than Current Liabilities >1 - which is good Less Current Assets than Current Liabilities <1 - which is bad Ratio = 1.76 Great! Acid Test Ratio = Current Assets - Inventory/ Current Liabilites it means if I don’t have time to sell the inventory, how will my current ratio look? Current Assets = 15,000 not incl. i So will acid tst ratio be > current ratio? NO! Put a check to make sure it never is Current Liabilities = 12,500 If Current Assets (minus inventory) = Current Liabilities = 1 More Current Assets (minus inventory) than Current Liabilities >1 - which is good Ratio = 1.20 Great! Less Current Assets (minus inventory) than Current Liabilities <1 - which is bad If acid test ratio is less than 1, and current ratio is greater than 1 - it means you are too dependent on inventories. Be careful! Cash Ratio Current assets (minus everything except cash) ->Cash / Current Liabilities Current Assets = 10,000 not incl. i Can cash ratio be greater than acid test ratio? NO! It has to be lower. Current Liabilities = 12,500 If Cash = Current Liabilities = 1 More cash than Current Liabilities >1 - which is good Ratio = 0.80 Not good Less Cash than Current Liabilities <1 - which is bad Operating Cash Flow Ratio Operating cash flow/ Current Liabilities What is the difference between Cash ratio and operating cash flow ratio? Operating Cash Flow = all cash related amounts you earned and paid etc for the current year! Not considering opening cash balance! Only looking at current years cash balance from sales minus expenses you paid etc. It will tell you how many time of expenses you can pay out using operating cash flow. Assume Operating Cash flow is 1L for the company that we are looking at. Operating Cash Flow Ratio = 100,000 = 8 8x
  • 83. 12,500 What it means is - you can afford to pay out 8x the current liabilities with just operating cash flows. Which means if current liabilities is 8x larger - 100,000 I can completely pay this with my operating cash flows. I don’t have to invest or finance for these cash flows. Larger the operating cash flow ratio, the better it is for the company! Leverage Ratios Debt Ratio = Total Liabilities Total Liab. Will include all liabilities Total Assets Total Assets will include all assets. We all want assets to be larger! So, assets are denominators - > and if denominator is larger, smaller the ratio, better it is for the company! Total Liabilities 20,500 Total Assets 45,000 Total Liabilities = 0.46 Total Assets which means - for every rupee of assets you have, 46p is a liability you need to pay out! So can we say what the free assets are? 0.54 p is free assets Debt to Equity = Total Liabilities Total Liab. Will include all liabilities Total Shareholders Equity Equity Capital + profits you made till date - losses you suffered till date (Sometimes called reserves and surplus) it means for every rupee of capital, or equity you have in the business, how much liab is still in the business? If you invested 100,000 Profits till date 70,000 Losses 30,000 Net Reserves and Surplus 40,000 This is the amount you will see in the Balance Sheet. This is the amount the shareholders have earned, but have not removed from the business - they didn’t take any dividends they didn’t take any salaries etc. Its like the total investment amount along with the initial capital
  • 84. Total Liabilities 20,500 = 0.84 Total Shareholders Equity 24,500 It means, for every 1 Rupee I have left invested in the business, I have 84p of debt to be paid with that You need to first pay all your debt - and this is paid through the 84p that you have invested in the company! Interest Coverage Ratio = Total Operating Income = Sales - Expenses (EBIT) 16,000 2.13 Total Debt Service ( Interest Paid ) Interest Paid 7,500 It means I can afford to pay 2x the interest I am currently paying - so if my interest expense goes up another 2.13 times - I will still be able to pay it without making a loss! So - if the interest coverage ratio = 1, it means your operating income and interest paid are equal! If interest coverage ration > 1, more operating income than interest paid - good! If interest coverage ratio < 1, less operating income than interest paid - bad! Higher the interest coverage ratio - better it is for the company! Efficiency Ratio Asset Turnover Ratio = Net Sales If more numerator than denominator, more sales and less assets, ratio is hiher and therefore this company is really good! Total avg assets If more denominator than numerator, more assets and less sales, this ratio is low and bad for the company! Net Sales = All Sales - Sales Return Avg Assets = avg over a year 50,000 1.11 45,000 For 1 rupee of assets, I'm making 1.11 rupee of sales! Higher the better! Inventory Turnover Ratio = COGS How much was the cost of good sold, and how much is my avg inventory - how many times my companys inventory is Avg Inventory replaced over a given period. COGS - will tell you the total inventory sold in a year!
  • 85. Avg inv - will only tell you how much is there in your BS at the end of the year. Starting inventory 1L Increased to 1L 1L Sold 2L -2L Increased to 1L 1L Sold 1L -1L Increased to 1L 1L Closing Inventory 1L COGS +3L Inventory Turnover Ratio 3L = 3 times 1L We purchased this inventory three times in order to maintain stock! Receivables Turnover ratio/ Payables Turnover Ratio Credit Sales/ Credit Purchasesvery simialr to inventory turnover ratio Avg recb or Avg Payable THE END
  • 86. Profitability Ratio It measure the ability of a company to generate income with respect to the revenue it makes! This is basically a link between revenue and profits. Let us take Amazon! And let us take our local kirana shop! Amazon has revenues of crores and crores! No profit till date! The kirana shop probably makes 1L revenue - but makes a small 10% profit on it. Which model of business is better? Profit and Loss A/C Debit Credit Particulars Amount Particulars Amount Purchases 18,000 Sales 50,000 Interest Exp 7,500 Rent Exp 8,000 Salary Exp 8,000 Profit 8,500 Total 50,000 Total 50,000 Gross Profit Ratio Gross Profit = 32,000 = 0.64 Sales 50,000
  • 87. It means for every rupee of sales you make, you make 64p of gross profit! Higher the gross profit ratio, the better it is! we have already seen the linkage between gross profit and net profit - the linkage between the gross p What does High NP, but Low GP or Low NP and High GP mean? Analysis! Remember -> gross profit is sales minus direct expenses (do not include indirect expenses) for diff between direct and indirect -> refer to t Sales is net sales - total sales minut sales return! Net Profit Ratio Net Profits = 8,500 = 0.17 Sales 50,000 It means for every rupee of revenue you make, you make 17p of net profits Higher the net profit the better it is! Sales 1 Direct Expenses 0.36 36 p of direct expenses for every rupee of sales you make GP 0.64 Indirect Expenses 0.47 47 p of indirect expenses for every rupee of sales you ma NP 0.17 Indirect Expenses Ratio - All indirect expenses 23,500 0.47 Sales 50,000
  • 88. Salary Salary 8,000 0.16 Sales 50,000 Rent Rent 8,000 0.16 0.32 Sales 50,000 Interest Interest 7,500 0.15 0.15 Sales 50,000 0.47 0.47 This is called attribution - or ratio attribution! This is basically breaking up your ratios into different sub categories! Operating Margin Ratio This is very similar to the gross profit ratio, only difference is that you take operating profit as numerator, and no Operating Profit = Net profit + Interest + Tax or called as EBIT Operating Profit 16,000 32% 50,000 Net Profit 17% Difference 15% Interest and tax!
  • 89. Return on Assets Ratio Net Income Total Assets This will tell you how much profit you are making per rupee of assets you have! Net Profits = 8,500 0.19 Total Assets = 45,000 This means that for every 1 Rupee of asset you have, you make 19 p of profit! This is very similar to the assets turnover ratio! ROE (Return of Equity) Net Income Total Shareholders Equity This will tell you how how much profit you make, for every rupee of shareholders equity that you have! This is similar to the Debt: Equity, only difference is instead of debt you will be looking at Net Income: Eq Net Profits = 8,500 0.35 Total Shareholders Eq = 24,500 For every rupee invested in this company - I make 35 p of income! With every model you make, a lot of these ratios are derived - error in modelling means an error in the ratio itself! THE END
  • 90. Market Value Ratios These ratios will tell you how your company is positioned in the market - as you value the company's shares or stocks! Book Value per Share Balance Sheet Liabilities and Capital Assets Shareholders Equity Particulars Amount Particulars Amount Total Shares Outstanding Capital Fixed Assets Equity Capital 10,000 Plant and Machinery 15,000 Reserves and Surplus 14,500 Intangibles - Goodwill 8,000 Shareholders Eq = All equity capital + All eq capital's reserves and surplus! Liabilities = 24,500 Long Term Liabilities Current Assets Loan from Banks 5,000 Cash 10,000 or Debentures/ Bonds 3,000 Sundry Debtors 5,000 Inventory 7,000 Assets minus Liabilities Short Term Liabilities -   = 24,500 Sundry Creditors 8,000 Rent and Salary Payables 4,500 Let us assume total oustanding shares are 10k shares (number! Not value!) Total 45,000 Total 45,000 Shares Outstanding 10,000 BVPS 2.45 Attribution analysis for this value - find out how we can break this out Capital 1 Total capital available divided by total shared R&S 1.45 Total reserves available / total shares 2.45
  • 91. Higher the book value, better it is! But remember only one thing - BVPS will not determine your market value. Market value is driven by a lot of 'other things' - suspense! Dividend Yield ratio This is telling you per rupee of MV, how much dividend am I getting? BVPS 2.45 Let us assume this company's shares are trading at the same MV as BV. They have declared a dividend of 5rs per share. Your yield is Dividend per share = 5 = 2.04 MV per share 2.45 It means for every 1 rupee of share you own (MV), you get 2.04 rs as dividend! you are basically doubling this money every year just through dividends! Higher the yield, more cash, therefore better it is for the company! EPS (Earnings Per Share) Net Profits = 8,500 = 0.85 Number of Shares 10,000 This will tell you how much net profit you make for every share you own! Higher the better, because it means you get more profits from owning shares!
  • 92. Price to Earnings Ratio This is one of the most important ratios when it comes to companys analysis! And when we model - we have to set up a great model for PE ratio before we start! Why? This will determine whether the company is good or bad! Market Value per Share = 2.45 = 2.88 Earning per Share 0.85 It means that for every 1 rupee of EPS, the shareholder will receive 2.88 rupees from the market! The market will give you a premium of 1.88 rupees for every rupee you earn! Is this efficient? Not a question we should be asking! Higher the PE for a share you own, better it is. Higher the PE for a share you want to own, do more analysis. For example - if the industry PE ratio is 1.75, but the share you own is giving you a PE of 2.88, be a little wary! this means my share is overvalued! Therefore, sell it. We will talk about these buy/ sell decisions a little later, but for now remember only one thing! High PE ratio is not always good, low PE ratio is not always bad! PE ratio is very important for you to source data from the market!
  • 93. Conclusion and Common Errors Conclusion - basically a list of points you need to remember whenever it comes to creating a model! Important Points You Need To Remember 1 Financial Modelling is done by analysts, as well as people who want to express an opinion on the FS. 2 What is a model - basically drawing up present and future financial statements in order to see the path/ progress of a company! 3 You will get data from ledgers as well as different other sources of information - and you might have to use your own models. 4 All data is dependent on some other data! P/L is dependent on ledger, your B/s is dependent on ledgers - so no data is useless! 5 Some information is a byproduct of other information - for eg. Creditors are a byproduct of purchases and credit ratio! 6 When it comes to data, or modelling - make sure your basics are in place! 7 Data, data, data - either data is given to you, or you need to assume it yourself! if it’s a predective model - make sure your assumptions are reasonable. 8 Never write off a business model using a one period model! 9 Control Checks - more is better than less. 10 understand how the end product is going to look, structure it accordingly. " Easy to See, and Easier to Understand" Important Excel ERRORs you should avoid! 1 Cross Reference/ Circular Reference Error - this happens when two sets data are cross referencing each other, thus there is no final correct answer! A B 1 1 2 2 3 3 4 4 5 5 #REF! #REF! #REF! #REF! How to resolve: You need to check which cells are causing the circular reference error, and make appropriate corrections! No cell should be dependent on another cell for information! 2 ####### error
  • 94. This happens when numbers in a particular cell are too big to fit into the cell's width 32,165,465,165,416,500,000,000,000,000,000,000,000,000,000,000,000,000,000,000.00 This means the number is really too big to fit into the cell D40 How to resolve: Expand the cell. 3 Wrong number format error This happens when a number is in the wrong format! It will be in log, or e^formats, like the below - 3.21655E+58 This number format is basically telling us - there are 58 digits after the number expressed. Which means wee need to change the format in which it is expressed. How to change the format: go to ALT + H + N + (ALT + DOWN Arrow) Remember to hover over the cell that is giving you the problem when you do this! 4 #Name Error (#NAME?) This error comes up when the excel sheer is not able to recognize the text in the formula! For example, one common formula we use is SUM But if you put it wrong, it will give a NAME error 1 2 3 4 5
  • 95. #NAME? How to resolve: Make sure your formula is accurate - text in the formula is accurate! 1 2 3 4 5 15 5 VALUE Error - this comes up when the variables mentioned in the formula is wrong - what do you mean by variables? The cell references we mention in the formula! 1 2 3 4 sid #VALUE! How to avoid: In order to avoid this, make sure all the cell references are accurate, as well as relevant 6 #DIV?0! Error! This error comes up when you ask something to divide by 0. Can we divide by 0? We cannot - so this error will majorly be a test with respect to Division by 0 For example - 500 0 #DIV/0! How can this be avoided - 1. Do you really want to divide by zero? Try putting 0.00000001 - this might work!
  • 96. 500 0.0000001 5000000000 But the answer is not accurate - the right answer is infinity! Remember 5th grade math? 2. Don’t divide by 0! Change the number to any other rational number. 7 NULL Error This comes up when your symbols in a formula are wrong For example 1 2 3 #ERROR! In order to fix this: Make sure you put in the right arithmetic symbols - 1 2 3 6 + sum(C55+D55) NAME ERROR NULL ERROR or VALUE Error Null Error: arythmetic symbol issues
  • 97. VALUE Error: Cell ref issues 8 REF error If the data you are referencing is no longer presenting, a ref error comes up! 1 2 3 6 This is good 1 2 #REF! This is good How do you resolve: Go to the original data, and check formulas! THE END
  • 98. [1] Author: Set of assumptions!