SlideShare a Scribd company logo
1 of 12
Box and Whisker Plots
34 41 68 88 94
Median
Lower
Quartile
Lower
Extreme
Upper
Quartile
Upper
Extreme
Interquartile Range
Box-and-Whisker Plots
• A box-and-whisker-plot is a
data display that divides
data values into four parts.
Ordered data are divided
into a lower and upper half
by the median.
Making a Box-and-Whisker Plot
Roller Coaster Heights (m)
35 42 44 60 60 70 76 78 81 100
Median =
Lower half Upper half
35 42 44 60 60 70 76 78 81 100
Lower Quartile Upper Quartile
30 40 50 60 70 80 90 100 110
35 44 65 78 100
Lower
Extreme
Upper
Extreme
60 42 100 81 78 70 60 76 44 35
Put in order from least to greatest.
(60 + 70) ÷ 2 = 65
Roller Coaster Heights w/ Top Thrill Dragster (m)
35 42 44 60 60 70 76 78 81 420
Median =
Lower half Upper half
35 42 44 60 60 70 76 78 81 420
Lower Quartile Upper Quartile
0 50 100 150 200 250 300 350 400
35 44 65 78
Lower
Extreme
Upper
Extreme
420
60 42 420 81 78 70 60 76 44 35
Put in order from least to greatest.
(60 + 70) ÷ 2 = 65
Runs scored by the Indians over 10 games
0 2 3 4 4 8 8 9 10 16
Median =
Lower half
= 6
Lower Quartile Upper Quartile
0 2 4 6 8 10 12 14 16
0 3 6 9 16
0 2 3 4 4 8 8 9 10 16
3 10 8 4 9 16 8 0 2 4
(4+ 8) ÷ 2
Upper half
Put in order from least to greatest.
Lower
Extreme
Upper
Extreme
Median = (65+ 71) ÷ 2 = 68
Lower half Upper half
Lower Quartile Upper Quartile
30 40 50 60 70 80 90 100
34 41 68 88 94
34 38 40 41 42 50 65 71 82 87 88 91 93 94
Homework
Put in order from least to greatest.
40 71 82 42 94 88 65 50 38 91 34 93 41 87
34 38 40 41 42 50 65 71 82 87 88 91 93 94
Lower
Extreme
Upper
Extreme
Making a Box-and-Whisker Plot
Median = (65+ 71) ÷ 2 = 68
34 41 68 88 94
Homework
Put in order from least to greatest.
40 71 82 42 94 88 65 50 38 91 34 93 41 87
34 38 40 41 42 50 65 71 82 87 88 91 93 94
Median
Lower
Quartile
Lower
Extreme
Upper
Quartile
Upper
Extreme
Interquartile Range
The following 4 slides could be used as student worksheets.
Go to:
1. File
2. Print
3. Slides: 9-12
4. Print what: Handouts
5. Slides per page: 2
6. Order: Horizontal
7. Color/Grayscale: Grayscale
8. Frame slides
9. Let me know if this print method is not possible for your
download.
Making a Box-and-Whisker Plot
Median =
Roller Coaster Heights (ft.)
60 42 100 81 78 70 60 76 44 35Put in order from least to greatest.
Median =
Put in order from least to greatest.
Roller Coaster Heights w/ Top Thrill Dragster (ft.)
60 42 420 81 78 70 60 76 44 35
Runs scored by the Indians over 10 games
Median =
3 10 8 4 9 16 8 0 2 4
Put in order from least to greatest.
Median =
Put in order from least to greatest.
Homework
40 71 82 42 94 88 65 50 38 91 34 93 41 87

More Related Content

Similar to Boxand whiskerplotsandhandoutmathpowerpoint

The Frequency distribution table.pptx
The Frequency distribution table.pptxThe Frequency distribution table.pptx
The Frequency distribution table.pptxmariadanielapereyra
 
3.3 Measures of Variation
3.3 Measures of Variation3.3 Measures of Variation
3.3 Measures of Variationmlong24
 
Statistics (Measures of Dispersion)
Statistics (Measures of Dispersion)Statistics (Measures of Dispersion)
Statistics (Measures of Dispersion)Ron_Eick
 
Frequency Distribution (Class-interval- Tally).pptx
Frequency Distribution (Class-interval- Tally).pptxFrequency Distribution (Class-interval- Tally).pptx
Frequency Distribution (Class-interval- Tally).pptxAlwinCAsuncion
 
Assessment of Learning 2 (Overview)
Assessment of Learning 2 (Overview)Assessment of Learning 2 (Overview)
Assessment of Learning 2 (Overview)Caroline Lace
 
frequency distribution
 frequency distribution frequency distribution
frequency distributionUnsa Shakir
 
GREKing: Vedic Maths Concept
GREKing: Vedic Maths ConceptGREKing: Vedic Maths Concept
GREKing: Vedic Maths ConceptRahul Singh
 
just reference
just referencejust reference
just referenceSumin Kim
 
cumulative-frequency.. bjukkjhhuioogffd8
cumulative-frequency.. bjukkjhhuioogffd8cumulative-frequency.. bjukkjhhuioogffd8
cumulative-frequency.. bjukkjhhuioogffd8clayorder147
 
Measures of central tendency
Measures of central tendencyMeasures of central tendency
Measures of central tendencyManu Antony
 
Descriptive Statistics Part II: Graphical Description
Descriptive Statistics Part II: Graphical DescriptionDescriptive Statistics Part II: Graphical Description
Descriptive Statistics Part II: Graphical Descriptiongetyourcheaton
 
Statistics-Measures of dispersions
Statistics-Measures of dispersionsStatistics-Measures of dispersions
Statistics-Measures of dispersionsCapricorn
 
Yr7-RoundingApproximation.pptx
Yr7-RoundingApproximation.pptxYr7-RoundingApproximation.pptx
Yr7-RoundingApproximation.pptxEidTahir
 

Similar to Boxand whiskerplotsandhandoutmathpowerpoint (20)

The Frequency distribution table.pptx
The Frequency distribution table.pptxThe Frequency distribution table.pptx
The Frequency distribution table.pptx
 
3.3 Measures of Variation
3.3 Measures of Variation3.3 Measures of Variation
3.3 Measures of Variation
 
Statistics (Measures of Dispersion)
Statistics (Measures of Dispersion)Statistics (Measures of Dispersion)
Statistics (Measures of Dispersion)
 
STATISTICS
STATISTICSSTATISTICS
STATISTICS
 
Frequency Distribution (Class-interval- Tally).pptx
Frequency Distribution (Class-interval- Tally).pptxFrequency Distribution (Class-interval- Tally).pptx
Frequency Distribution (Class-interval- Tally).pptx
 
Assessment of Learning 2 (Overview)
Assessment of Learning 2 (Overview)Assessment of Learning 2 (Overview)
Assessment of Learning 2 (Overview)
 
frequency distribution
 frequency distribution frequency distribution
frequency distribution
 
GREKing: Vedic Maths Concept
GREKing: Vedic Maths ConceptGREKing: Vedic Maths Concept
GREKing: Vedic Maths Concept
 
basics
basicsbasics
basics
 
Basic math
Basic mathBasic math
Basic math
 
upload
uploadupload
upload
 
just reference
just referencejust reference
just reference
 
cumulative-frequency.. bjukkjhhuioogffd8
cumulative-frequency.. bjukkjhhuioogffd8cumulative-frequency.. bjukkjhhuioogffd8
cumulative-frequency.. bjukkjhhuioogffd8
 
Measures of central tendency
Measures of central tendencyMeasures of central tendency
Measures of central tendency
 
Measures of-variation
Measures of-variationMeasures of-variation
Measures of-variation
 
Descriptive Statistics Part II: Graphical Description
Descriptive Statistics Part II: Graphical DescriptionDescriptive Statistics Part II: Graphical Description
Descriptive Statistics Part II: Graphical Description
 
Constructing a histogram
Constructing a histogramConstructing a histogram
Constructing a histogram
 
BS_3Quartile Deviation.pptx
BS_3Quartile Deviation.pptxBS_3Quartile Deviation.pptx
BS_3Quartile Deviation.pptx
 
Statistics-Measures of dispersions
Statistics-Measures of dispersionsStatistics-Measures of dispersions
Statistics-Measures of dispersions
 
Yr7-RoundingApproximation.pptx
Yr7-RoundingApproximation.pptxYr7-RoundingApproximation.pptx
Yr7-RoundingApproximation.pptx
 

More from ValPatton

Tissue paper
Tissue paperTissue paper
Tissue paperValPatton
 
Graffetii Style Name
Graffetii Style NameGraffetii Style Name
Graffetii Style NameValPatton
 
Ancient rome powerpoint
Ancient rome powerpointAncient rome powerpoint
Ancient rome powerpointValPatton
 
Stem and-leaf plots
Stem and-leaf plotsStem and-leaf plots
Stem and-leaf plotsValPatton
 
Distance time graphs
Distance time graphsDistance time graphs
Distance time graphsValPatton
 
Comparingempiresfinalpdf (1)
Comparingempiresfinalpdf (1)Comparingempiresfinalpdf (1)
Comparingempiresfinalpdf (1)ValPatton
 
Boxand whiskerplotpowerpoint
Boxand whiskerplotpowerpointBoxand whiskerplotpowerpoint
Boxand whiskerplotpowerpointValPatton
 

More from ValPatton (8)

Tissue paper
Tissue paperTissue paper
Tissue paper
 
Lettering 2
Lettering 2Lettering 2
Lettering 2
 
Graffetii Style Name
Graffetii Style NameGraffetii Style Name
Graffetii Style Name
 
Ancient rome powerpoint
Ancient rome powerpointAncient rome powerpoint
Ancient rome powerpoint
 
Stem and-leaf plots
Stem and-leaf plotsStem and-leaf plots
Stem and-leaf plots
 
Distance time graphs
Distance time graphsDistance time graphs
Distance time graphs
 
Comparingempiresfinalpdf (1)
Comparingempiresfinalpdf (1)Comparingempiresfinalpdf (1)
Comparingempiresfinalpdf (1)
 
Boxand whiskerplotpowerpoint
Boxand whiskerplotpowerpointBoxand whiskerplotpowerpoint
Boxand whiskerplotpowerpoint
 

Recently uploaded

Unit-V; Pricing (Pharma Marketing Management).pptx
Unit-V; Pricing (Pharma Marketing Management).pptxUnit-V; Pricing (Pharma Marketing Management).pptx
Unit-V; Pricing (Pharma Marketing Management).pptxVishalSingh1417
 
How to Give a Domain for a Field in Odoo 17
How to Give a Domain for a Field in Odoo 17How to Give a Domain for a Field in Odoo 17
How to Give a Domain for a Field in Odoo 17Celine George
 
microwave assisted reaction. General introduction
microwave assisted reaction. General introductionmicrowave assisted reaction. General introduction
microwave assisted reaction. General introductionMaksud Ahmed
 
ICT Role in 21st Century Education & its Challenges.pptx
ICT Role in 21st Century Education & its Challenges.pptxICT Role in 21st Century Education & its Challenges.pptx
ICT Role in 21st Century Education & its Challenges.pptxAreebaZafar22
 
The basics of sentences session 3pptx.pptx
The basics of sentences session 3pptx.pptxThe basics of sentences session 3pptx.pptx
The basics of sentences session 3pptx.pptxheathfieldcps1
 
Python Notes for mca i year students osmania university.docx
Python Notes for mca i year students osmania university.docxPython Notes for mca i year students osmania university.docx
Python Notes for mca i year students osmania university.docxRamakrishna Reddy Bijjam
 
This PowerPoint helps students to consider the concept of infinity.
This PowerPoint helps students to consider the concept of infinity.This PowerPoint helps students to consider the concept of infinity.
This PowerPoint helps students to consider the concept of infinity.christianmathematics
 
Measures of Central Tendency: Mean, Median and Mode
Measures of Central Tendency: Mean, Median and ModeMeasures of Central Tendency: Mean, Median and Mode
Measures of Central Tendency: Mean, Median and ModeThiyagu K
 
Explore beautiful and ugly buildings. Mathematics helps us create beautiful d...
Explore beautiful and ugly buildings. Mathematics helps us create beautiful d...Explore beautiful and ugly buildings. Mathematics helps us create beautiful d...
Explore beautiful and ugly buildings. Mathematics helps us create beautiful d...christianmathematics
 
Activity 01 - Artificial Culture (1).pdf
Activity 01 - Artificial Culture (1).pdfActivity 01 - Artificial Culture (1).pdf
Activity 01 - Artificial Culture (1).pdfciinovamais
 
Micro-Scholarship, What it is, How can it help me.pdf
Micro-Scholarship, What it is, How can it help me.pdfMicro-Scholarship, What it is, How can it help me.pdf
Micro-Scholarship, What it is, How can it help me.pdfPoh-Sun Goh
 
Presentation by Andreas Schleicher Tackling the School Absenteeism Crisis 30 ...
Presentation by Andreas Schleicher Tackling the School Absenteeism Crisis 30 ...Presentation by Andreas Schleicher Tackling the School Absenteeism Crisis 30 ...
Presentation by Andreas Schleicher Tackling the School Absenteeism Crisis 30 ...EduSkills OECD
 
Measures of Dispersion and Variability: Range, QD, AD and SD
Measures of Dispersion and Variability: Range, QD, AD and SDMeasures of Dispersion and Variability: Range, QD, AD and SD
Measures of Dispersion and Variability: Range, QD, AD and SDThiyagu K
 
ComPTIA Overview | Comptia Security+ Book SY0-701
ComPTIA Overview | Comptia Security+ Book SY0-701ComPTIA Overview | Comptia Security+ Book SY0-701
ComPTIA Overview | Comptia Security+ Book SY0-701bronxfugly43
 
psychiatric nursing HISTORY COLLECTION .docx
psychiatric  nursing HISTORY  COLLECTION  .docxpsychiatric  nursing HISTORY  COLLECTION  .docx
psychiatric nursing HISTORY COLLECTION .docxPoojaSen20
 
Unit-IV- Pharma. Marketing Channels.pptx
Unit-IV- Pharma. Marketing Channels.pptxUnit-IV- Pharma. Marketing Channels.pptx
Unit-IV- Pharma. Marketing Channels.pptxVishalSingh1417
 
General Principles of Intellectual Property: Concepts of Intellectual Proper...
General Principles of Intellectual Property: Concepts of Intellectual  Proper...General Principles of Intellectual Property: Concepts of Intellectual  Proper...
General Principles of Intellectual Property: Concepts of Intellectual Proper...Poonam Aher Patil
 
Role Of Transgenic Animal In Target Validation-1.pptx
Role Of Transgenic Animal In Target Validation-1.pptxRole Of Transgenic Animal In Target Validation-1.pptx
Role Of Transgenic Animal In Target Validation-1.pptxNikitaBankoti2
 

Recently uploaded (20)

Unit-V; Pricing (Pharma Marketing Management).pptx
Unit-V; Pricing (Pharma Marketing Management).pptxUnit-V; Pricing (Pharma Marketing Management).pptx
Unit-V; Pricing (Pharma Marketing Management).pptx
 
How to Give a Domain for a Field in Odoo 17
How to Give a Domain for a Field in Odoo 17How to Give a Domain for a Field in Odoo 17
How to Give a Domain for a Field in Odoo 17
 
microwave assisted reaction. General introduction
microwave assisted reaction. General introductionmicrowave assisted reaction. General introduction
microwave assisted reaction. General introduction
 
ICT Role in 21st Century Education & its Challenges.pptx
ICT Role in 21st Century Education & its Challenges.pptxICT Role in 21st Century Education & its Challenges.pptx
ICT Role in 21st Century Education & its Challenges.pptx
 
The basics of sentences session 3pptx.pptx
The basics of sentences session 3pptx.pptxThe basics of sentences session 3pptx.pptx
The basics of sentences session 3pptx.pptx
 
Python Notes for mca i year students osmania university.docx
Python Notes for mca i year students osmania university.docxPython Notes for mca i year students osmania university.docx
Python Notes for mca i year students osmania university.docx
 
This PowerPoint helps students to consider the concept of infinity.
This PowerPoint helps students to consider the concept of infinity.This PowerPoint helps students to consider the concept of infinity.
This PowerPoint helps students to consider the concept of infinity.
 
Measures of Central Tendency: Mean, Median and Mode
Measures of Central Tendency: Mean, Median and ModeMeasures of Central Tendency: Mean, Median and Mode
Measures of Central Tendency: Mean, Median and Mode
 
Explore beautiful and ugly buildings. Mathematics helps us create beautiful d...
Explore beautiful and ugly buildings. Mathematics helps us create beautiful d...Explore beautiful and ugly buildings. Mathematics helps us create beautiful d...
Explore beautiful and ugly buildings. Mathematics helps us create beautiful d...
 
Activity 01 - Artificial Culture (1).pdf
Activity 01 - Artificial Culture (1).pdfActivity 01 - Artificial Culture (1).pdf
Activity 01 - Artificial Culture (1).pdf
 
Micro-Scholarship, What it is, How can it help me.pdf
Micro-Scholarship, What it is, How can it help me.pdfMicro-Scholarship, What it is, How can it help me.pdf
Micro-Scholarship, What it is, How can it help me.pdf
 
Presentation by Andreas Schleicher Tackling the School Absenteeism Crisis 30 ...
Presentation by Andreas Schleicher Tackling the School Absenteeism Crisis 30 ...Presentation by Andreas Schleicher Tackling the School Absenteeism Crisis 30 ...
Presentation by Andreas Schleicher Tackling the School Absenteeism Crisis 30 ...
 
Asian American Pacific Islander Month DDSD 2024.pptx
Asian American Pacific Islander Month DDSD 2024.pptxAsian American Pacific Islander Month DDSD 2024.pptx
Asian American Pacific Islander Month DDSD 2024.pptx
 
Measures of Dispersion and Variability: Range, QD, AD and SD
Measures of Dispersion and Variability: Range, QD, AD and SDMeasures of Dispersion and Variability: Range, QD, AD and SD
Measures of Dispersion and Variability: Range, QD, AD and SD
 
ComPTIA Overview | Comptia Security+ Book SY0-701
ComPTIA Overview | Comptia Security+ Book SY0-701ComPTIA Overview | Comptia Security+ Book SY0-701
ComPTIA Overview | Comptia Security+ Book SY0-701
 
psychiatric nursing HISTORY COLLECTION .docx
psychiatric  nursing HISTORY  COLLECTION  .docxpsychiatric  nursing HISTORY  COLLECTION  .docx
psychiatric nursing HISTORY COLLECTION .docx
 
Unit-IV- Pharma. Marketing Channels.pptx
Unit-IV- Pharma. Marketing Channels.pptxUnit-IV- Pharma. Marketing Channels.pptx
Unit-IV- Pharma. Marketing Channels.pptx
 
General Principles of Intellectual Property: Concepts of Intellectual Proper...
General Principles of Intellectual Property: Concepts of Intellectual  Proper...General Principles of Intellectual Property: Concepts of Intellectual  Proper...
General Principles of Intellectual Property: Concepts of Intellectual Proper...
 
Role Of Transgenic Animal In Target Validation-1.pptx
Role Of Transgenic Animal In Target Validation-1.pptxRole Of Transgenic Animal In Target Validation-1.pptx
Role Of Transgenic Animal In Target Validation-1.pptx
 
INDIA QUIZ 2024 RLAC DELHI UNIVERSITY.pptx
INDIA QUIZ 2024 RLAC DELHI UNIVERSITY.pptxINDIA QUIZ 2024 RLAC DELHI UNIVERSITY.pptx
INDIA QUIZ 2024 RLAC DELHI UNIVERSITY.pptx
 

Boxand whiskerplotsandhandoutmathpowerpoint

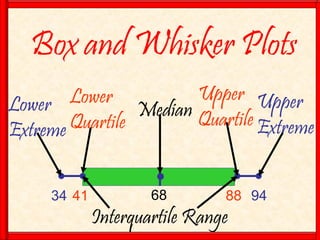
  • 1. Box and Whisker Plots 34 41 68 88 94 Median Lower Quartile Lower Extreme Upper Quartile Upper Extreme Interquartile Range
  • 2. Box-and-Whisker Plots • A box-and-whisker-plot is a data display that divides data values into four parts. Ordered data are divided into a lower and upper half by the median.
  • 3. Making a Box-and-Whisker Plot Roller Coaster Heights (m) 35 42 44 60 60 70 76 78 81 100 Median = Lower half Upper half 35 42 44 60 60 70 76 78 81 100 Lower Quartile Upper Quartile 30 40 50 60 70 80 90 100 110 35 44 65 78 100 Lower Extreme Upper Extreme 60 42 100 81 78 70 60 76 44 35 Put in order from least to greatest. (60 + 70) ÷ 2 = 65
  • 4. Roller Coaster Heights w/ Top Thrill Dragster (m) 35 42 44 60 60 70 76 78 81 420 Median = Lower half Upper half 35 42 44 60 60 70 76 78 81 420 Lower Quartile Upper Quartile 0 50 100 150 200 250 300 350 400 35 44 65 78 Lower Extreme Upper Extreme 420 60 42 420 81 78 70 60 76 44 35 Put in order from least to greatest. (60 + 70) ÷ 2 = 65
  • 5. Runs scored by the Indians over 10 games 0 2 3 4 4 8 8 9 10 16 Median = Lower half = 6 Lower Quartile Upper Quartile 0 2 4 6 8 10 12 14 16 0 3 6 9 16 0 2 3 4 4 8 8 9 10 16 3 10 8 4 9 16 8 0 2 4 (4+ 8) ÷ 2 Upper half Put in order from least to greatest. Lower Extreme Upper Extreme
  • 6. Median = (65+ 71) ÷ 2 = 68 Lower half Upper half Lower Quartile Upper Quartile 30 40 50 60 70 80 90 100 34 41 68 88 94 34 38 40 41 42 50 65 71 82 87 88 91 93 94 Homework Put in order from least to greatest. 40 71 82 42 94 88 65 50 38 91 34 93 41 87 34 38 40 41 42 50 65 71 82 87 88 91 93 94 Lower Extreme Upper Extreme
  • 7. Making a Box-and-Whisker Plot Median = (65+ 71) ÷ 2 = 68 34 41 68 88 94 Homework Put in order from least to greatest. 40 71 82 42 94 88 65 50 38 91 34 93 41 87 34 38 40 41 42 50 65 71 82 87 88 91 93 94 Median Lower Quartile Lower Extreme Upper Quartile Upper Extreme Interquartile Range
  • 8. The following 4 slides could be used as student worksheets. Go to: 1. File 2. Print 3. Slides: 9-12 4. Print what: Handouts 5. Slides per page: 2 6. Order: Horizontal 7. Color/Grayscale: Grayscale 8. Frame slides 9. Let me know if this print method is not possible for your download.
  • 9. Making a Box-and-Whisker Plot Median = Roller Coaster Heights (ft.) 60 42 100 81 78 70 60 76 44 35Put in order from least to greatest.
  • 10. Median = Put in order from least to greatest. Roller Coaster Heights w/ Top Thrill Dragster (ft.) 60 42 420 81 78 70 60 76 44 35
  • 11. Runs scored by the Indians over 10 games Median = 3 10 8 4 9 16 8 0 2 4 Put in order from least to greatest.
  • 12. Median = Put in order from least to greatest. Homework 40 71 82 42 94 88 65 50 38 91 34 93 41 87