The East african oil & gas market 2013 2023
•
0 j'aime•817 vues

For more information on this report please contact ediz.ibrahim@visiongain.com (+44 (0)20 7549 9976) or refer to our website http://www.visiongain.com/Report/1045/The-East-African-Oil-Gas-Market-2013-2023

Recommandé
Recommandé
Contenu connexe
Dernier
Dernier (20)
En vedette
En vedette (20)
The East african oil & gas market 2013 2023
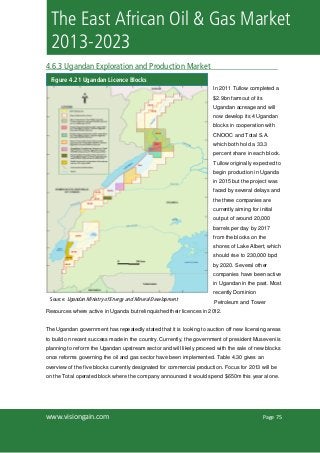
- 1. Page 75www.visiongain.com The East African Oil & Gas Market 2013-2023 4.6.3 Ugandan Exploration and Production Market In 2011 Tullow completed a $2.9bn farmout of its Ugandan acreage and will now develop its 4 Ugandan blocks in cooperation with CNOOC and Total S.A. which both hold a 33.3 percent share in each block. Tullow originally expected to begin production in Uganda in 2015 but the project was faced by several delays and the three companies are currently aiming for initial output of around 20,000 barrels per day by 2017 from the blocks on the shores of Lake Albert, which should rise to 230,000 bpd by 2020. Several other companies have been active in Ugandan in the past. Most recently Dominion Petroleum and Tower Resources where active in Uganda but relinquished their licences in 2012. The Ugandan government has repeatedly stated that it is looking to auction off new licensing areas to build on recent success made in the country. Currently, the government of president Museveni is planning to reform the Ugandan upstream sector and will likely proceed with the sale of new blocks once reforms governing the oil and gas sector have been implemented. Table 4.30 gives an overview of the five blocks currently designated for commercial production. Focus for 2013 will be on the Total operated block where the company announced it would spend $650m this year alone. Figure 4.21 Ugandan Licence Blocks Source: Ugandan Ministry of Energy and Mineral Development
- 2. Page 78www.visiongain.com The East African Oil & Gas Market 2013-2023 4.7 Kenyan Oil & Gas Market Forecast 2013-2023 Table 4.33, Figures 4.22 and 4.23 show visiongain’s forecast for the Kenyan oil & gas market over the next ten years. 2012 2013 2014 2015 2016 2017 2018 2019 2020 2021 2022 2023 2013-23 Capex $m 150 441 707 1,280 1,581 2,014 1,813 1,971 2,203 2,511 2,971 3,363 20,853 AGR (%) 193.8 60.4 81.0 23.5 27.4 -10.0 8.7 11.8 14.0 18.3 13.2 2018-23 13.2 22.5 32.7CAGR (%) 2013-18 CAGR (%) 2013-23 -50% 0% 50% 100% 150% 200% 0 500 1,000 1,500 2,000 2,500 3,000 3,500 2012 2013 2014 2015 2016 2017 2018 2019 2020 2021 2022 2023 AGR Capex$m Year Source: Visiongain 2013 Table 4.33 Kenyan Oil & Gas Market Forecast 2013-2023 ($m, AGR%, CAGR%, Cumulative) Source: Visiongain 2013 Figure 4.22 Kenyan Oil & Gas Market Forecast 2013-2023 ($m, AGR%)
- 3. Page 104www.visiongain.com The East African Oil & Gas Market 2013-2023 In the World Bank’s Doing Business 2013 ranking Ethiopia was the third best East African country, behind Uganda and Kenya. In the Global Competitiveness Report and the Corruption Perception Index it was ranked second best in East Africa. The Governance Indicators further support the case that Ethiopia, despite severe problems with security and political stability, has done a better job than most countries in the region with regard to establishing a stable business environment through efficient institutions and comparatively low levels of corruption. 4.9.3 Ethiopian Oil & Gas Market Summary Ethiopia will remain the smallest market throughout the forecast period. While it has proven gas reserves these are located in one of the most remote and dangerous areas in the country and exploration in the Ogaden region will thus progress very slowly. Currently, Tullow is the only company actively drilling in Ethiopia. The company’s well near the southern border with Kenya shows similar geographical characteristics and the company is hopeful that it will encounter oil rich plays. Apart from Tullow most companies are in the early stages of development and will only start drilling in the coming years. Ethiopia possesses both gas and oil potential and exploration will increase significantly over the next decade. With the current security and economic situation in the country however the oil and gas market will trail behind the rest of East Africa for the foreseeable future. Table 4.55 provides and overview of the current companies active in Ethiopia and the licence blocks they are operating on while Table 4.56 lists the major drivers and restraints of the Ethiopian oil and gas market. Operator Block km2 Other Companies Status Southwest Energy Gambella Basin 17,000 full tensor gravity & magnetic surveys Tullow Oil South Omo 29,465 Africa Oil (30%) Marathon Oil (20%) started drilling Sabisa-1 in December 2012 Falcon Petroleum AB1 seismic survey Falcon Petroleum AB4, AB7 New Age 7, 8 23,162 Afren (30%) Africa Oil (30%) Exploration drilling in2013 Africa Oil Adigala 27,193 Africa Oil Rift Basin Area 42,519 Environmental Impact Assessment Pexco 18, 19, 21 Southwest Energy Jimma 13,000 PSA awaiting approval of ministry Southwest Energy 9, 9A, 13 29,000 A 3-well drilling program is scheduled for 2013-2014 Table 4.55 Ethiopian Licence Blocks (Operator, Block, km2, Other Companies, Status) Source: Visiongain 2013
- 4. Page 109www.visiongain.com The East African Oil & Gas Market 2013-2023 6. Major Companies in the East African Oil & Gas Market Figure 6.1 Major Companies in the East African Market 2013-2023 Ranking Tier 1 • Anadarko • BG Group • DAR Petroleum Operating Company Ltd • ENI • Sasol • Statoil • Total S.A. • Petronas • Shell • Sudd Petroleum Operating Company Ltd • Africa Oil Corp. • Apache Energy • CNOOC • CNPC • Greater Pioneer Operating Company • Heritage Oil • Maurel & Prom • Ophir Energy • PanAfrican Energy • Petrobras Tier 2 Tier 3• Imara Energy • Jacka Resources • Kalila Energi • Motherland Industries Ltd • New Age Ltd • Ndovu Resources • Pacific Seaboard Investments • Petrodel • Adamantine Energy • Afren plc • Antrim Energy Inc. • A-Z Petroleum, • Beach Energy • Camac • Dodsal • Edgo Energy • Falcon Petroleum • FAR Limited • Hydrotanz • Pexco • Rift Energy • Simba Energy • Sohi Gas Dodori • Sohi Gas Lamu • Southwest Energy • Star Petroleum • Swala Energy • Taipan Resources • Vanoil Source: Visiongain 2013
- 5. Page 122www.visiongain.com The East African Oil & Gas Market 2013-2023 6.2 Tier Two Company Overview Africa Oil Corporation • Operator of two blocks in Ethiopia; 30 percent share in Tullow’s South Omo block • First well on South Omo encountered hydrocarbons • 2 more wells on South Omo block planned for 2013 • Environmental Impact Assessment for Rift Basin Area in Ethiopia • Operator of Block 10BB in Kenya and working interest in 4 of Tullow’s Blocks in Kenya • Blocks 10BB and 13T encountered 100 and 30 metres of net oil pay respectively • Tullow and Africa Oil plan to drill at least a further 5 exploration wells on 10BB and at least 4 on 13T in 2013 Operator Block km2 Other companies Country Tullow Oil South Omo 29,465 Africa Oil (30%), Marathon Oil (20%) Ethiopia Africa Oil Adigala 27,193 Ethiopia Africa Oil Rift Basin Area 42,519 Ethiopia Africa Oil 9 29,593 Marathon Oil (50%) Kenya Africa Oil 10BB 8,835 Tullow Oil (50%) Kenya Tullow Oil 10A 14,597 Africa Oil (20%) Kenya Tullow Oil 10BA 21,088 Africa Oil (50%) Kenya Tullow Oil 12A 20,341 Africa Oil (20%), Marathon Oil (15%) Kenya Tullow Oil 13 T 6,298 Africa Oil (50%) Kenya Apache Energy • Holds licence area L8 offshore Kenya; 5,114km2 • Mbawa-1 drilled first well in Q4/2012; encountered 52 metres of gas • Will analyse data to determine future exploration activities • 2 appraisal wells planned in 2013 CNOOC • Holds 33.3% interest in 4 Ugandan blocks • Will develop Ugandan oil reserves in cooperation with Total and Tullow • Operator of Block EA3A • No drilling planned on EA3A in 2013 Table 6.16 Africa Oil’s East African Operations Overview (Operator, Block, km2, Other Companies, Country) Source: Visiongain 2013