Gran Tierra Energy Stock Report
•
0 j'aime•352 vues

The document provides an investor scorecard for Gran Tierra Energy Inc. as of September 27, 2010. Some key points: - Gran Tierra Energy is an independent energy company engaged in oil and gas exploration, development and production in Colombia, Argentina and Peru. - As of September 2010, the company had a market capitalization of $1.677 billion, with no long-term debt and $311.6 million in cash. - The company has exploration and production operations on 32 blocks totaling 8.4 million net acres. It is the operator on 29 of these blocks. - Gran Tierra Energy has an ongoing drilling program with wells planned in Colombia, Peru, Argentina and Brazil

Recommandé
Contenu connexe
Tendances
Tendances (16)
En vedette
En vedette (11)
Similaire à Gran Tierra Energy Stock Report
Similaire à Gran Tierra Energy Stock Report (20)
Plus de Waggle, a TSX Community
Dernier
Dernier (20)
Gran Tierra Energy Stock Report
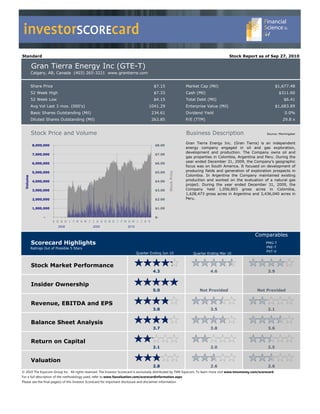
- 1. investorSCOREcard Standard Stock Report as of Sep 27, 2010 Gran Tierra Energy Inc (GTE-T) Calgary, AB, Canada (403) 265-3221 www.grantierra.com Share Price $7.15 Market Cap (Mil) $1,677.48 52 Week High $7.33 Cash (Mil) $311.60 52 Week Low $4.15 Total Debt (Mil) $6.41 Avg Vol Last 3 mos. (000's) 1041.29 Enterprise Value (Mil) $1,683.89 Basic Shares Outstanding (Mil) 234.61 Dividend Yield 0.0% Diluted Shares Outstanding (Mil) 263.85 P/E (TTM) 29.8 x Stock Price and Volume Business Description Source: Morningstar Gran Tierra Energy Inc. (Gran Tierra) is an independent 8,000,000 $8.00 energy company engaged in oil and gas exploration, development and production. The Company owns oil and 7,000,000 $7.00 gas properties in Colombia, Argentina and Peru. During the 6,000,000 $6.00 year ended December 31, 2009, the Company’s geographic focus was on South America. It focused on development of 5,000,000 $5.00 Stock Price producing fields and generation of exploration prospects in Colombia. In Argentina the Company maintained existing Volume 4,000,000 $4.00 production and worked on the evaluation of a natural gas project. During the year ended December 31, 2009, the 3,000,000 $3.00 Company held 1,056,803 gross acres in Colombia, 1,628,473 gross acres in Argentina and 3,436,040 acres in 2,000,000 $2.00 Peru. 1,000,000 $1.00 - $- S O N D J F M A M J J A S O N D J F M A M J J A S 2008 2009 2010 Comparables Scorecard Highlights PMG-T Ratings Out of Possible 5 Stars PRE-T PXT-V Quarter Ending Jun 10 Quarter Ending Mar 10 Stock Market Performance 4.3 4.6 3.9 Insider Ownership 5.0 Not Provided Not Provided Revenue, EBITDA and EPS 3.8 3.5 2.1 Balance Sheet Analysis 3.7 3.8 3.6 Return on Capital 2.1 2.0 2.5 Valuation 2.8 2.6 2.6 © 2010 The Equicom Group Inc. All rights reserved. The Investor Scorecard is exclusively distributed by TMX Equicom. To learn more visit www.tmxmoney.com/scorecard For a full description of the methodology used, refer to www.fsavaluation.com/scorecardinformation.aspx Please see the final page(s) of this Investor Scorecard for important disclosure and disclaimer information.
- 2. investorSCOREcard Gran Tierra Energy Inc (GTE-T) Market Overview and Opportunity Due to the global economic recession, world primary energy consumption dropped 1.1%, the largest percentage- based decline since 1980. In 2009, Global oil production fell by 2 million barrels per day (2.6%), representing the largest decline since 1982. Natural gas experienced the greatest decline in use on record with consumption falling by 2.1%. South and Central America is targeted to have proved crude oil reserves of 198.9 billion barrels and proved natural gas reserves of 8.06 trillion cubic metres (BP Statistical Review of World Energy, June 2010). Overview of Projects Gran Tierra Energy is currently undertaking exploration and production operations in Colombia, Peru and Argentina. Pending regulatory approval on 10 blocks, the company has a working interest in 32 blocks in Colombia, Argentina, Peru and Brazil encompassing approximately 8.4 million net acres, and is the operator of 29 of these contract areas: • Costayaco Field, Putumayo Basin, Columbia, reserves and production platform: light and medium oil reserves, 100% working interest and operator; current production capacity of 19,000 barrels of oil per day gross • Putumayo Basin, Columbia exploration program: 9 blocks, 719,321 gross acres, 384,328 net acres, includes the Moqueta oil discovery • Aquitos Arch, Peru exploration program: 5 blocks, 4.8 million net acres, blocks - 122 and 128 are 100% working interest • Valle Morado Field, Noroeste Basin, Argentina production and exploration program: oil production of approximately 800 barrels of oil per day net after royalty, net 1.3 million acres with gas potential, primary exploration landholder • New ventures business development in Brazil: Reconcavo opportunity-rich basin, 70% working interest in 4 blocks pending regulatory approval Growth Strategy Gran Tierra Energy’s strategy focuses on establishing a portfolio of producing properties, plus production enhancement and exploration opportunities to provide a base for future growth. Gran Tierra Energy's plan for growth is a building block approach: • Move aggressively to establish a base of production/cash flow, development and exploration opportunities • Build and consolidate regional positions, leverage and expand strategic relationships • Add value through drilling
- 3. investorSCOREcard Gran Tierra Energy Inc (GTE-T) Progress and Milestones • Ongoing production in Costayaco Field • Columbia drilling program for 2010-2011 currently includes 13 wells with net risked prospective resource potential of 32 million barrels of oil • Peru drilling program for 2010-2011 includes 4 exploration wells with net risked prospective resource potential of 146 million barrels of oil • Argentina drilling program for 2010-2011 includes 1 gas exploration well, ongoing oil production • Brazil drilling program for 2010-2011 includes 2 exploration wells with rig mobilization initiated Investment Highlights • 20 wells planned in the 2010-2011 drilling program • 22.1 million barrels of oil of proved reserves at the end of 2009 • 14,000 to 16,000 barrels of oil per day (2010 Production Guidance, Net After Royalty) • Strong cash flow, no debt • High working interest in 32 blocks totaling 8.4 million net acres of land • Strong balance sheet with $293 million in cash and cash equivalents as at June 30, 2010 Management Dana Coffield President & Chief Executive Officer Martin Eden Chief Financial Officer Shane O'Leary Chief Operating Officer Rafael Orunesu President, Gran Tierra Energy Argentina Julian Garcia President, Gran Tierra Energy Colombia Júlio César Moreira President, Gran Tierra Energy Brasil
- 4. investorSCOREcard Gran Tierra Energy Inc (GTE-T) Comparables Petrominerales (PMG-T) Pacific Rubiales (PRE-T) Parex (PXT-T)
- 5. investorSCOREcard Gran Tierra Energy Inc (GTE-T) Stock Market Performance Rating 4.3 Stock Market Returns 1,800,000 $8.00 Return Percentile Rating 1,600,000 $7.00 Three Months 31% 82% 4.1 1,400,000 Six Months 19% 74% 3.7 $6.00 Stock Price 1 Year 61% 100% 5.0 1,200,000 Volume $5.00 3 Years (CAGR) 1,000,000 5 Years (CAGR) $4.00 800,000 $3.00 Market Data 600,000 Price $7.15 $2.00 400,000 Mkt Cap (Mil) $1,677.48 Shs Outstanding (Mil) 234.61 200,000 $1.00 Dividend Yield % 0.0% Avg Vol Last 3mos. (000's) 1,041.29 - $- 2008 2009 2010 P/E (TTM) 29.8 x Insider Ownership Rating 5.0 Value of Shares and Options Percent of Ownership Shares Options Total Value Rating Percent Rating 5.0% Insiders * Adjusted 0.0% > 10% Holders # of # of $ Value if Adjusted $ $ Value $ Value if Rating Percent of Rating 95.0% Other Shares Options Exercised Value Exercised (Add all) Mkt. Value (Add all) Dana Coffield 1,801,328 $12,879,495 1,240,835 $8,871,970 $4,435,985 $17,315,480 4.0 0.9% 0.2 President and CEO Martin Eden Oct-10 14,000 $100,100 720,300 $5,150,145 $2,575,073 $2,675,173 1.1 0.1% 0.0 CFO Aug-10 Other Officers 3,530,322 $25,241,802 2,253,328 $16,111,295 $8,055,648 $33,297,450 4.0 1.8% 0.4 Jun-10 Apr-10 Board of Directors (excl. CEO) 4,409,328 $31,526,695 2,777,499 $19,859,118 $9,929,559 $41,456,254 4.0 2.2% 0.4 Feb-10 Dec-09 > 10% Holders - $0 - $0 $0 $0 0.0% For info only Oct-09 Total (excl. >10% Holders) $69,748,093 $49,992,528 $24,996,264 $94,744,357 4.0 5.0% 1.0 0% 20% 40% 60% 80% 100% (Max of 4) (Max of 4) CEO CFO Other Officers Directors > 10% Holders Public Float * Adjusted $ Value of Options is 50% of their full value if exercised to account for volatility. Furthermore, our view is that shareholders would rather management owned shares vs. options. Add: Compensation Type Category Rating Addition Percent of Compensation Share and Total Perform- Share and Salary Perform- Unit Option All Other Comp. ance Unit Option 2.0% ance Bonus Awards Awards Comp. Bonus Awards Awards Dana Coffield 24.1% Salary $286,642 $171,234 $0 $0 $2,326 $460,202 0.25 0.5 0.25 President and CEO Bonus Martin Eden Shares & Units $239,824 $136,389 $2,326 $378,539 0.25 CFO Options Shane O'Leary All Other $222,944 $147,131 $716,563 $1,733 $1,088,371 0.25 0.25 VP 59.7% 14.1% Julian Garcia 0.0% $19,959 $1,048,404 $0 $1,068,363 0.25 President Gran Tierra Columbia Julio Moreira $87,069 $45,661 $356,190 $65,857 $554,777 0.25 0.25 President Gran Tierra Brasil Ltda. Total $856,438 $500,415 $0 $2,121,157 $72,242 $3,550,252 0.25 0.50 0.25 (Max Score) Bonus: Net Buying/Selling Last Six Months Insider Holdings Beginning and Ending Value Transactions Adjusted Share and $120,000,000 Rating $100,000,000 Option Value Buying Selling Net Bonus $80,000,000 $60,000,000 Dana Coffield, President and CEO $0 $192,500 -$192,500 0.00 Martin Eden, CFO $0 $0 $0 0.00 $40,000,000 Other Officers $0 $10,000 -$10,000 0.00 $20,000,000 Board of Directors (excl. CEO) $0 $296,218 -$296,218 0.00 $- > 10% Holders (info only) $0 $0 $0 Total (excl. >10% Holders) $0 $498,718 -$498,718 0.00 (Total Score) Beg Trans- Ending Value actions Value
- 6. investorSCOREcard Gran Tierra Energy Inc (GTE-T) Balance Sheet Analysis Rating 3.7 Short-Term Liquidity Quadrant 3: Quadrant 1: "RECOVERING" "OPTIMAL" $ 300.0 + VE $ 250.0 Mar-10 Dec-09 Jun-10 $ 200.0 Quadrant Rating Jun-09 Sep-09 Dec-09 Mar-10 Jun-10 $ 150.0 Working Capital $ 176.9 $ 202.6 $ 225.6 $ 270.9 $ 296.2 $ 100.0 Sep-09 Cash Flow Ops (Q in mil) $ 15.0 $ 24.1 $ 59.9 $ 63.8 $ 58.0 Cash Flow Jun-09 Cash Flow Ops (Ann Q's in mil) $ 60.1 $ 96.5 $ 239.6 $ 255.2 $ 231.9 $ 50.0 Quadrant Rating 4.0 4.0 4.0 4.0 4.0 $- ($50.0) Addition to Quadrant Rating Our methodology accounts for the 'nearness' to improving or worsening a Company's quadrant ($100.0) ranking based on current cash generation/burn rate and working capital position. The ($150.0) - VE Company's short term liquidity situation is OPTIMAL. At the current cash generation rate the ($175) ($75) $ 25 $ 125 $ 225 $ 325 Company's working capital will double in 15 month(s). Quadrant 2: Quadrant 4: "URGENT" "DRAWING DOWN" Add: 0.4 - VE Working Capital + VE Short-Term Liquidity Rating 4.4 Debt to Equity Jun-09 Sep-09 Dec-09 Mar-10 Jun-10 Utilities Telecom Equity Number of Companies Materials Common Stock Equity $ 907.8 $ 838.7 $ 855.9 $ 858.3 $ 920.1 Info Tech Industrials Total Equity $ 907.8 $ 838.7 $ 855.9 $ 858.3 $ 920.1 Health Care Energy Cons Staples Debt and Equivalents Cons Disc Pref. Securities of Sub Trust - - - - - Pref. Equity Outside Stock Equity - - - - - Preferred Stock Equity - - - - - Minority Interest (Bal. Sheet) - - - - - Short-Term Debt - - - - - Long-Term Debt - - - - - Capital Lease Obligations - - - - - Total Debt and Equivalents $ - $ - $ - $ - $ - 0.00 1.00 2.00 3.00 4.00 Debt to Equity 0.00 0.00 0.00 0.00 0.00 Debt to Equity Rating 3.1 Low Risk Debt to Equity High Risk Debt to Equity Rating 3.1 Interest Coverage Jun-09 Sep-09 Dec-09 Mar-10 Jun-10 1.0 x EBIT 0.9 x Interest Coverage Quarterly $ 11.3 $ 25.5 $ 31.1 $ 35.7 $ 35.0 0.8 x TTM $ 22.8 $ 21.9 $ 60.1 $ 103.6 $ 127.4 0.7 x N/A 0.6 x Interest Expense 0.5 x Quarterly - - - - - 0.4 x TTM - - - - - 0.3 x Interest Coverage 0.2 x Quarterly #N/A #N/A #N/A #N/A #N/A 0.1 x TTM #N/A #N/A #N/A #N/A #N/A 0.0 x Jun-09 Sep-09 Dec-09 Mar-10 Jun-10 Interest Coverage Rating Qtrly Interest Coverage Rating Quarterly TTM Interest Coverage Rating TTM Interest Coverage Rating N/A
- 7. investorSCOREcard Gran Tierra Energy Inc (GTE-T) Revenue, EBITDA and EPS Rating 3.8 Revenue (in millions) Revenue (in milions) on Rolling TTM $400.00 $350.00 Annual (Fiscal Year) Dec-07 Dec-08 Dec-09 $300.00 Revenue $ - $ - $ 32.1 $ 138.5 $ 276.5 $250.00 Quarterly Jun-09 Sep-09 Dec-09 Mar-10 Jun-10 Basis Quarter Ending $ 68.0 $ 80.9 $ 96.8 $ 94.5 $ 89.4 $200.00 TTM $ 177.4 $ 215.6 $ 287.9 $ 340.1 $ 361.5 $150.00 Growth Percent Rating Stability R² Rating $100.00 Rev. Growth % TTM 103.8% 5.0 $50.00 Rev. Growth % LFY 99.7% 5.0 Revenue Stability Last 2 Yrs Rev. Growth % 3 Year CAGR Revenue Stability Last 3 Yrs $- Rev. Growth % 5 Year CAGR Revenue Stability Last 5 Yrs Jun Jun Jun Jun Jun Jun Jun Jun Jun Jun Revenue Growth Rating 5.0 Overall Revenue Stability Rating 01 02 03 04 05 06 07 08 09 10 Revenue Growth and Stability Rating 5.0 EBITDA (in millions) EBITDA (in milions) on Rolling TTM $ 300.00 Annual (Fiscal Year) Dec-07 Dec-08 Dec-09 $ 250.00 EBITDA $ - $ - $ 11.1 $ 91.1 $ 202.4 $ 200.00 Quarterly Jun-09 Sep-09 Dec-09 Mar-10 Jun-10 Basis Quarter Ending $ 19.1 $ 33.3 $ 71.1 $ 76.7 $ 70.6 $ 150.00 TTM $ 53.5 $ 58.1 $ 123.5 $ 200.1 $ 251.7 $ 100.00 Growth Percent Rating Stability R² Rating EBITDA Growth % TTM 370.3% 5.0 $ 50.00 EBITDA Growth % LFY 122.3% 5.0 EBITDA Stability Last 2 Yrs EBITDA Grwth % 3 Yr CAGR EBITDA Stability Last 3 Yrs $- EBITDA Grwth % 5 Yr CAGR EBITDA Stability Last 5 Yrs Jun Jun Jun Jun Jun Jun Jun Jun Jun Jun EBITDA Growth Rating 5.0 Overall EBITDA Stablitity Rating 01 02 03 04 05 06 07 08 09 10 EBITDA Growth and Stability Rating 5.0 Basic Earnings Per Share (EPS*) $0.40 * (excluding acquired in process R&D, restructuring and M&A, special income & charges and discontinued ops) $0.30 Annual (Fiscal Year) Dec-07 Dec-08 Dec-09 EPS on Rolling TTM $0.20 EPS $ - $ - ($0.01) $ 0.23 $ 0.06 $0.10 Quarterly (TTM) Basis Jun-09 Sep-09 Dec-09 Mar-10 Jun-10 Quarter Ending ($0.14) ($0.01) $ 0.14 $ 0.04 $ 0.07 $- TTM ($0.11) ($0.33) ($0.01) $ 0.03 $ 0.24 ($0.10) Growth Percent Rating Stability R² Rating ($0.20) EPS Growth % TTM 318.2% 5.0 ($0.30) EPS Growth % LFY -73.9% 0.0 EPS Stability Last 2 Yrs 7.5% 0.4 EPS Grwth % 3 Year CAGR EPS Stability Last 3 Yrs ($0.40) EPS Grwth % 5 Year CAGR EPS Stability Last 5 Yrs Jun Jun Jun Jun Jun Jun Jun Jun Jun Jun EPS Growth Rating 2.5 Overall EPS Stablitity Rating 0.4 01 02 03 04 05 06 07 08 09 10 EPS Growth and Stability Rating 1.4
- 8. investorSCOREcard Gran Tierra Energy Inc (GTE-T) Return On Capital Rating 2.1 Return On Invested Capital (ROIC) 8% Annual (Fiscal Year) Dec-07 Dec-08 Dec-09 Invested Capital Period Ending $ 737.4 $ 737.4 $ 88.7 $ 1,226.8 $ 1,088.4 6% Average Invested Capital $ 737.4 $ 737.4 $ 413.0 $ 657.8 $ 1,157.6 4% ROIC on Rolling TTM * Net Income $ - $ - ($1.1) $ 28.5 $ 14.6 Add Back: After Tax Interest Expense $ - $ - $ - $ - $ - Annual ROIC -0.3% 4.3% 1.3% 2% Basis Level Rating 1.9 1.9 1.9 2.4 2.1 Consistency Rating 2.0 0% (2%) Quarterly (TTM) Jun-09 Sep-09 Dec-09 Mar-10 Jun-10 Invested Capital Period Ending $ 1,161.8 $ 1,094.7 $ 1,088.4 $ 1,085.9 $ 1,151.5 (4%) Average Invested Capital $ 766.0 $ 960.3 $ 1,146.7 $ 1,118.5 $ 1,116.5 * Net Income ($31.6) ($59.1) ($10.9) $ 7.1 $ 58.3 (6%) Add Back: After Tax Interest Expense $ - $ - $ - $ - $ - Quarterly ROIC -4.1% -6.2% -1.0% 0.6% 5.2% Level Rating 1.5 1.3 1.8 2.0 2.5 (8%) Consistency Rating 1.8 Jun Jun Jun Jun Jun Jun Jun Jun Jun Jun 01 02 03 04 05 06 07 08 09 10 Return on Invested Capital (ROIC) Rating 2.1 Return On Assets (ROA) 8% Annual (Fiscal Year) Dec-07 Dec-08 Dec-09 Total Assets Period Ending $ 737.4 $ 737.4 $ 112.0 $ 1,302.4 $ 1,199.1 6% Average Total Assets $ 737.4 $ 737.4 $ 424.7 $ 707.2 $ 1,250.7 4% ROA on Rolling TTM * Net Income $ - $ - ($1.1) $ 28.5 $ 14.6 Add Back: After Tax Interest Expense $ - $ - $ - $ - $ - Annual ROA -0.3% 4.0% 1.2% 2% Basis Level Rating 2.1 2.1 2.1 2.5 2.2 Consistency Rating 2.2 0% (2%) Quarterly (TTM) Jun-09 Sep-09 Dec-09 Mar-10 Jun-10 Total Assets Period Ending $ 1,226.9 $ 1,147.4 $ 1,199.1 $ 1,185.9 $ 1,261.3 (4%) Average Total Assets $ 828.5 $ 1,023.9 $ 1,220.5 $ 1,197.2 $ 1,204.1 * Net Income ($31.6) ($59.1) ($10.9) $ 7.1 $ 58.3 (6%) Add Back: After Tax Interest Expense $ - $ - $ - $ - $ - Quarterly ROA -4.1% -6.2% -1.0% 0.6% 5.2% Level Rating 1.7 1.5 2.0 2.1 2.6 (8%) Consistency Rating 2.0 Jun Jun Jun Jun Jun Jun Jun Jun Jun Jun 01 02 03 04 05 06 07 08 09 10 Return on Assets (ROA) Rating 2.2 Return On Common Equity (ROE) 10% Annual (Fiscal Year) Dec-07 Dec-08 Dec-09 8% Total Equity Period Ending $ - $ - $ 76.3 $ 961.5 $ 855.9 Average Common Equity $ - $ - $ 38.1 $ 518.9 $ 908.7 6% ROE on Rolling TTM * Net Income $ - $ - ($1.1) $ 28.5 $ 14.6 4% Add Back: NA $ - $ - $ - $ - $ - Annual ROE 5.5% 1.6% 2% Basis Level Rating 2.3 2.0 Consistency Rating 2.2 0% (2%) Quarterly (TTM) Jun-09 Sep-09 Dec-09 Mar-10 Jun-10 Total Equity Period Ending $ 907.8 $ 838.7 $ 855.9 $ 858.3 $ 920.1 (4%) Average Common Equity $ 606.4 $ 752.2 $ 894.3 $ 873.7 $ 876.2 (6%) * Net Income ($31.6) ($59.1) ($10.9) $ 7.1 $ 58.3 Add Back: NA $ - $ - $ - $ - $ - (8%) Quarterly ROE -5.2% -7.9% -1.2% 0.8% 6.7% Level Rating 1.5 1.3 1.8 1.9 2.4 (10%) Consistency Rating 1.8 Jun Jun Jun Jun Jun Jun Jun Jun Jun Jun 01 02 03 04 05 06 07 08 09 10 Return on Common Equity (ROE) Rating 2.1 * Net Income - Excludes Net Income from Discontinued Operations, Income Acquired in Process R&D, Income Restructuring And M&A, and Other Special Income/(Charges)
- 9. investorSCOREcard Gran Tierra Energy Inc (GTE-T) Valuation Rating 2.8 Price to Earnings (P/E) 200.0 x (Lower numbers receive higher rankings) 180.0 x Annual (Fiscal Year) Dec-07 Dec-08 Dec-09 160.0 x * Price $ - $ 3.07 $ 5.80 P/E on Rolling TTM Earnings Per Share (EPS) $ - $ - ($0.01) $ 0.23 $ 0.06 140.0 x 120.0 x Annual P/E 13.3 x 96.7 x Basis Annual P/E Rating 3.4 0.0 100.0 x 80.0 x Quarterly (TTM) Jun-09 Sep-09 Dec-09 Mar-10 Jun-10 * Price $ 4.52 $ 6.00 $ 5.80 $ 5.41 $ 7.18 60.0 x Earnings Per Share (EPS) ($0.11) ($0.33) ($0.01) $ 0.03 $ 0.24 40.0 x Quarterly (TTM) P/E 180.3 x 29.9 x 20.0 x Quarterly (TTM) P/E Rating 1.2 0.0 x Jun Jun Jun Jun Jun Jun Jun Jun Jun Jun 01 02 03 04 05 06 07 08 09 10 Price to Earnings (P/E) 0.6 Price to Book (P/Book) 2.0 x (Lower numbers receive higher rankings) 1.8 x Annual (Fiscal Year) Dec-07 Dec-08 Dec-09 1.6 x P/Book on Quarterly * Price $ - $ 3.07 $ 5.80 Book Equity Per Share $ 0.95 $ 5.05 $ 3.90 1.4 x 1.2 x Annual P/Book 0.6 x 1.5 x Basis Annual P/Book Rating 4.8 4.5 3.9 1.0 x 0.8 x Quarterly Jun-09 Sep-09 Dec-09 Mar-10 Jun-10 * Price $ 4.52 $ 6.00 $ 5.80 $ 5.41 $ 7.18 0.6 x Book Equity Per Share $ 4.34 $ 3.90 $ 3.90 $ 3.68 $ 3.92 0.4 x Quarterly P/Book 1.0 x 1.5 x 1.5 x 1.5 x 1.8 x 0.2 x Quarterly P/Book Rating 4.3 3.9 3.9 3.9 3.6 0.0 x Jun Jun Jun Jun Jun Jun Jun Jun Jun Jun 01 02 03 04 05 06 07 08 09 10 Price to Book (P/Book) 3.8 Enterprise Value to EBITDA (EV/EBITDA) 25.0 x (Lower numbers receive higher rankings) EV/EBITDA on Rolling TTM Annual (Fiscal Year) Dec-07 Dec-08 Dec-09 20.0 x * Enterprise Value $ - $ - $ 2.0 $ 590.6 $ 1,278.3 EBITDA $ - $ - $ 11.07 $ 91.06 $ 202.39 15.0 x Annual EV/EBITDA 0.2 x 6.5 x 6.3 x Basis Annual EV/EBITDA Rating 4.9 4.1 4.2 10.0 x Quarterly (TTM) Jun-09 Sep-09 Dec-09 Mar-10 Jun-10 * Enterprise Value $ 950.4 $ 1,294.9 $ 1,278.3 $ 1,265.6 $ 1,690.9 EBITDA $ 53.51 $ 58.10 $ 123.51 $ 200.14 $ 251.65 5.0 x Quarterly (TTM) EV/EBITDA 17.8 x 22.3 x 10.3 x 6.3 x 6.7 x Quarterly (TTM) EV/EBITDA Rating 0.7 0.2 3.0 4.2 4.1 0.0 x Jun Jun Jun Jun Jun Jun Jun Jun Jun Jun 01 02 03 04 05 06 07 08 09 10 Enterprise Value to EBITDA (EV/EBITDA) 4.1 * Price - Delayed 60 days to reflect the fact that financial statements are public approximately 60 days after the last day of the reporting period. For the last period the most recent price is used.
- 10. investorSCOREcard Disclosure and Disclaimer The issuer (“Issuer”) covered under this investor scorecard (“Investor Scorecard”) has paid a fee to or has been charged a fee to produce and distribute this Investor Scorecard. The fee paid or charged for the production and distribution of this Investor Scorecard was not subject to the rankings or information provided herein, nor was any securities of the Issuer accepted as payment for such fee. FSA Financial Science & Art Ltd. (“FSA”), The Equicom Group Inc. (“Equicom”) and their respective employees and directors may have had or from time to time acquire, hold or sell an interest in the listed securities of the Issuer. Unless specified otherwise, all forward looking statements in this Investor Scorecard have been approved by the Issuer, and the Issuer has advised FSA and Equicom, without independent verification by FSA or Equicom that a reasonable basis exists for such forward looking statements. Other information contained in this Investor Scorecard has been compiled by FSA or Equicom from sources believed to be reliable, which may include but not limited to, public information, research reports and discussions with management of the Issuer. Prior to its publication, this Investor Scorecard had been submitted to the management of the Issuer for review for factual accuracy. No representation or warranty, express or implied, is made by FSA, Equicom, its affiliates, any other person that provided information or data for this Investor Scorecard or any person that distributes this Investor Scorecard with respect to the adequacy, accuracy, completeness or timeliness of any information, estimates or opinions provided in this Investor Scorecard. All estimates, opinions and other information in this Investor Scorecard are provided by FSA, Equicom or another party as of the date of this Investor Scorecard. Such estimates, opinions and other information are subject to change without notice, and are provided in good faith but without any legal responsibility. Past performance is no guarantee of future results. This Investor Scorecard is provided for informational purposes only and does not constitute an offer or solicitation to buy or sell any securities discussed herein in any jurisdiction. As a result, the securities discussed in this Investor Scorecard may not be eligible for sale in some jurisdictions. This Investor Scorecard is not, and under no circumstances should be construed as, a solicitation to act as a securities broker, dealer or advisor in any jurisdiction by any person or company that is not legally permitted to carry on the business of a securities broker, dealer or advisor in that jurisdiction. Neither FSA nor Equicom is a registered investment dealer, broker or advisor, has investment banking operations or makes markets in any securities. This Investor Scorecard is prepared for general circulation and to provide an overview of Issuer’s business. This Investor Scorecard does not consider the investment objectives, financial situation or particular needs of any particular person, and is not tailored to the needs of any person receiving this Investor Scorecard. Readers of this Investor Scorecard should obtain professional advice based on their own individual circumstances before making an investment decision. Nothing in this Investor Scorecard constitutes individual investment, legal or tax advice. To the fullest extent permitted by law, FSA, Equicom, Morningstar Inc., its content providers, any other person that has provided information or data for this Investor Scorecard nor any authorized person that distributes this Investor Scorecard accepts any liability whatsoever for any direct, indirect, special or consequential loss (whether in contract or tort even if FSA, Equicom or the other party has been advised of the possibility of such loss) arising from any use of, or reliance on the estimates, opinions or other information contained in this Investor Scorecard. Without limiting the generality of the foregoing, you are prohibited from using or disclosing any personal information contained in the Investor Scorecard for purposes unrelated to the purposes for which the information is made available to you and/or the public under Canadian securities laws, including, without limitation, for secondary marketing purposes, unless you have obtained any and all consents as required under applicable Canadian privacy laws. The information contained in this Investor Scorecard is copyrighted, and it may not be sold or licensed for commercial value or altered, in whole or in part, without prior express written consent of Equicom. Furthermore, Investor Scorecard can only be distributed in its entirety. Information or data herein, including any trade mark, service mark or logo is the intellectual property of FSA, Equicom, Morningstar Inc. and/or its content providers, Issuer or other persons that have provided such information or data, including but not limited to the organizations listed below and their respective content providers. This report was produced in part with information from the following organizations: