PHARMA Target Segmentation Grid (2 plus 2)
•
9 j'aime•1,998 vues

For Pharmaceutical professionals FF segmentation and sizing tool.

Recommandé
Contenu connexe
En vedette
En vedette (9)
Similaire à PHARMA Target Segmentation Grid (2 plus 2)
Similaire à PHARMA Target Segmentation Grid (2 plus 2) (20)
Plus de Walid Saafan
Plus de Walid Saafan (20)
Dernier
Dernier (20)
PHARMA Target Segmentation Grid (2 plus 2)
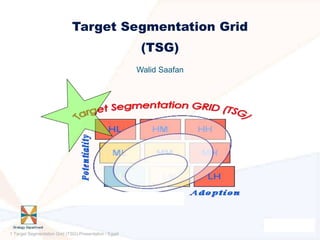
- 1. Target Segmentation Grid (TSG) Walid Saafan 1 Target Segmentation Grid (TSG)-Presentation / Egypt
- 2. Topics Objectives System Inputs Target Drs data collection TAR calls/day per territory Potentiality & Adoption Grid steps definition TSG deliverables TSG check vs IMS Defined Marketing Mix strategies 2 Target Segmentation Grid (TSG)-Presentation / Egypt
- 3. Objectives Redefine target Drs based on their potentiality and adoption (9 boxes grid) per brand. Different overviews about our target Drs. Pre-defined strategies for each Dr type. Assess MR workload. Utilize marketing mix tools to the right target. 3 Target Segmentation Grid (TSG)-Presentation / Egypt
- 4. System Inputs PM Input FF Input PM input FF input GRID steps (L/M/H) Dr Potentiality Target frequency Dr Adoption Target visits/day 4 Target Segmentation Grid (TSG)-Presentation / Egypt
- 5. Target Drs data collection Territ, Territory Name , Brick Sp, Cust.,No. Customer Name , Class, Street/Extension , Bld.,No Potent. Rx share EMAD WASSEF ADEL EDWARD 214 ED 274470 DR. SAMEH ABDEL SHAKOUR A EL TERIA EL BOULAKIA ST. 0 0 Updated Dr data by FF. Potentiality # of packs for therapeutic class FF generated from the physician PER WEEK eg 50 Adoption # of packs for our brand generated by the physician PER WEEK eg 5 Flexibility in grid step definition based on boxes instead of old fixed definition A/B/C. 5 Target Segmentation Grid (TSG)-Presentation / Egypt
- 6. TAR calls/day per territory FF Specify target call visits per territory based on target Drs accessibility on the geographical areas. Zone/ national average target calls calculated. Territory Target call/Day Zone Avg Taret call/Day MAADI 8 .0 HELW AN 8 .0 National 8.7 GUIZA 1 8 .0 Giza 8.4 GUIZA 2 8 .0 GUIZA 3 8 .0 Cairo 8.5 GUIZA 1V 8 .0 Delta 9.0 GUIZA V 8 .0 IMBABA 1 9 .0 ALEX_BEHERA 8.7 IMBABA 2 9 .0 UPPER_EGYPT 9.0 FAISAL 8 .0 EL HARAM 8 .0 FAYOUM 9 .0 BANI SUIF 9 .0 EL MENYA 1 9 .0 EL MENYA 2 9 .0 HELIOPOLIS 1 8 .0 HELIOPOLIS 2 8 .0 HELIOPOLIS 3 8 .0 NASR CITY 8 .0 6 Target Segmentation Grid (TSG)-Presentation / Egypt
- 7. Potentiality & Adoption Grid steps definition Histogram to facilitate the GRID steps definition (L/M/H) based on the distribution of # boxes. Identify potentiality ranges by changing Min/Max intervals PM Potentiality Step Frequency % Potentiality Scale Min 0 120 1.3% Potentiality disctibution 0 L Step 1 5 1459 15.7% 8 M Step 2 10 1560 16.8% 18.0% 50 H Step 3 15 842 9.1% Step 4 20 1088 11.7% 16.0% Step 5 25 312 3.4% Step 6 30 945 10.2% 14.0% Step 7 35 272 2.9% 12.0% Step 8 40 722 7.8% Step 9 45 53 0.6% 10.0% Max 50 590 6.3% 8.0% >Max >50 1331 14.3% 6.0% 4.0% 2.0% 0.0% 0 5 10 15 20 25 30 35 40 45 50 Step 1.3% 15.7% 16.8% 9.1% 11.7% 3.4% 10.2% 2.9% 7.8% 0.6% 6.3% Voltaren PT team 7 Target Segmentation Grid (TSG)-Presentation / Egypt
- 8. TSG deliverables Filter grid results by different criteria/ combinations Zone, IMS Territory, Specialty, GRID Count of Drs & % per Grid (based on the selection criteria) Count of Drs & % per tier. List of all Drs with complete information (based on the selection criteria). Calculate the estimated MR number equivalent based on the defined target call frequency per grid. Compare the territory sales contribution vs MR equivalent contribution in that area. 8 Target Segmentation Grid (TSG)-Presentation / Egypt
- 9. TSG deliverables– cont. Voltaren PT team 9 Target Segmentation Grid (TSG)-Presentation / Egypt
- 10. TSG check vs IMS Compare TSG consolidated data vs IMS units sales /MAT. Decreased IMS units by two identified factors: OTC or repeated RXs % of our Target Dr vs the universe Analysis graphs presented for Total ATC RXs & Our products RXs Three level of details: National/ Zone/ Territory highlight the areas where more than 20% variances exist Ongoing process, Drs list to be updated each cycle Will be included in Siebel Focus cycle. 10 Target Segmentation Grid (TSG)-Presentation / Egypt
- 11. Defined Marketing Mix strategies Defined strategies defined for each grid. 11 Target Segmentation Grid (TSG)-Presentation / Egypt
- 12. Thanks 12 Target Segmentation Grid (TSG)-Presentation / Egypt