SlideShare une entreprise Scribd logo
1  sur  10
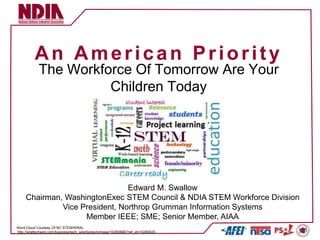
An American Priority
             The Workforce Of Tomorrow Are Your
                       Children Today


                                Edward M. Swallow
     Chairman, WashingtonExec STEM Council & NDIA STEM Workforce Division
              Vice President, Northrop Grumman Information Systems
                    Member IEEE; SME; Senior Member, AIAA
Word Cloud Courtesy Of NC STEM/WRAL
http://wraltechwire.com/business/tech_wire/biotech/image/10265566/?ref_id=10265520
Supply Chain Model
                                          Current STEM Graduates
   Proficient                                                                                                  Graduate
                                           Proficient                              STEM
   (proficient                             Interested
                                                                                                               With STEM
                                                                                   Major
       or                                                                                                       Degree
   advanced)
                                                        17%                                   278,000                     167,000
             32%                                                                               in 2005                     in 2011
                                           Proficient
                                               Not
                                           Interested
      Not                                                                          Non-
                                                        25%                        STEM                  S&E Degrees Awarded Per
   Proficient
                                                                                   Major                      Year (Millions)
   (basic or                                                                                             1.0
                                                                                                         0.8
     below                               Not Proficient                                                  0.6
    basic)                                Interested                                                     0.4                         USA
                                                                                                         0.2                         China
             68%                                                                                         0.0
                                                        15%                       2-year                     199     200
                                                                                  College                      8       6
                                         Not Proficient                                                  Proportion of S&E of first
                                              Not                                                          university degrees in
                                          Interested                                                       China 2006. USA
                                                        42%                                                          47               16
                                                                                                                     %                %
  4,013,000                              2,799,000                             1,170,000                   Total =         Total =
   Beginning  9th                         Grads in class                        Enrolled in 4-              1.7M            1.5M
   grade in 2001                             of 2005                            year College


Elementary                            Secondary                              College                           Career
Source: 2011 Department Of Education, Michael Lach, Special Assistant to Secretary for STEM
                                                                                                                                             2
Careers In STEM – Parental Perspectives


Source: Harris Interactive Report: Student & Parent Survey, Sponsored by Microsoft
May 4–11, 2011, among 854 parents of children ages 17 or younger
Careers In STEM – Student Perspectives


Source: Harris Interactive Report: Student & Parent Survey, Sponsored by Microsoft
May 4–11, 2011, among 500 college students
Careers In STEM – Student Perspectives


Source: Harris Interactive Report: Student & Parent Survey, Sponsored by Microsoft
May 4–11, 2011, among 854 parents of children ages 17 or younger & 500 College Students
Careers In STEM –
                                     Results of Harris Interactive Poll 2011
 •    37% of STEM college students have a parent in STEM
 •    While most parents of K–12 students (93%) believe that STEM education should be a
      priority in the U.S., only half (49%) agree that it actually is a top priority for this country.
        –    76% of parents feel that the U.S. is doing a poor job of teaching STEM compared to other
             countries.
 •    Parents who feel that STEM should be a priority feel this way because they want to
      ensure the U.S. remains competitive in the global marketplace (53%) and to produce
      the next generation of innovators (51%);
        –    Fewer say it’s to enable students to have well-paying (36%) or fulfilling careers (30%).
 •    Even though many parents (50%) would like to see their children pursue a STEM
      career, only 24% are extremely willing to spend extra money helping their children be
      successful in their math and science classes.
 •    More than half (57%) of STEM college students say that, before going to college, a
      teacher or class got them interested in STEM.
        –    Nearly 4 in 5 STEM college students (78%) say that they decided to study STEM in high school
             or earlier. One in five (21%) decide in middle school or earlier.
        –    This is especially true of female students (68% vs. 51% males), who give “a teacher or class” as
             the top factor that sparked their interest.

      Nearly Three-quarters Of STEM Students Report That Their Parents Had At Least
                    Some Influence On Their Decision To Study STEM
Source: Harris Interactive Report: Student & Parent Survey, Sponsored by Microsoft
May 4–11, 2011, among 854 parents of children ages 17 or younger & 500 College Students
A&D Employment – Don’t Believe The Headlines!
    Perishables Related                   Defense spending cuts will occur, but we believe the new floor of spending will
    Market Assessment                     bottom out near ~$450B constant $ ($500-550B current $)


                                 Total US Defense Spending – Budget Authority (FY2013 $B)
          $800
                                                                                                                                                    Obama
                                                                                                                                        Obama       funding
          $700
                                                                                                                                                    projection as
                                                                                                           Bush 2 (W)
          $600
                                                                                                                                                    of 2/2012
                                                                      Reagan
                                                                                              Bush 1 (HW)                                           Possible new
          $500
                          Eisenhower                      Nixon                                                                                     “floor” of
                                                                                                      Clinton                                       ~$450B?
          $400
                                                                                                                                                   Historical
                                                                                                                                                   funding
          $300
                                   20 Year Cycle                          20 Year Cycle                          20 Year Cycle                     “floor” of
                                                                                                                                                   ~$380B
          $200


          $100
                   Korean                          Vietnam                     Reagan                                 Wars in Iraq/
                    War                              War                       Build-Up                               Afghanistan
            $0
                 FY50    FY55      FY60     FY65     FY70      FY75     FY80     FY85      FY90     FY95     FY00      FY05     FY10     FY15

                          5th-8th Graders Now Will Hit The Next Upturn Perfectly!
    Sources: DoD, “National Defense Budget Estimates for FY2012, FY2013 Defense Budget Fact Sheet, Center for New American Policy, RSAdvisors analysis

2                                                               © 2013 Renaissance Strategic Advisors
A&D Age Distributions Indicate Opportunities For
               Today’s Middle Schoolers

Age Cohort      0-499       1,000-9,999 10,000-49,999 50,000-99,999 1000,000+   Average
  22-25           7.1            3.7             3.7            3.2    3.8        4.3
  26-30          11.7            8.7             9.6            8.6    8.5        9.4
  31-35          10.7            9.7            10.5            9.4    8.6        9.8
  36-40          12.7            9.8             9.9            8.9    7.8        9.8
  41-45           9.1           11.6            10.9            9.8    9.6       10.2
  46-50          13.9           16.5            14.4            15.8   17.2      15.6
  51-55          16.1            17             15.5            20     20        17.7
  56-60          10.4           12.3            11.6            14     14        12.5
  61-64           5.7             7              6.2            7.5    6.9        6.7
  65-70            2             2.7             1.9            2.4     2         2.2

      39% Of Current A&D Employees Eligible To Retire in Next 10 Years
Source: Aviation Week & Space Technology Workforce Study 2012
Data as of 6/1/2012
Conceptual Framework For
                       STEM Discussions


Excitement Needs To Start Early – We Lose Them At 5th Grade!
Careers In STEM –
Results of Harris Interactive Poll 2011

Contenu connexe

Similaire à Stem briefing 13 03_12_nysmith_swallow

Technology Academies - YTA and ATA
Technology Academies -  YTA and ATATechnology Academies -  YTA and ATA
Technology Academies - YTA and ATAgbilokonsky
 
Plugging the vocaonal education gap in india
Plugging the vocaonal education gap in indiaPlugging the vocaonal education gap in india
Plugging the vocaonal education gap in indiawadhwanifoundation
 
Changing Employee Skills and Education Requirements—Education Levels of Today...
Changing Employee Skills and Education Requirements—Education Levels of Today...Changing Employee Skills and Education Requirements—Education Levels of Today...
Changing Employee Skills and Education Requirements—Education Levels of Today...shrm
 
Using connect edu student impact data to improve your academy
Using connect edu student impact data to improve your academyUsing connect edu student impact data to improve your academy
Using connect edu student impact data to improve your academyNAFCareerAcads
 
Wsu%20 superintendents%201.6.12[1]
Wsu%20 superintendents%201.6.12[1]Wsu%20 superintendents%201.6.12[1]
Wsu%20 superintendents%201.6.12[1]WSU Cougars
 
Middle School Success
Middle School SuccessMiddle School Success
Middle School SuccessChristin007
 
PTA Minutes - October 2, 2012
PTA Minutes - October 2, 2012PTA Minutes - October 2, 2012
PTA Minutes - October 2, 2012Matthew Foreman
 

Similaire à Stem briefing 13 03_12_nysmith_swallow (10)

Kinder Ready
Kinder ReadyKinder Ready
Kinder Ready
 
Technology Academies - YTA and ATA
Technology Academies -  YTA and ATATechnology Academies -  YTA and ATA
Technology Academies - YTA and ATA
 
Plugging the vocaonal education gap in india
Plugging the vocaonal education gap in indiaPlugging the vocaonal education gap in india
Plugging the vocaonal education gap in india
 
Changing Employee Skills and Education Requirements—Education Levels of Today...
Changing Employee Skills and Education Requirements—Education Levels of Today...Changing Employee Skills and Education Requirements—Education Levels of Today...
Changing Employee Skills and Education Requirements—Education Levels of Today...
 
Using connect edu student impact data to improve your academy
Using connect edu student impact data to improve your academyUsing connect edu student impact data to improve your academy
Using connect edu student impact data to improve your academy
 
Wsu%20 superintendents%201.6.12[1]
Wsu%20 superintendents%201.6.12[1]Wsu%20 superintendents%201.6.12[1]
Wsu%20 superintendents%201.6.12[1]
 
Jane Williams Presentation
Jane Williams PresentationJane Williams Presentation
Jane Williams Presentation
 
Middle School Success
Middle School SuccessMiddle School Success
Middle School Success
 
IHE Success
IHE SuccessIHE Success
IHE Success
 
PTA Minutes - October 2, 2012
PTA Minutes - October 2, 2012PTA Minutes - October 2, 2012
PTA Minutes - October 2, 2012
 

Stem briefing 13 03_12_nysmith_swallow

  • 1. An American Priority The Workforce Of Tomorrow Are Your Children Today Edward M. Swallow Chairman, WashingtonExec STEM Council & NDIA STEM Workforce Division Vice President, Northrop Grumman Information Systems Member IEEE; SME; Senior Member, AIAA Word Cloud Courtesy Of NC STEM/WRAL http://wraltechwire.com/business/tech_wire/biotech/image/10265566/?ref_id=10265520
  • 2. Supply Chain Model Current STEM Graduates Proficient Graduate Proficient STEM (proficient Interested With STEM Major or Degree advanced) 17% 278,000 167,000 32% in 2005 in 2011 Proficient Not Interested Not Non- 25% STEM S&E Degrees Awarded Per Proficient Major Year (Millions) (basic or 1.0 0.8 below Not Proficient 0.6 basic) Interested 0.4 USA 0.2 China 68% 0.0 15% 2-year 199 200 College 8 6 Not Proficient Proportion of S&E of first Not university degrees in Interested China 2006. USA 42% 47 16 % % 4,013,000 2,799,000 1,170,000 Total = Total = Beginning 9th Grads in class Enrolled in 4- 1.7M 1.5M grade in 2001 of 2005 year College Elementary Secondary College Career Source: 2011 Department Of Education, Michael Lach, Special Assistant to Secretary for STEM 2
  • 3. Careers In STEM – Parental Perspectives Source: Harris Interactive Report: Student & Parent Survey, Sponsored by Microsoft May 4–11, 2011, among 854 parents of children ages 17 or younger
  • 4. Careers In STEM – Student Perspectives Source: Harris Interactive Report: Student & Parent Survey, Sponsored by Microsoft May 4–11, 2011, among 500 college students
  • 5. Careers In STEM – Student Perspectives Source: Harris Interactive Report: Student & Parent Survey, Sponsored by Microsoft May 4–11, 2011, among 854 parents of children ages 17 or younger & 500 College Students
  • 6. Careers In STEM – Results of Harris Interactive Poll 2011 • 37% of STEM college students have a parent in STEM • While most parents of K–12 students (93%) believe that STEM education should be a priority in the U.S., only half (49%) agree that it actually is a top priority for this country. – 76% of parents feel that the U.S. is doing a poor job of teaching STEM compared to other countries. • Parents who feel that STEM should be a priority feel this way because they want to ensure the U.S. remains competitive in the global marketplace (53%) and to produce the next generation of innovators (51%); – Fewer say it’s to enable students to have well-paying (36%) or fulfilling careers (30%). • Even though many parents (50%) would like to see their children pursue a STEM career, only 24% are extremely willing to spend extra money helping their children be successful in their math and science classes. • More than half (57%) of STEM college students say that, before going to college, a teacher or class got them interested in STEM. – Nearly 4 in 5 STEM college students (78%) say that they decided to study STEM in high school or earlier. One in five (21%) decide in middle school or earlier. – This is especially true of female students (68% vs. 51% males), who give “a teacher or class” as the top factor that sparked their interest. Nearly Three-quarters Of STEM Students Report That Their Parents Had At Least Some Influence On Their Decision To Study STEM Source: Harris Interactive Report: Student & Parent Survey, Sponsored by Microsoft May 4–11, 2011, among 854 parents of children ages 17 or younger & 500 College Students
  • 7. A&D Employment – Don’t Believe The Headlines! Perishables Related Defense spending cuts will occur, but we believe the new floor of spending will Market Assessment bottom out near ~$450B constant $ ($500-550B current $) Total US Defense Spending – Budget Authority (FY2013 $B) $800 Obama Obama funding $700 projection as Bush 2 (W) $600 of 2/2012 Reagan Bush 1 (HW) Possible new $500 Eisenhower Nixon “floor” of Clinton ~$450B? $400 Historical funding $300 20 Year Cycle 20 Year Cycle 20 Year Cycle “floor” of ~$380B $200 $100 Korean Vietnam Reagan Wars in Iraq/ War War Build-Up Afghanistan $0 FY50 FY55 FY60 FY65 FY70 FY75 FY80 FY85 FY90 FY95 FY00 FY05 FY10 FY15 5th-8th Graders Now Will Hit The Next Upturn Perfectly! Sources: DoD, “National Defense Budget Estimates for FY2012, FY2013 Defense Budget Fact Sheet, Center for New American Policy, RSAdvisors analysis 2 © 2013 Renaissance Strategic Advisors
  • 8. A&D Age Distributions Indicate Opportunities For Today’s Middle Schoolers Age Cohort 0-499 1,000-9,999 10,000-49,999 50,000-99,999 1000,000+ Average 22-25 7.1 3.7 3.7 3.2 3.8 4.3 26-30 11.7 8.7 9.6 8.6 8.5 9.4 31-35 10.7 9.7 10.5 9.4 8.6 9.8 36-40 12.7 9.8 9.9 8.9 7.8 9.8 41-45 9.1 11.6 10.9 9.8 9.6 10.2 46-50 13.9 16.5 14.4 15.8 17.2 15.6 51-55 16.1 17 15.5 20 20 17.7 56-60 10.4 12.3 11.6 14 14 12.5 61-64 5.7 7 6.2 7.5 6.9 6.7 65-70 2 2.7 1.9 2.4 2 2.2 39% Of Current A&D Employees Eligible To Retire in Next 10 Years Source: Aviation Week & Space Technology Workforce Study 2012 Data as of 6/1/2012
  • 9. Conceptual Framework For STEM Discussions Excitement Needs To Start Early – We Lose Them At 5th Grade!
  • 10. Careers In STEM – Results of Harris Interactive Poll 2011

Notes de l'éditeur

  1. http://wraltechwire.com/business/tech_wire/biotech/image/10265566/?ref_id=10265520