2013 Distribution and Logistics Workforce Report
•
0 likes•324 views

This is the newly updated report for logistics and distribution workforce characteristics in Webster City, Iowa. Visit with us today about the opportunities we have for warehousing and distribution in Webster City, Iowa.

Recommended
Recommended
More Related Content
More from Webster City Economic Development
More from Webster City Economic Development (20)
Recently uploaded
Recently uploaded (20)
2013 Distribution and Logistics Workforce Report
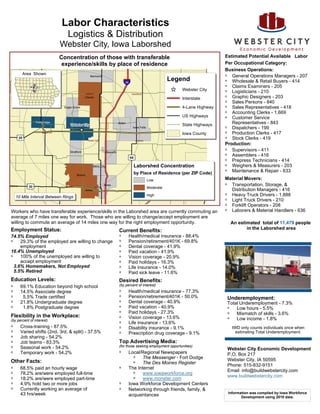
- 1. Labor Characteristics Logistics & Distribution Webster City, Iowa Laborshed Concentration of those with transferable Estimated Potential Available Labor experience/skills by place of residence Per Occupational Category: Business Operations: Area Shown £ ¤ 169 Belmond Legend £ ¤ General Operations Managers - 207 ¦ ¨ §35 21 Wholesale & Retail Buyers - 414 Claims Examiners - 205 HUMBOLDT WRIGHT FRANKLIN _ ^ BREME Webster City Logisticians - 210 Graphic Designers - 203 BUTLER Clarion Interstate Sales Persons - 840 Eagle Grove 4-Lane Highway Sales Representatives - 418 Accounting Clerks - 1,669 US Highways Customer Service Fort Dodge Webster City Alden BLACK HAW State Highways Representatives - 843 Dispatchers - 199 WEBSTER _ ^ Iowa Falls Iowa County Production Clerks - 417 £ ¤ 20 HAMILTON HARDIN GRUNDY Stock Clerks - 419 Production: Stratford Ellsworth Supervisors - 411 Assemblers - 416 £ ¤65 Prepress Technicians - 414 Story City Laborshed Concentration Weighers & Measurers - 203 by Place of Residence (per ZIP Code) Maintenance & Repair - 633 Boone Low TAMA Material Movers: Transportation, Storage, & GREENE £ ¤30 BOONE Ames STORY Ames Moderate MARSHALL Distribution Managers - 416 10 Mile Interval Between Rings High Heavy Truck Drivers - 1,888 Light Truck Drivers - 210 Forklift Operators - 208 Workers who have transferable experience/skills in the Laborshed area are currently commuting an Laborers & Material Handlers - 636 average of 7 miles one way for work. Those who are willing to change/accept employment are willing to commute an average of 14 miles one way for the right employment opportunity. An estimated total of 11,479 people Employment Status: in the Laborshed area Current Benefits: 74.5% Employed Health/medical insurance - 88.4% 29.3% of the employed are willing to change Pension/retirement/401K - 69.8% employment Dental coverage - 41.9% 16.4% Unemployed Paid vacation - 41.9% 100% of the unemployed are willing to Vision coverage - 20.9% accept employment Paid holidays - 16.3% 3.6% Homemakers, Not Employed Life insurance - 14.0% 5.5% Retired Paid sick leave - 11.6% Education Levels: Desired Benefits: 69.1% Education beyond high school (by percent of interest) 14.5% Associate degree Health/medical insurance - 77.3% 5.5% Trade certified Pension/retirement/401K - 50.0% Underemployment: 21.8% Undergraduate degree Dental coverage - 40.9% Total Underemployment - 7.3% 1.8% Postgraduate degree Paid vacation - 40.9% Low hours - 5.5% Paid holidays - 27.3% Mismatch of skills - 3.6% Flexibility in the Workplace: (by percent of interest) Vision coverage - 13.6% Low income - 1.8% Life insurance - 13.6% Cross-training - 87.5% Disability insurance - 9.1% IWD only counts individuals once when Varied shifts (2nd, 3rd, & split) - 37.5% Prescription drug coverage - 9.1% estimating Total Underemployment. Job sharing - 54.2% Job teams - 83.3% Top Advertising Media: Seasonal work - 54.2% (for those seeking employment opportunities) Webster City Economic Development Temporary work - 54.2% Local/Regional Newspapers P,O, Box 217 The Messenger - Fort Dodge Webster City, IA 50595 Other Facts: The Des Moines Register Phone: 515-832-9151 68.5% paid an hourly wage The Internet Email: info@buildwebstercity.com 78.2% are/were employed full-time www.iowaworkforce.org www.buildwebstercity.com 18.2% are/were employed part-time www.monster.com 4.9% hold two or more jobs Iowa Workforce Development Centers Currently working an average of Networking through friends, family, & 43 hrs/week Information was compiled by Iowa Workforce acquaintances Development using 2010 data.
- 2. O Cod M Ex a g M En cc e ed ea pe e W up try ia Occupation n rie n at W W W io nc ag ag ag na ed e e e l Administrative Services Managers 11-3011 $ 29.77 $ 20.65 $ 34.34 $ 30.81 Cleaners of Vehicles and Equipment 53-7061 $ 10.47 $ 8.34 $ 11.53 $ 9.57 Conveyor Operators and Tenders 53-7011 $ 12.99 $ 10.71 $ 14.14 $ 11.54 First-Line Supervisors/Managers of Helpers, Laborers, and Material Movers, 53-1021 $ 22.22 $ 17.04 $ 24.81 $ 22.18 Hand First-Line Supervisors/Managers of Office and Administrative Support 43-1011 $ 21.34 $ 15.85 $ 24.09 $ 18.99 Workers First-Line Supervisors/Managers of Transportation and Material-Moving 53-1031 $ 24.09 $ 9.31 $ 31.47 $ 20.64 Machine and Vehicle Operators Helpers--Production Workers 51-9198 $ 12.40 $ 9.18 $ 14.01 $ 11.37 Industrial Truck and Tractor Operators 53-7051 $ 14.82 $ 11.64 $ 16.40 $ 14.19 Inspectors, Testers, Sorters, Samplers, and Weighers 51-9061 $ 15.30 $ 12.13 $ 16.88 $ 14.66 Laborers and Freight, Stock, and Material Movers, Hand 53-7062 $ 12.58 $ 10.11 $ 13.81 $ 12.56 Logisticians 13-1081 $ 35.43 $ 32.73 $ 36.77 $ 34.90 Machine Feeders and Offbearers 53-7063 $ 13.75 $ 12.42 $ 14.42 $ 13.76 Maintenance and Repair Workers, General 49-9071 $ 16.85 $ 11.90 $ 19.34 $ 16.76 Packers and Packagers, Hand 53-7064 $ 11.54 $ 8.98 $ 12.82 $ 11.99 Production Workers, All Other 51-9199 $ 17.60 $ 13.12 $ 19.84 $ 18.35 Sales Representatives, Wholesale and Manufacturing, Except Technical 41-4012 $ 26.48 $ 12.80 $ 33.33 $ 21.04 and Scientific Products Sales Representatives, Wholesale and Manufacturing, Technical and 41-4011 $ 34.81 $ 17.54 $ 43.45 $ 24.24 Scientific Products Shipping, Receiving, and Traffic Clerks 43-5071 $ 13.60 $ 9.61 $ 15.59 $ 13.22 Stock Clerks and Order Fillers 43-5081 $ 10.12 $ 8.32 $ 11.02 $ 9.23 Switchboard Operators, Including Answering Service 43-2011 $ 11.57 $ 9.41 $ 12.65 $ 11.18 Transportation, Storage, and Distribution Managers 11-3071 $ 36.82 $ 27.52 $ 41.48 $ 36.85 Truck Drivers, Heavy and Tractor-Trailer 53-3032 $ 21.14 $ 13.27 $ 25.07 $ 20.98 Truck Drivers, Light or Delivery Services 53-3033 $ 13.18 $ 8.33 $ 15.61 $ 11.58 Weighers, Measurers, Checkers, and Samplers, Recordkeeping 43-5111 $ 14.30 $ 10.94 $ 15.97 $ 14.04 The 2012 Iowa Wage data for Iowa Workforce Development (IWD) Region 5 was produced by the Labor Force & Occupational Analysis Bureau to provide communities local information on wages by occupation. This publication was developed specifically for the IWD Region 5. The source of the wage and employment data is based on the May 2011 OES estimates. Additional occupational wage and employment data can be found at http://iwin.iwd.state.ia.us/iowa/OlmisZine.