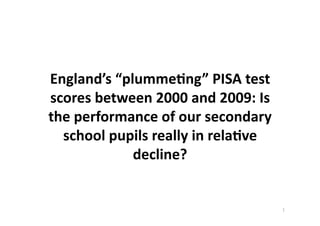
6. Data issues
(1) Change target population
- Wales
- Year 10 / year 11 pupils
(2) Change of test month
- April 2000 / 2003
- November 2006 / 2009
(3) Non - response
F!
7. 0.45 G5H!65I5!
Mean test score (international z-score)
0.4
0.35
0.3
0.25
0.2
2000 2001 2002 2003 2004 2005 2006 2007 2008 2009
C!
8. 0.5 (6J-,I<*1I!K:+!89513*!01!I5+3*I!L:L-45;:1!
0.45
Mean test score (international z-score)
0.4
Estimate 1
0.35 Estimate 2
0.3
0.25
0.2
2000 2001 2002 2003 2004 2005 2006 2007 2008 2009
M!
12. 1234)B")5?.)E,5,8.)
•! ‘PISA for schools’ tests becoming available
•! New domains (e.g. problem solving, financial literacy)
•! Hope to build better engagement with teachers / schools
•! TALIS survey: A cross-national study of teachers
•! ‘Longitudinal PISA’ ! Follow children to see what they do
14. Educational achievement is low in
England compared to East Asia….
….but this is due to what happens
before age 10
">!
15. England a long way behind East Asia
at age 15 /16……
Average PISA
math score
Shanghai 600
Singapore 562
Hong Kong 555
Korea 546
Chinese Taipei 543
Japan 529
Macao China 525
England 492
"E!
16. ….but we are just as far behind at
1 age 9/10
0.8
0.6
0.4
Hong Kong
Japan
Y5L!S*IH**1!
0.2 2134516!516!
Singapore
25,I!(,05!
UK
6:*,!"75)
0 H06*1!
S*IH**1!
@Z"B!516!
Age 9/10 Age 13/14 Age 15/16 "EZ"F!
-0.2