
Recommandé
Contenu connexe
Tendances
Tendances (16)
En vedette
En vedette (20)
Similaire à AN INVESTIGATION OF THE IMPACT OF ATYPICAL PRINCIPAL PREPARATION PROGRAMS ON SCHOOL ACCOUNTABILITY AND STUDENT ACHIEVEMENT IN HIGH-POVERY SCHOOLS by Sheri L. Miller-Williams, Dissertation Chair: William Allan Kritsonis, PhD
Similaire à AN INVESTIGATION OF THE IMPACT OF ATYPICAL PRINCIPAL PREPARATION PROGRAMS ON SCHOOL ACCOUNTABILITY AND STUDENT ACHIEVEMENT IN HIGH-POVERY SCHOOLS by Sheri L. Miller-Williams, Dissertation Chair: William Allan Kritsonis, PhD (20)
Dernier
Dernier (20)
AN INVESTIGATION OF THE IMPACT OF ATYPICAL PRINCIPAL PREPARATION PROGRAMS ON SCHOOL ACCOUNTABILITY AND STUDENT ACHIEVEMENT IN HIGH-POVERY SCHOOLS by Sheri L. Miller-Williams, Dissertation Chair: William Allan Kritsonis, PhD
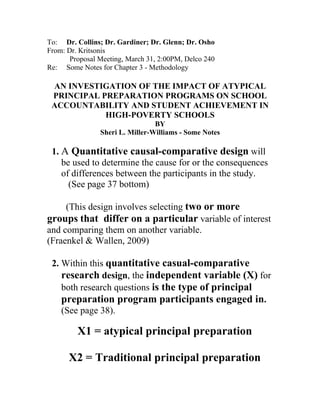
- 1. To: Dr. Collins; Dr. Gardiner; Dr. Glenn; Dr. Osho From: Dr. Kritsonis Proposal Meeting, March 31, 2:00PM, Delco 240 Re: Some Notes for Chapter 3 - Methodology AN INVESTIGATION OF THE IMPACT OF ATYPICAL PRINCIPAL PREPARATION PROGRAMS ON SCHOOL ACCOUNTABILITY AND STUDENT ACHIEVEMENT IN HIGH-POVERTY SCHOOLS BY Sheri L. Miller-Williams - Some Notes 1. A Quantitative causal-comparative design will be used to determine the cause for or the consequences of differences between the participants in the study. (See page 37 bottom) (This design involves selecting two or more groups that differ on a particular variable of interest and comparing them on another variable. (Fraenkel & Wallen, 2009) 2. Within this quantitative casual-comparative research design, the independent variable (X) for both research questions is the type of principal preparation program participants engaged in. (See page 38). X1 = atypical principal preparation X2 = Traditional principal preparation
- 2. 3. The research study also includes two dependent variables. (See page 38, Independent and Dependent Variables) For the first research question, the dependent variable will be the impact on school accountability ratings (Exemplary, Recognized, Acceptable, and Unacceptable) of high –poverty schools in Greater Houston area school districts as measure by the AEIS reports. For the second research question, the dependent variable will be student achievement results of high-poverty schools in Greater Houston area school districts as measured by the Texas Assessment of Knowledge and Skills (TAKS) mathematics and reading scores. 4. The target population for this study is all elementary, middle and high school principals in five targeted school districts in the Greater Houston area. 5. For this study the researcher will employ a two-fold sampling strategy: criterion sampling and the snowballing sampling technique. A sample size of 100 principals will be selected for the study. The sample population will consist of 20 principals selected from each of the five targeted districts. Within this sample, a combination of 10 atypically trained and 10 traditionally trained principals will be included for each district represented in the study. The sample will include 50 atypically trained and 50 traditionally trained principals. (See page 39).
- 3. 6. Criterion sampling involves selecting cases that meet some predetermined criterion of importance. This method of sampling is very strong in quality assurance. It can be useful for identifying and understanding cases that are information rich. Criterion sampling can also provide an important qualitative component to quantitative data. (See page 39, bottom of page) 7. The researcher will also utilize a snowball sampling technique within the study. Snowball sampling is a method used to obtain research and knowledge, from extended associations or through previous acquaintances. Snowball sampling uses recommendations to find people with the specific range of skills that has been determined as being useful. Within this sampling process, an individual or a group receives information from different places through a mutual intermediary. Snowball sampling is a useful tool for building networks and increasing the number of participants. The snowball sampling technique will be utilized to locate people meeting specific criteria that the researcher would not have been able to identify. The advantage of this technique is the ability of the researcher to use those in the field with the knowledge of others who meet the criteria identified for participation in the study. (See page 40). 8. The process of collecting data is known as instrumentation. (Fraenkel and Wallen, 2009). The initial data collection process for this study will include the use of a demographic survey to collect and identify the sample population based on pre-identified criteria. (See page 41).
- 4. 9. The statistical analysis portion of the study will rely solely on quantitative instruments. The instruments will include Texas Assessment of Knowledge and Skills (TAKS) data from the 2008-2009 and 2009-2010 school years gathered from the Academic Excellence Indicator System (AEIS) report published by the Texas Education Agency (TEA) each year. According to the Texas Education Agency (TEA), the Academic Excellence Indicator System (AEIS) pulls together a wide range of information on the performance of students in each school and district in Texas each year. (See page 41, last paragraph) 10. Validity and Reliability - The researcher has elected to use two instruments that have both validity and reliability. (See page 43, bottom, and top of page 44). The quantitative instrument or Academic Excellence Indicator System (AEIS) report is an instrument generated by the Texas Education Agency (TEA) that documents school performance on the Texas Assessment of Knowledge and Skills (TAKS) assessment each year. The Texas Education Agency (TEA) conducts internal tests for validity and reliability each year prior to releasing the reports for review by the general public. “Test reliability” refers to the consistency of inferences researchers make based on the data collected over time, location, and circumstances (p. 463, Frankel and Wallen) (See page 42 at bottom, and page 43).
- 5. The Kuder-Richardson Formula 20 (KR-20) is the measure in which internal consistency is measured. The Kuder-Richardson Formula 20 is a mathematical expression of the classical measurement definition of reliability that validates that as error variance is reduced, reliability increases. (Standard measurement is calculated using both the standard deviation and the reliability of test scores and represents the amount of variance in a score resulting from factors other than achievement). 11.Data Analysis (Pages 46 & 47) Demographic data will be analyzed based on the School Leadership Demographic Survey Instrument. The researcher seeks to identify differences that exist between the independent variable which is the type of principal preparation and to analyze the quantitative data. The researcher will compare the means (sets of scores) from two independent or different groups. The comparison groups will consist of those who have participated in atypical or traditional principal preparation programs. The Independent Sample T-Test will be used to measure differences in the comparison groups. There is one independent variable with two levels (X1 = atypical principal preparation, and X2 = traditional principal preparation).
- 6. For each research question, the researcher has one dependent variable: School Accountability Ratings (Exemplary, Recognized, Acceptable, Unacceptable) and Texas Assessment of Knowledge and Skills (TAKS), student achievement scores in mathematics and reading. The Statistical Package for the Social Sciences (SPSS 13.) will be utilized to analyze the data. Frequencies and percentages will be calculated and represented graphically. The researcher will construct frequency polygons and then calculate the mean and standard deviation of each group if the variable is quantitative. Note: According to Fraenkel and Wallen (2009, p. 370), the most commonly used test for causal- comparative research is the t-test for differences between means. (See pages 47 and 48).