Presentation1.pptx, radiological imaging of prostatic diseases
•Télécharger en tant que PPTX, PDF•
59 j'aime•11,686 vues


Recommandé
Contenu connexe
Tendances
Tendances (20)
Similaire à Presentation1.pptx, radiological imaging of prostatic diseases
Similaire à Presentation1.pptx, radiological imaging of prostatic diseases (20)
Plus de Abdellah Nazeer
Plus de Abdellah Nazeer (20)
Presentation1.pptx, radiological imaging of prostatic diseases
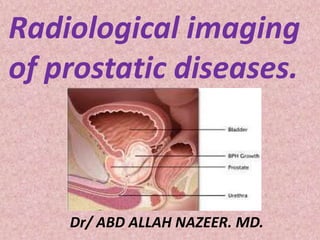
- 1. Radiological imaging of prostatic diseases. Dr/ ABD ALLAH NAZEER. MD.
- 5. prostate gland, chestnut-shaped reproductive organ located directly beneath the bladder in the male, which adds secretions to the sperm during the ejaculation of semen. The gland surrounds the urethra, the duct that serves for the passage of both urine and semen; rounded at the top, the gland narrows to form a blunt point at the bottom, or apex. The diameter in the broadest area is about 4 cm (1.6 inches). The two ejaculatory ducts, which carry sperm and the fluid secreted by the seminal vesicles, converge and narrow in the centre of the prostate and unite with the urethra; the urethra then continues to the lower segment of the prostate and exits near the apex. The prostate gland is a conglomerate of 30 to 50 tubular or saclike glands that secrete fluids into the urethra and ejaculatory ducts. The secretory ducts and glands are lined with a moist, folded mucous membrane. The folds permit the tissue to expand while storing fluids. Beneath this layer is connective tissue composed of a thick network of elastic fibers and blood vessels. The tissue that surrounds the secretory ducts and glands is known as interstitial tissue; this contains muscle, elastic fibers, and collagen fibers that give the prostate gland support and firmness. The capsule enclosing the prostate is also of interstitial tissue.
- 6. In man, the prostate contributes 15–30 percent of the seminal plasma (or semen) secreted by the male. The fluid from the prostate is clear and slightly acidic. It is composed of several protein-splitting enzymes; fibrolysin, an enzyme that reduces blood and tissue fibers; citric acid and acid phosphatase, which help to increase the acidity; and other constituents, including ions and compounds of sodium, zinc, calcium, and potassium. Normally the prostate reaches its mature size at puberty, between the ages of 10 and 14. Around the age of 50, the size of the prostate and the amount of its secretions commonly decrease. Increase in size after midlife, often making urination difficult, may occur as a result of inflammation or malignancy. Males who do not secrete adequate amounts of the male hormone androgen may maintain normal function of the prostate with injections of androgen.
- 7. Zones of Prostate: Central zone (CZ) Cone shaped region that surround the ejaculatory ducts (extends from bladder base to the veru) Likely stems from Wolffian ducts 25% of glandular tissue in young adults Only 1-5% of prostate cancer from this region (likely because of Wolffian duct embryologic origin) Peripheral zone (PZ) Posteriolateral prostate Mesodermal in origin Majority of prostatic glandular tissue Origin of up to 70% of prostate adenocarcinoma Transitional zone (TZ) Surrounds the prostatic urethra proximal to the veru (aka preprostatic urethra) Endodermal in origin In young men, accounts for only 5-10% of prostatic glandular tissue. Only ~20% of prostate cancer arise from TZ Gives rise to BPH "Lobes" of the prostate Enlargement of periuthral tissue in the TZ results in hyperplasia of "lateral lobes“ In some men, hyperplasia of periurethral glands of the TZ at the bladder neck produces a "median lobe" -- tissue mass that can ball-valve into the outlet .
- 8. Imaging in Prostate Carcinoma: Plain radiographs of the pelvis cannot be used to demonstrate localized disease in the prostate, and they are generally only needed in the evaluation of metastatic disease. Most skeletal metastases from prostate cancer (about 85%) are osteoblastic and are visible as an area of abnormal tracer activity on a radionuclide bone scan. In case of doubt, targeted imaging with skeletal radiographs can help distinguish metastatic areas from degenerative disease. CT scanning has little value in demonstrating intraprostatic pathology and in local staging. However, it may be helpful in detecting metastatic disease, such as lymph node involvement or bone metastases. Nodal staging is indicated in patients with a prostate-specific antigen (PSA) value of 20 ng/mL or higher, a clinical stage T2b or higher, and a Gleason score of 7 or higher. CT or MRI scans depict lymph node enlargement and have similar accuracy for the evaluation of lymph node metastases. However, nodal staging relies on assessment of lymph node size, and neither CT scan nor MRI can demonstrate cancer within lymph nodes that are not enlarged.
- 9. Morphologic MRI (T1- and T2-weighted imaging) On T1-weighted images, the prostate appears homogeneous with medium signal intensity; neither the zonal anatomy nor intraprostatic pathology is displayed, but if the MRI is performed after biopsy, post biopsy hemorrhage can be identified as areas of high T1-signal intensity. T2-weighted sequences exquisitely depict the prostatic zonal anatomy. The central gland usually consists of nodular areas of varying signal intensity, depending on the relative amount of hypointense stromal and hyperintense glandular elements. The normal peripheral zone has high signal intensity (as it is mainly composed of numerous ductal and acinar elements with hyperintense secretions). Most prostate cancers can be visualized as low-signal-intensity areas within the high-signal-intensity normal tissue background of the peripheral zone. Because about 70% of all prostate cancers occur within the peripheral zone, morphologic T2-weighed imaging can thus depict the majority of all prostate cancers. On the other hand, low-signal-intensity tumors in the central gland are usually indistinguishable from far more common hypointense stromal hyperplasia. Therefore, central gland tumors are more difficult to detect than peripheral zone cancers. T2- weighted imaging can be performed on a 1.5-Tesla unit, preferably with use of an endorectal coil, or on a 3-Tesla unit. Reported sensitivities (22-85%) and specificities (50-99%) vary widely, the latter illustrating the fact that low-signal-intensity areas are by no means specific for prostate cancer, since benign conditions such as prostatitis, hemorrhage, hyperplastic nodules, or post-treatment (hormonal or irradiation) changes may equally show low signal intensity.
- 10. SPECTROSCOPY – NORMAL SPECTRAL ANALYSIS • 3D proton MR spectroscopic metabolic mapping of the entire gland is possible with a resolution of 0.24 ml per voxel. • Proton MR spectroscopy displays concentrations of citrate, creatine, and choline metabolites found in the prostate gland and cancer. • Normal prostate tissue contains high levels of citrate - higher in the PZ than in the central gland. • Prostatic cancer: higher cell membrane turnover, Higher levels of choline and increased citrate.
- 11. Diffusion-weighted Imaging (DWI). • Diffusion is the process of thermally induced random molecular displacement – Brownian motion • Diffusion properties of tissues are related – Amount of tissue water – Tissue permeability • Cancer tends to have restricted diffusion due to – High cell densities – Abundant intracellular membranes
- 12. TRUS is widely available, well tolerated by patients, and relatively inexpensive. It is optimally performed with high-frequency TRUS probes and the whole prostate is imaged in the transverse and sagittal plane. The prostate volume can be approximated by multiplying the height, depth, and width of the prostate with 0.52 (prolate ellipsoid formula). With TRUS, the prostate is shown to be divided into an isoechoic peripheral zone and a more heterogeneous central gland, comprising the transition zone. Calcifications (corpora amylacea) are common at the boundary between the peripheral zone and the central gland. The seminal vesicles can be visualized as convoluted hypoechoic cystic structures Radionuclide bone scanning after the injection of a technetium-99m (99m Tc) tracer is the current standard for assessing potential bone metastases from prostate cancer in patients with a prostate-specific antigen (PSA) value above 20 ng/mL, a Gleason sum of 4+3 or higher, or in case of symptoms that might be attributable to potential bone metastasis.Bone scans have a high sensitivity but low specificity for metastatic prostate cancer. In case of doubt (eg, degenerative vs metastatic disease), targeted imaging with plain films, CT scanning, or MRI may be necessary. With diffuse bone metastases, a "superscan" may be seen; this superscan demonstrates high uptake throughout the skeleton, with poor or absent renal excretion of the tracer.
- 13. Congenital prostatic abnormalities are not commonly encountered in clinical practice but can provide insight into normal prostatic development. Furthermore, understanding normal prostate embryology and molecular signaling may provide novel approaches to the treatment of prostatic neoplasia. This review examines normal fetal development and congenital pathology of the prostate, including 5-α-reductase deficiency, prostatic ectopia, the prostate in the female pseudohermaphrodite, the prostate in prune belly syndrome, prostatic utricle, and trisomy syndromes. Congenital prostatic abnormalities:
- 14. Ectopic Prostate in the Urinary Bladder
- 15. Inflammatory lesion of the prostate.
- 16. Acute prostatitis with increased blood flow.
- 17. Acute prostatitis with increased blood flow.
- 18. MRI of acute prostatitis.
- 19. Note extensive low signal intensity (asterisks) throughout the peripheral zone, indicative of chronic prostatitis
- 22. Axial and sagittal images of the prostate showing extensive hypoechoic areas. This patient had a prostate-specific antigen level of 17 ng/mL and digital rectal examination findings highly suggestive of cancer. Biopsy revealed granulomatous prostatitis.
- 23. Prostatic abscess - Axial T2W image (A) of the prostate shows a focus of hyperintense signal (arrow) in the left midzone of the peripheral gland. On the axial T1W image (B), the lesion is barely seen. An axial, contrast-enhanced, T1W image (C) shows that the lesion (arrow) has peripheral enhancement and central non enhancement. DWI (b value=800) (D) shows high signal in the lesion (arrow) due to restriction of diffusion. The corresponding ADC map (E) shows low signal (arrow)
- 24. Prostatic abscess - Axial T2W MRI of the prostate (A) shows high signal (arrow) in the central gland, in the left midzone. Axial T1W image (B) shows mixed signal intensity with peripheral hyperintensity (arrow). Axial, contrast-enhanced T1W image (C) shows a peripherally enhancing abscess (arrow). DWI (b=800) (D) shows restriction of diffusion (arrow) in the lesion. The corresponding ADC map (E) shows low signal (arrow).
- 30. Transverse image of the prostate showing a hypertrophied transition zone (yellow arrows) and a compressed peripheral zone (blue arrows).
- 33. Loss of zonal anatomy in two separate patients, due to benign prostate hyperplasia (left) and prior TURP (right).
- 38. MALE CANCER RATES. 0 2 4 6 8 10 12 14 16 18 prostate Lung Colon Rectal Bladder Lymphoma Melanoma Oral Kidney
- 39. RISK OF PROSTATE CANCER BY AGE* • < 39 years 1 in 10,100 • 40-59 years 1 in 38 • 60-79 years 1 in 14 • Lifetime 1 in 6 *American Cancer Society 2006
- 40. T STAGE (EXTENT OF THE TUMOR). • TX: Primary tumor cannot be assessed • T0: No evidence of primary tumor • T1: Clinically unapparent tumor not palpable nor visible by imaging – T1a: Tumor incidental histologic finding in 5% or less of tissue resected – T1b: Tumor incidental histologic finding in more than 5% of tissue resected – T1c: Tumor identified by needle biopsy (e.g., because of elevated PSA) • T2: Tumor confined within prostate* – T2a: Tumor involves 50% or less of one lobe – T2b: Tumor involves more than 50% of one lobe but not both lobes – T2c: Tumor involves both lobes • T3: Tumor extends through the prostate capsule** – T3a: Extra capsular extension (unilateral or bilateral) – T3b: Tumor invades seminal vesicle(s) • T4: Tumor is fixed or invades adjacent structures other than seminal vesicles: bladder neck, external sphincter, rectum, levator muscles, and/or pelvic wall
- 42. TUMOR STAGE
- 43. Transrectal ultrasonographic imaging of prostate carcinoma (prostate-specific antigen level = 1.8 ng/mL). Biopsy showed a Gleason score of 3 + 3. (A) Transverse image reveals a slightly more echogenic peripheral zone (pz) and the carcinoma nodule (n) as a more hypoechoic focus. cg = central gland. (B) Sagittal image reveals a hypoechoic nodule (arrow). sv = seminal vesicle.
- 44. Sagittal image of the prostate showing a hypoechoic area (white arrow). This area was a focus of cancer on biopsy findings Contrast-enhanced ultrasound showing an enhancing prostate cancer.
- 45. Grayscale ultrasound showing a hypoechoic nodule in the left peripheral zone (arrow). There is interruption of the normal green band on elastography with a stiff area that corresponds to the nodule. Biopsy confirmed Gleason grade 7 prostate cancer.
- 47. Cancer prostate.
- 48. T2 stage prostate cancer 2D T2W axial image on the left. 3D T2W axial image on the right. Arrows depict a focal area of low signal intensity within the normal high signal intensity peripheral zone consistent with T2 stage cancer.
- 49. T2 stage prostate cancer 2D T2W images on the left. 3D T2W images on the right. Coronal images upper row. Sagittal images lower row. Arrows depict a focal area of low signal intensity within the normal high signal intensity peripheral zone consistent with T2 stage cancer.
- 50. T3a stage prostate cancer. upper image: 2D T2W axial image lower image: 3D T2W axial image Arrows depict extracapsular extension of a focus of low signal intensity on the left consistent with T3a prostate cancer
- 51. T3b prostate cancer Upper image: 2D T2W axial image Lower image: 3D T2W axial image Arrows depict focus of low signal intensity within the seminal vesicles consistent with T3b prostate cancer.
- 52. Imaging of the prostate with and without endorectal coil. (A) Transverse image of the prostate performed with phased-array coils without an endorectal coil reveals adequate differentiation of the central gland (cg), peripheral zone (pz), and the tumor nodule (n). However, visualization of the prostatic capsule near the tumor is poor (arrow). (B) Transverse image of the prostate with the endorectal coil shows the central gland (cg), peripheral zone (pz), and tumor nodule (n), with better visualization of the prostatic capsule near the tumor (arrow).
- 53. Typical appearance of prostate carcinoma on magnetic resonance imaging. Subsequent biopsy revealed a Gleason score of 4 + 4. (A) T1- weighted image shows homogeneous low signal of the prostate (p), with no discrimination of the central and peripheral gland. The tumor nodule is not seen because no tissue contrast is present between the tumor and peripheral zone. The neurovascular bundles (black arrows) are seen laterally. (B) T2-weighted image shows the lower-signal intensity tumor (n) compared to the curve from zone on either side. (C) Coronal image shows the tumor nodule (n) with the adjoining apical prostatic capsule shown (arrow). (D) Early-phase gadolinium chelate-enhanced sections from a fast 3-dimensional gradient echo sequence show rapid intense enhancement of the tumor nodule (n), manifested by brighter signal intensity in the rest of the prostate, with tumor extending laterally to greater extent than is apparent on the T2-weighted image.
- 54. Prostatic carcinoma on magnetic resonance imaging with diffusion-weighted imaging of a patient with a prostate-specific antigen level of 3.1 ng/mL. Subsequent biopsy revealed a Gleason score of 3 + 4 with extracapsular extension. (A) T2-weighted and rectal coil image reveals a tumor nodule (n) contrasted with a higher-signal intensity peripheral zone. The central gland (cg) is expanded by benign prostatis hyperplasia, which has a lower signal intensity. (B) Apparent diffusion coefficient (ADC) map of the prostate reveals that the tumor nodule (n) has a lower signal intensity than the peripheral zone or the central gland (cg). Low signal intensity indicates that the ADC is lower than that of water and the water diffusion within the tumor is restricted. The ADC map is calculated from a set of three images at the same level (not shown) and performed with three different magnitudes of strength of diffusion-encoding gradients. (C) Early-phase gadolinium chelate-enhanced slice from a fast 3-dimensional gradientecho sequence reveals rapid, intense enhancement of the tumor nodule (n). Portions of the central gland (cg) also reveal rapid enhancement.
- 55. Typical enhancement characteristics of a tumor on dynamic contrast-enhanced images in a patient with a prostate-specific antigen level of 15 ng/mL. Biopsy showed a Gleason score of 4 + 4. (A) Transverse T2-weighted image reveals a tumor nodule (n) involving both the central gland and the peripheral zone on the right side of the prostate. The arrow points to the capsular involvement on the right. (B) Early-phase gadolinium chelate-enhanced slice from a fast 3-dimensional gradient-echo sequence reveals a rapid, intense enhancement of the tumor nodule (n) on the right side of the prostate. (C) Late-phase enhanced T1-weighted image reveals the tumor nodule (n) with a lower signal intensity, indicating washout of the contrast compared with the rest of the prostate. Typically, a tumor demonstrates early enhancement and early washout (as shown in this case).
- 56. Axial T2 and DCE images show a 9 x 7 x 9 mm tumor abutting the capsule. A distinct capsule can still be seen, suggesting capsular infiltration without ECE.
- 57. T2-weighted imaging (left) of a man with extensive Gleason 3+4 tumor shows low signal thoughout the peripheral zone corresponding to tumor. Very high b-valued high-resolution DWI (right) image shows restricted diffusion in the same tumor compared to normal prostate.
- 58. Axial T2W–MRI, b | apparent diffusion coefficient map of diffusion-weighted MRI, and c | raw DCE–MRI demonstrate a 1 cm right apical mid-peripheral zone lesion (asterisk). d | Magnetic resonance spectroscopy shows an elevated choline.
- 59. Axial T2W–MRI, b | apparent diffusion coefficient map of DW–MRI, and c | raw DCE–MRI demonstrate a large 5 cm lesion, which affects almost the entire prostate (asterisk). d,e | The lesion has extra capsular extension.
- 60. Cancer prostate at the peripheral zone with high Choline peak and a low Citrate peak are evident.
- 61. Peripheral prostate cancer in the right middle gland, producing a capsular bulging (arrow) with high choline peak and low citrate.
- 62. Focal (A) and multifocal (B) distribution of prostate carcinoma within the prostate gland (arrows). Scatter plots of the segmental 11C-choline maximal standardized uptake value reveal higher 11C-choline maximal standardized uptake values in most segments with prostate carcinoma compared with segments with benign histopathological lesions. From Reske SN, Blumstein NM, Neumaier B, et al. Imaging prostate cancer with 11C-choline PET/CT.
- 63. Gentleman with prostatectomy 10 years previously. External beam radiation 1 year previously for a rising PSA. The PSA continued to increase up to 6.9 ng/mL. The 3 dimensional Carbon-11 Acetate PET/CT images show a small metabolic lymph node in the left pelvis (yellow arrows). This would not have been diagnosed on CT alone based on its small size. Other areas of ‘red’ seen on the images are of normal Carbon Acetate in the intestines, kidneys, liver and spleen. No other lesions were seen. The left pelvis node was treated with IMRT and the PSA then decreased to 0.9 ng/mL, confirming involvement of the identified node.
- 64. Gentleman with Gleason 7 prostate cancer and external beam radiation (EBRT) to the prostate 4 years previously. PSA nadir was 0.43ng/mL. Rising PSA to 3.9 ng/mL. The 3 dimensional Carbon-11 Acetate PET/CT images show a metabolic focus in the right side of the prostate gland (yellow arrows). No other lesions were seen. The prostate recurrence was confirmed by biopsy with subsequent Brachytherapy performed. The PSA decreased to 0.6 ng/mL after treatment.
- 65. Gentleman with Gleason 6 prostate cancer. Brachytherapy and external beam radiotherapy 12 years previously. PSA nadir was 0.16 ng/mL. Rising PSA to 2.17 ng/mL. The 3 dimensional Carbon-11 Acetate PET/CT images show a single small metabolic lymph node in the left upper pelvis (yellow arrows). As in Case example #1, this would not have been diagnosed on CT alone based on its small size. Bilateral pelvic lymph node dissection was performed with 13 nodes removed. The node identified on the C11-Acetate imaging study was confirmed to be involve with prostate cancer (Gleason 4+4=8) and all other removed nodes were negative/benign, confirming the solitary finding on the imaging study. The PSA decreased to 0.19 ng/mL after the lymph node surgery.
- 67. Prostatic sarcoma is an uncommon and heterogenous group of tumour arising from mesenchymal cells in and around the prostate. In children the most common tumour type is a prostatic rhabdomyosarcoma, which accounts for approximately a third of all prostatic sarcomas . In adults leiomyosarcomas are most common, accounting for approximately a quarter of all cases . Many other sarcomas have been reported although in general they are rare. Overall prostatic sarcomas include: rhabdomyosarcoma : most common in children leiomyosarcoma : most common in adults sarcomatoid carcinoma malignant fibrous histiocytoma phyllodes tumour (also known as cystosarcoma phyllodes of the prostate) undifferentiated stromal sarcoma
- 68. Sarcoma of the Prostate.
- 70. Sarcoma of the Prostate.
- 71. Sarcoma of the Prostate.
- 72. Two cases of primary prostatic B cell lymphoma.
- 74. Metastasis of a cecal adenocarcinoma to the prostate.
- 77. Thank You.